
Abstract
A pivotal aspect in increasing the sensitivity of the Advanced LIGO detectors to allow the first gravitational wave detection, GW150914, was the installation of the monolithic fused silica suspensions. The 40 kg test mass suspended by four 400 μm fused silica fibres lowers the thermal noise as compared to initial LIGO. There is a desire for the use of thinner fibres to suspend smaller optics for other experiments of interest to the gravitational wave community that the current aLIGO fibre pulling machine is not capable of. We present here an overview of a new CO2 laser-based micron scale diameter fibre pulling machine developed at the University of Glasgow, based on the principals of our current aLIGO fibre pulling machine. We also discuss the upgraded fibre characterisation apparatus for dimensional and strength testing. It was found that fibres with a minimum diameter between 7.6 and 9.3 μm had an average breaking stress of 2.7 GPa and a Young's modulus value of 63.3 GPa, which is lower than the accepted bulk value of 72 GPa. Fibres with an average diameter between 13.2 and 17.8 μm had higher breaking stress and Young's modulus values ranging between 3.7–4.0 GPa and 71.8–75.9 GPa, respectively.
Export citation and abstract BibTeX RIS

Original content from this work may be used under the terms of the Creative Commons Attribution 3.0 licence. Any further distribution of this work must maintain attribution to the author(s) and the title of the work, journal citation and DOI.
1. Introduction
Long baseline interferometers are currently used to detect gravitational waves radiating from massive astronomical objects in our universe by sensing the displacement of the two suspended mirrors at the end of each arm [1–3]. The Laser interferometer gravitational-wave observatory (LIGO) Scientific Collaboration announced in February 2016 their first detection of a gravitational wave signal at the two advanced LIGO (aLIGO) detectors [4] in Hanford, Washington and Livingston, Louisiana that was radiated from the merger of two black holes—GW150914 [5]. Two black holes of 36 and 29 solar masses, respectively, merged to create a single black hole of 62 solar masses. During the merger, three solar masses worth of energy was radiated away in the form of gravitational waves. A second detection, GW151226 [6], was reported a few months later with two lighter black holes of 14.2 and 7.5 solar masses coalescing to form a 20.8 solar mass black hole. During the second operating run, there were numerous confirmed detections. Notably, the third observed signal of a binary black hole coalescence—GW170104 [7], the first triple detector detection that included both aLIGO detectors and the advanced Virgo detector [2] in Italy—GW170814 [8], the first binary neutron star (BNS) signal—GW170817 [9] and the lightest binary black hole coalescence observed so far—GW170608 [10].
A key part in detecting gravitational waves was the upgrades that took place to bring the detectors from its first generation status, initial LIGO [11], to its second generation status, aLIGO. One key new technology implemented in aLIGO is the quadruple stage suspension system with a monolithic fused silica final stage to lower several noise sources [12]. These suspensions consist of a four stage pendulum system to limit the seismic noise. The material chosen for the optics and fibre suspensions was fused silica to limit the thermal noise [13]. A key property of fused silica is that it has an extremely low mechanical loss. Fused silica is also extremely strong with a high tensile stress, with aLIGO fibres failing at around 4.4 GPa [14], which is significantly larger than the operational stress of 780 MPa to which these are loaded to [15].
There is a desire to produce shorter and thinner fibres than that used in the aLIGO suspensions for advance prototype test experiments. The Sagnac speed meter (SSM) is currently under construction at the University of Glasgow [16]. The aim of this proof of concept experiment is to reduce back-action noise to allow better sensitivity in the low frequency region than is possible with a Michelson interferometer. This experiment aims to utilise fused silica fibres of diameters of 10 and 20 μm to suspend 1 g and 100 g optics, respectively. At the Albert Einstein Institute (AEI) in Hannover, the AEI 10 m prototype interferometer [17] is looking at increasing sensitivity through the use of squeezed light and will also utilise 20 μm fused silica fibres to suspend 100 g optics. To suspend these optics, a new fused silica fibre pulling machine dedicated to producing short and thin fused silica fibres was developed together with suitable fibre characterisation apparatus.
2. Design of pulling machine
The production of silica fibres for gravitational wave suspensions has evolved through several generations and bespoke processes and hardware have been developed [18–20]. An early example of developed hardware would be the production of silica ribbons that were produced by heating the stock with an oxygen-hydrogen torch until molten with two arms pulling the stock apart [18].
The pulling machine discussed in this paper, renderings shown in figure 1, is based on similar concepts to the aLIGO silica fibre pulling machine that was designed and developed in Glasgow [19]. In principle, a rod of fused silica stock is held in place with two clamps, one of which is attached to a moving stage and the other fixed in place. A CO2 laser is directed around an optical bench with mirrors and passed through a lens system to a cone tip mirror, referred to as an 'axicon', that spreads the beam out to a conical mirror. The beam travels from this conical mirror as a cylindrical beam to another conical mirror, referred to as the feed mirror. This mirror focuses the beam onto the fused silica stock. Once molten, the pulling stage is moved to allow the fibre to be pulled from the stock.
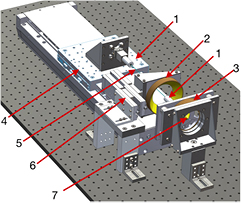
Figure 1. SolidWorks rendering of the thin fibre pulling machine with the labels corresponding to the following: 1-stock clamps, 2-feed conical mirror, 3-fixed conical mirror, 4-pulling stage, 5-fused silica stock, 6-feed mirror stage, 7-axicon.
Download figure:
Standard image High-resolution image
Figure 2. Thin fibre pulling machine in its current set up with labels corresponding to the following: 1-conical mirrors, 2-lens system, 3-pulling stage, 4-CO2 laser.
Download figure:
Standard image High-resolution imageThe pulling stage is a Newport IMS-400LM motorised stage, connected to the Newport XPS-DRV02 Driver. The stage has a maximum velocity and acceleration of 500 mm s−1 and 26 000 mm s−2, respectively, with a total travel range of 400 mm. The feed mirror is mounted on two Thorlabs MTS50-Z8 motorised stages, each connected to a TDC001 Thorlabs APT-DC Servo Controller. These stages have a maximum velocity and acceleration of 2.4 mm s−1 and 4.5 mm s−2, respectively. The total travel range of each stage is 50 mm. The drivers for the pulling stage and the feed stages are controlled by a custom LabVIEW program. A text file can be uploaded to the program containing values for the velocity, acceleration and time variables to drive the pulling stage. The program also utilises the internal position encoders of the stages to allow absolute and relative position movements at velocities and accelerations predetermined by the user.
The CO2 laser can be controlled via either a manual controller or through the LabVIEW program. The lens system consists of a plano-concave and plano-convex lens with focal lengths of 100 mm and 110 mm, respectively. They are positioned on the bench to give a beam waist around the silica stock of approximately 105 μm.
There are two main design changes between the thin fibre pulling machine and the aLIGO pulling machine. Firstly, the pulling stage is parallel instead of perpendicular to the bench. This is due to the pulling stage operational requirements as well as gravity affecting the maximum acceleration of the pulling stage. The second change is the use of an axicon, instead of a rotating 45° mirror.
The silica stock is held in place via metal collets with a 2 mm diameter hole that sits in a steel chuck housing. The collets are hand tightened with a nut that sits over it. This can be seen in figure 3. One clamp is attached to the back of the faceplate of the axicon mirror and the other on the pulling stage. The clamps are sitting on X-Y translation stages to allow the alignment of the silica stock. Extraction of the fibre from the pulling machine is achieved via the use of a fibre cartridge. The cartridge consists of two aluminium rods that connect the two chucks that the fibre ends sit in. Connecting the two ends creates one robust unit that can then be extracted out of the holders of the pulling machine to be stored away. Extracting the fibre out of the cartridge can be achieved by cutting with the light from a CO2 laser.
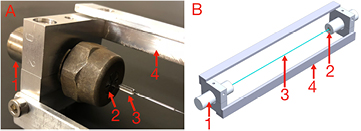
Figure 3. (A) One end of a fibre cartridge with labels corresponding to the following: 1-chuck, 2-collet with 2 mm diameter hole in middle, 3-fused silica stock, 4-cartridge rods. (B) SolidWorks rendering of fibre cartridge.
Download figure:
Standard image High-resolution image2.1. Alignment
Ensuring that the beam hits the tip of the axicon and not at an angle or offset is critical for uniform heating around the silica stock. Failure to due so will result in an uneven distribution of the beam around the silica stock that can have an effect on the shape of the fibre that is produced. Examples of misalignment can be seen in figure 5. Proper alignment is achieved by placing irises and targets along the beam path and lens holders to ensure the beam is parallel to the optical bench. The beam is then directed onto the tip of the axicon via the vertical and horizontal translation stages that are adjusted using micrometers.

Figure 4. 2D cross section illustration of the beam delivery to the stock.
Download figure:
Standard image High-resolution image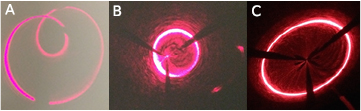
Figure 5. The progress of aligning the axicon and laser beam: (A) beam distribution when hitting tip of axicon at an angle. (B) Translation misalignment. (C) Ideal alignment.
Download figure:
Standard image High-resolution imageThe two conical mirrors are aligned mechanically to each other to ensure that they are coaxial. The axicon is fixed to a plate holder that is machined such that it sits centrally to the fixed conical mirror. Spirit levels are used to ensure that the pulling stage and conical mirrors are parallel to the optical bench.
A second method to check whether the faceplate the axicon is attached to is perfectly perpendicular to the bench can be used. That is to project a far field image of the beam with the alignment laser after it reflects off the first conical mirror. If the beam is hitting the axicon at the tip perfectly and the axicon is sitting in the correct position, a perfect circle should be projected in the far field. If not, then a non-circular pattern will occur. This is shown in figure 5. This could occur if there is an angular misalignment of the cylindrical spacers that hold the two face plates together.
The coaxial alignment of the two conical mirrors can be achieved by clamping in an opaque rod in place of silica rod and observing the distribution of the alignment beam around the stock. If everything is perfectly aligned, there should be a narrow beam going all the way around the circumference of the rod. If the feed mirror is set at an angle, then the alignment beam will take the shape of an ellipse going around the stock.
The final check to ensure that the components are all aligned properly is to heat up a piece of silica stock and see if there is any deformation of the stock during the heating process. If the clamps are slightly out of alignment, then the silica stock will be misshapen in the heated region indicating that the clamp on the pulling stage needs a slight translation.
3. Pulling procedure
There are currently two methods to producing fibres from the pulling machine, one of which has significant advantages over the other: absolute position movement and velocity profile movement. The pulling stage and the feed mirror stage can be controlled such that the stages would move to a given position at a set acceleration and velocity. The pulling stage has a position range of −200 mm to +200 mm, giving a total travel of 400 mm. This total travel is reduced by approximately 30 mm to allow the extraction of the fibre from the clamp holders. The feed mirror has a position range of 0 mm–50 mm. Once the silica stock is heated to its molten temperature, the stage can then travel to a position in its range to produce a fibre.
3.1. Absolute position method
This method of fibre production involves directing the pulling stage to move to a fixed position at a constant velocity. The CO2 laser heats around a circumference of the fused silica stock and through the LabVIEW program, the stage can be controlled to move to a specific position between −200 and +200 to produce a fibre.
All fibres produced showed similar artefacts along the length of the fibre. Examples of this are seen in figure 6 where the right hand side of the graph represents the end of the fibre that was on the fixed clamp and the left hand side of the graph is representing the end of the fibre that was on the moving pulling clamp. At the start of the pull, the fibre would have a 'bump' that would appear where the fibre will thicken slightly after initially pulling down before tapering down to the end of the pull. This would not be an ideal fibre that could be used to suspend optics as these artefacts could have an affect on the dynamics of the suspension such as the bending points of the fibre [12]. This is a very common artefact that can be reduced by varying the velocity of the pulling stage during the pull.

Figure 6. A selection of 20 cm long fibres that were pulled at a constant velocity of 500 mm s−1.
Download figure:
Standard image High-resolution imageUsing this method for the production of 5 mm long 100 μm diameter fibres for the potential use in gravimeters has been attempted on this machine, with further development to be looked at in the future.
3.2. Velocity profile method
The pulling stage velocities and accelerations can be programmed to change mid-pull via the use of a velocity profile. The velocity profile is a file that is uploaded to the pulling stage that contains three columns: stage velocity, stage acceleration and travel time at stated velocity. The stage will accelerate (or decelerate) to the desired velocity and will travel at this velocity for the stated time before moving onto the next value.
Depending on the size of stock used and the desired fibre diameter, a two stage pull may be required. This consists of pulling down the silica stock first to an intermediate diameter, then pulling down from this new diameter stock to the desired diameter fibre. This method of producing fibres resulted in the production of repeatable fibres. The two artefacts, tapering and the 'bump', that were experienced in the absolute position fibres could be minimised by fine tuning the velocity profiles.
A range of diameters can be achieved using the same velocity profile by increasing or decreasing the velocity of the feed mirror; the faster the feed mirror, the more stock the fibre has to pull from and vice versa. A selection of fibres are shown in figure 7 that have a minimum fibre diameter ranging between 10 and 15 μm. The feed mirror motor stage was set to move at a constant 0.05 mm s−1 while the second stage pull is happening.
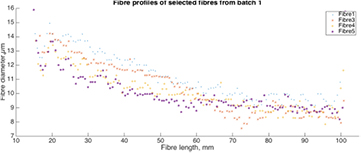
Figure 7. A selection of approximately 10 cm long, 10 μm diameter fibres that were pulled with various velocity profiles, profiled with a ×12 magnification.
Download figure:
Standard image High-resolution imageThe velocity profile that produced the fibres in batch 1 was designed initially for use in producing fibres for suspending optics in the SSM [16]. These fibres satisfied the thermal noise requirements and were therefore used as a starting point for further modifications in batches 2–4. Best attempts were made to minimise the 'bump' artefact that was previously described in figure 6.
4. Characterising fibre diameter and Young's modulus
Characterisation of fused silica thin fibres produced for the purpose of suspending optics in gravitational wave detectors is essential to understand the nature of the fibres. A key property of fused silica is the high tensile strength [14]. This is evident in the design of the monolithic suspension installed in the aLIGO detectors that helped increase the sensitivity of the detector by a factor of 10 [12, 21].
4.1. Fibre profiles
Fibres that were produced for the aLIGO monolithic suspensions were profiled to determine the diameter of the fibre using a dimensional characterisation apparatus [20]. This apparatus, referred to as a fibre profiler, uses a shadow measurement concept to obtain the fibre diameter. The thin fibres discussed in this section were profiled with an upgraded camera magnification and resolution, shown in figure 8, to reduce the error associated with the fibre diameter due to focusing and depth of field with a maximum magnification of ×28 and resolution of  .
.
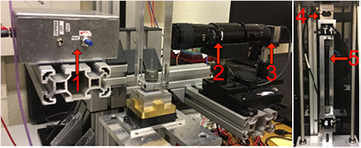
Figure 8. Fibre high magnification profiler (left) and strength tester (right) with a fibre cartridge in place to characterise thin fibres. Labels: 1-LED, 2-high magnification lens system, 3-camera, 4-load cell, 5-fibre cartridge.
Download figure:
Standard image High-resolution imageThe profiler stage utilises a 0.1 mm positional encoder to allow precise 0.1 mm intervals as the camera travels up the fibre. This allows a greater number of measurements to be taken in the thin section of the fibre. Figure 9 shows the range of magnifications available, with  being the high magnification of the aLIGO profiler and
  being the maximum magnification of the upgraded profiler. The magnification used will depend on what diameter fibre and stock is in the profiler or depending on what aspect of the fibre is being investigated. The fibres discussed in this section were profiled with a magnification of
  to allow the 450 μm stock section to be profiled with the thin section of the fibre. If only the thin section of the fibre was desired, then the maximum magnification can be used.
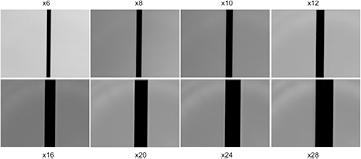
Figure 9.  μm nickel-chromium wire at various magnifications to illustrate image resolution.
Download figure:
Standard image High-resolution imageThe fibres used in this paper were split into four separate batches. Each batch was pulled using different pulling velocity profiles to provide a wide diameter range of tested fibres. Figure 7 shows the profiles of a selection of fibres that were pulled from batch 1.
4.2. Young's modulus measurements
The Young's modulus of the fibre, Y, is the ratio of the stress and strain placed on the fibre:

where the stress, σ is defined as:

where F is the force applied on fibre and Amin is the minimum cross-sectional area of the fibre. The strain,  , is defined as:

where  is the total extension of the fibre and L is the length of the fibre. The error for the strain of the fibre,
  , can be expressed as:

The error associated with the Young's modulus,  , can be defined by:

This can only be applied if the fibre diameter was uniform all the way through the thin section of the fibre. This is not the case as there is some fluctuation that occurs during the fibre pulling process. The Young's modulus can instead be calculated by breaking up the fibre into equal intervals determined by the profiler stage positional encoder divisions. The extension of the nth interval,  , is calculated via:

where An is the area of the segment and all other symbols hold prior meanings. The total extension of the fibre,  , can then be calculated via:

Equating the theoretical extension of the fibre with the experimental extension of the fibre will yield the Young's modulus of the fibre.
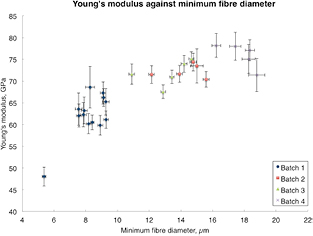
The breaking force of the fibre is obtained via stretching the fibre to the point of destructive failure. The fibre cartridge is placed into the clamps of the strength tester. One clamp is attached to a load cell and the other to a plate with a lead screw through it. The lead screw is attached to a stepper motor and stretches the fibres to exert a force on the load cell. The position of the moving plate is read out via a magnetic encoder. This allows the position of the plate to be read out at the point of fibre failure. Both the encoder and load cell is read out to a custom LabVIEW program. Literature value for the Young's modulus of bulk fused silica is 72 GPa [22]. The range of minimum diameter, breaking stress and Young's modulus values are shown in table 1. The range of Young's modulus values is also shown in figure 10.
Figure 10. Young's modulus values of the tested fibres with corresponding minimum diameters.
Download figure:
Standard image High-resolution image
Table 1. The range of minimum diameter, breaking stress and Young's modulus values for the 4 batches of tested fibres.
| Batch | Minimum diameter (μm) | Breaking stress (GPa) | Young's modulus (GPa) |
|---|---|---|---|
| 1 | 7.6 ± 0.2 → 9.3 ± 0.2 | 2.0 ± 0.1 → 3.0 ± 0.1 | 59.8 ± 2.3 → 68.6 ± 4.8 |
| 2 | 12.2 ± 0.2 → 15.6 ± 0.2 | 3.3 ± 0.1 → 4.0 ± 0.1 | 70.4 ± 1.8 → 74.4 ± 2.0 |
| 3 | 10.9 ± 0.2 → 14.7 ± 0.2 | 3.4 ± 0.1 → 4.1 ± 0.1 | 67.5 ± 1.5 → 75.1 ± 1.7 |
| 4 | 16.2 ± 0.3 → 18.8 ± 0.5 | 3.7 ± 0.2 → 4.1 ± 0.2 | 71.4 ± 3.8 → 78.2 ± 2.7 |
Batch 1 fibres, which consisted of a total of 13 fibres, showed a tendency to break at stresses lower than 3 GPa, with an average of  GPa breaking stress. This gave a Young's modulus average value of
  GPa. One fibre in particular had a low Young's modulus value of
  GPa. This fibre had a sharp 2 μm dip in diameter towards the end of the fibre as it tapers up to the stock. This is a possible reason for the lower breaking stress of this fibre. This fibre was therefore treated as an outlier and not included in the average Young's modulus shown in table 1, but is shown in figure 10. Further investigation is needed to determine how significant an artefact of this nature effected the strength of the fibre and its resulting Young's modulus value. Including this fibre into the average Young's modulus of this batch lowers it by approximately 2% to 62.2 ± 2.7 GPa. Fibre batches 2–4, with each batch consisting of five fibres all gave an average value that was in the region of the expected Young's modulus value for fused silica. Batch 1 fibres had the smallest diameter out of all that were tested.
The error associated with the Young's modulus is calculated by combining the errors associated with the stress and strain applied on the fibre. The error is dominated by the fibre diameter error. This is calculated from the systematic error associated with the diameter measurements. The standard deviation of the systematic errors for all points along the fibre is calculated and applied to the fibre diameter.
Further non-destructive investigation with a fibre pulled in the same conditions as batch 1 was also looked at. A fibre with a minimum diameter of  μm was stretched and relaxed a set distance 5 times, with the applied load and extension recorded. This gave an average Young's modulus value of
  GPa, in agreement with the average Young's modulus of batch 1.
It has been suggested that the surface layer of fused silica has a thickness of 1 μm [23, 24]. It is therefore possible that this indicates the mechanical structure of the surface layer, which accounts for a significant 21%–37% of the diameter at its thinnest point, has influence on the breaking stress and Young's modulus of the fibres. This is an area of ongoing interest and research is ongoing into surface layers of thin fibres.
5. Conclusion
A machine dedicated to the production of thin fused silica fibres was developed and characterised. This machine can produce fibres of a wide range of diameters, down below 10 μm if desired. Equipment to characterise the thin fibres, profiler and strength tester, were also developed and modified. The high magnification lens system on the profiler allows accurate profiling of the fibre diameter and the magnetic encoder installed on the strength tester allows accurate reading of the fibre extension under load. Thin fused silica fibres are being used in several experiments related to future gravitational wave detectors. Understanding the properties they hold is therefore extremely beneficial for future experiments. It was found that fibres with a minimum diameter below 10 μm had Young's modulus values ranging between  and
and  GPa. Fibres tested above a minimum diameter of 10 μm showed Young's modulus values that were closer to the bulk value. These ranged between
  to
to  GPa. Further research into surface layers of thin fibres is ongoing.
Acknowledgments
The authors would like to thank colleagues in the Institute for Gravitational Research for stimulating discussions and would also like to thank Colin Craig and Stephen Craig for their work in manufacturing components for the pulling machine and profiler. The authors would also like to thank the Science and Technology Facilities Council (grant ref: ST/N005422/1) and the European Research Council (ERC-2012-StG: 307245) for their financial support. The authors gratefully acknowledge the support of the United States National Science Foundation (NSF) for the construction and operation of Advanced LIGO and the LIGO laboratories. This paper has LIGO document number P1800040.