
Abstract
A high-power, nanosecond pulsed laser impacting the surface of a material can generate an ablation plasma that drives a shock wave into it; while in situ x-ray imaging can provide a time-resolved probe of the shock-induced material behaviour on macroscopic length scales. Here, we report on an investigation into laser-driven shock compression of a polyurethane foam and a graphite rod by means of single-pulse synchrotron x-ray phase-contrast imaging with MHz frame rate. A 6 J, 10 ns pulsed laser was used to generate shock compression. Physical processes governing the laser-induced dynamic response such as elastic compression, compaction, pore collapse, fracture, and fragmentation have been imaged; and the advantage of exploiting the partial spatial coherence of a synchrotron source for studying low-density, carbon-based materials is emphasized. The successful combination of a high-energy laser and ultra high-speed x-ray imaging using synchrotron light demonstrates the potentiality of accessing complementary information from scientific studies of laser-driven shock compression.
Export citation and abstract BibTeX RIS

Original content from this work may be used under the terms of the Creative Commons Attribution 3.0 licence. Any further distribution of this work must maintain attribution to the author(s) and the title of the work, journal citation and DOI.
1. Introduction
The properties of materials are driven to extreme conditions under high pressures, the highest of which is generated by shock compression. First described by George Gabriel Stokes in 1851 [1], 'a shock is a travelling wave front across which a discontinuous, adiabatic jump in state variables takes place'. Investigations of materials under shock compression cast light on a broad range of phenomena that are not fully understood in the areas of high-energy-density physics, earth and planetary sciences, aerospace engineering, and materials science. The three main progenitors of shock compression can be considered as: explosion, impact, and plasma [2]. Respectively, the most popular platforms for shock wave generation in the laboratory are: (1) high explosives detonation [2–4]; (2) plate impacts using gas guns [5, 6]; and (3) high-power, pulsed laser irradiation leading to surface ablation and plasma generation that drives a shock wave into the material [7, 8]. Some advantages of the third technique over the more conventional ways involving guns and explosives include its relatively low destructiveness, the potential to achieve ultra-high pressures (up to TPa-order) with a very intense laser pulse [9], and the ease of synchronizing measurement devices with nanoseconds accuracy [10].
Ideally, if the laser beam is spatially uniform and if the beam diameter of the irradiated surface is much larger than the sample thickness, the material is subjected to uniaxial strain in the direction of the applied shock [7, 11]. High-power lasers have been considered as calibrated shock-generators, therefore laser-induced shock compression has become an alternative tool to gas guns for characterizing the behaviour of solid materials under high-speed loading. The use of lasers has consequently opened up a field of research which brought complementary knowledge of fundamental laser-material interaction processes, material equations-of-states and phase diagrams, material behaviour under dynamic compression, and ruptures due to shock propagation. A myriad of technologies related to laser-induced shock wave propagation in solids have been developed. Mature industrial applications include laser shock processing of metals called laser peening [7, 11], and laser adhesion tests (LASAT) of coatings [12]. More recently, developing applications related to laser shock include debris shielding [13] and shock mitigation.
The physics of material behaviour embedded at the lattice level can be inferred using x-ray diffraction (XRD) and absorption spectroscopy (XAS) measurements, while key information on the bulk material behaviour requires knowledge at the macroscopic level, which can be deduced from x-ray imaging (XRI). In situ x-ray probes with high temporal resolution have been adapted as diagnostics for laser-shock experiments using flash x-ray sources [14], and laser-based x-ray backlighters [15]. Outside high-power laser facilities, synchrotron and free-electron laser (FEL) x-ray sources have been used. Single-pulse synchrotron XRD of laser-shocked cadmium sulfide (CdS) [16] and silicon [17] has been realized at the European Synchrotron Radiation Facility (ESRF) in France. At the Photon Factory Advanced Ring in Japan, laser-shocked CdS [18] as well as various materials [10], including zirconia ceramic, polycrystalline bismuth and silica glass have also been studied using XRD. Most recently, single-pulse synchrotron XAS has been used to study laser-shocked Fe [19]; and a visualization of laser-induced shock propagation in water using single-pulse synchrotron x-ray phase-contrast imaging (XPCI) [20] has also been demonstrated at the ESRF. With respect to FELs, which produce femtosecond x-ray pulses, XRD has been used to study laser-shocked copper [21] and silicon dioxide [22], while XPCI has been used to visualize shock wave propagation in diamond [23] at the Linac Coherent Light Source (LCLS) in the USA. XRD of laser-induced lattice dynamics in gold has also been performed at the SPring-8 Angstrom Compact Free Electron Laser in Japan [24]. The LCLS has built a dedicated end station for dynamic compression (matter at extremes) [25]. Formation of diamond in laser-compressed graphite [26] and hydrocarbons [27] have been recently reported. Similarly a high-energy-density physics instrument is under construction at the European XFEL in Germany [28].
Each x-ray source has specific characteristics, which are suitable to probe different material length and time scales. Five important x-ray source parameters may be considered for XPCI when applied to laser shock studies: temporal pulse width, brilliance, spatial coherence, energy spectrum, and repetition rate. Here we refer to XPCI by Fresnel diffraction or free-space propagation [29]. Although with limited sensitivity due to spatial incoherence and low spectral brightness of the source, laser-based x-ray backlighters are conveniently installed at high-power laser facilities where extreme high-pressure loadings can be achieved. High-brilliance, femtosecond pulsed x-rays generated by FELs can produce measurements with the highest temporal and spatial resolutions, but the maximum x-ray energy is currently limited to around 25 keV. Synchrotron light sources produce x-rays with higher spatial coherence and brilliance than laser-based x-ray backlighters, and x-ray energies higher than achieved at current FELs. The development of x-ray detection technologies using direct and indirect imaging approaches have enabled high frame rate and high temporal resolution synchrotron-based hard XRI in the recent years [5, 30, 31]. Synchrotron x-ray pulses have ≈100 ps full-width-at-half-maximum (FWHM); when combined with an imaging detector with 10 μm spatial resolution, this gives the possibility to freeze a motion up to a speed of 10 km s−1 (10 mm μs−1) [5, 32]. XPCI using synchrotron x-rays is becoming widely employed for impact-driven shock experiments using gas guns [5, 6, 33]. The Advanced Photon Source in the USA has, for several years, been performing time-resolved XRD and XPCI gas-gun experiments with emphasis on condensed matter and materials science activities [5]. At the ESRF and the Diamond Light Source in the UK, time-resolved XRI on gas-gun experiments have been performed to study asteroid impacts [6, 33]. XPCI has provided the measurements of mechanical wave speed and density changes, and the understanding of shock-induced macroscopic processes leading to deformations and failure.
Mega-hertz (MHz) pulse repetition rates are characteristic to synchrotron sources, allowing transient processes to be tracked using ultra high-speed image acquisition with multiple frames. The acquisition of real movies is preferred than quasi movies that are built-up from multiple, single-shot experiments, in which time delays of image acquisitions are shifted in order to capture the full temporal evolution of a dynamics of interest. In the latter approach, quasi movies are acquired using different samples assuming repeatability of sample structure and loading conditions, which could be both difficult to achieve. Moreover, multiple-frame recording is essential for the visualization of transient processes that are stochastic or aperiodic. At the ESRF, MHz x-ray pulse repetition rates using the 4-bunch (1.4 MHz) and 16-bunch (5.6 MHz) filling modes of the electron storage ring has been combined with fast indirect x-ray detection in order to achieve ultra high-speed XPCI with million frames per second (Mfps) recording and single-pulse (≈100 ps) temporal resolution [20, 32, 34].
In this work, we explored the MHz frame rate, single-pulse synchrotron XPCI of laser-driven shock compression. Here, we report a detailed scheme of synchronization for a 6 J, 10 ns pulsed laser and the 4-bunch filling mode at ESRF. A successful visualization of dynamic compression and deformation of a polyurethane foam and a graphite rod is presented, with emphasis on the advantage of exploiting the partial spatial coherence of a synchrotron source for studying low-density, carbon-based materials. The current limitations of MHz frame rate, single-pulse synchrotron XPCI when applied to laser shock studies are discussed, and an outlook on the future in the light of upcoming light sources utilizing diffraction-limited storage ring is given.
2. Instrumentation
A schematic overview of the experiments' main components is shown in figure 1. The experiments were performed at the microtomography beamline ID19 of the ESRF [35, 36], where the partial spatial coherence of the x-ray beam was enhanced by a 145 m propagation distance from the source to the sample position. The 4-bunch filling mode of the storage ring was used. The maximum ring current was 40 mA. The x-ray pulse temporal width, which gives the imaging temporal resolution, is equivalent to the electron bunch width of 75 ps FWHM. The time between x-ray flashes was 704 ns. In this section, we present the instrumentation that we applied to: (1) generate shock compression with a 6 J, 10 ns pulsed laser; (2) image the dynamic processes with single-pulse temporal resolution and MHz frame rate; and (3) synchronize the trigger of the laser pulse and the image acquisition with the x-ray pulse, using the radio frequency (RF) of the synchrotron storage ring as a master clock.

Figure 1. Schematic overview of the experimental set-up. The ESRF storage ring operated in 4-bunch filling mode, i.e. the source pulse repetition was approximately 1.42 MHz. The x-rays were generated by the means of two undulators. XPCI was performed 145 m from the source to achieve enhanced partial spatial coherence of the x-ray beam. Shock wave compression in the sample was generated using a 6 J, 10 ns pulsed laser. The laser pulse and the image acquisition were synchronized with the x-ray pulses using the RF of the storage ring as the master clock. XPCI images were recorded by a high spatial resolution, ultra high-speed indirect x-ray detector.
Download figure:
Standard image High-resolution image2.1. Laser shock wave generation
A commercial laser (TITAN 6 ultra compact, high-energy, flash lamp-pulsed Nd:YAG, Amplitude Technologies, France) was installed to drive a shock wave into the sample. The laser has a maximum pulse energy of 6 J at 532 nm and a pulse duration of 10 ns (FWHM). The laser flash lamp was operated at 5 Hz repetition rate. A single-shot, focused laser beam was delivered onto the sample by operating the laser Q-switch. The pulse energy was varied by changing the delay of the Q-switch trigger with respect to the flash lamp trigger. A photograph of the set-up combined with a ray diagram of the optical path of the laser can be found in figure 2. By using a variable attenuator based on a  wave plate and a polarizer, laser energies between 20 mJ and 5 J were reliably delivered onto the samples. A calibrated calorimeter was used to measure the laser energy on a shot-to-shot basis. The laser light was directed to the sample using a lens with a focal length of 200 mm resulting in a minimal focal spot diameter of 100 μm FWHM (in high-power density configuration). By changing the lens position, other spot sizes were realized up to a diameter of 3 mm. In order to have full control over the laser beam, the whole system was equipped with near-field and far-field beam diagnostics, and direct imaging of the focal spot at the sample position, which also allows the sample to be placed exactly at the laser beam focus.

Figure 2. Photograph of the actual set-up of laser beam delivery onto the sample inside the vacuum chamber. The laser beam (green ray) was guided using mirrors and beam splitters, and focused onto the sample position using a lens. The laser beam intersected the x-ray beam at a 90° angle at the sample position. The laser beam paths for calorimetry (blue ray), near-field (orange ray) and far-field (cyan ray) beam diagnostics, and direct imaging of the focal spot at the sample position (magenta ray) are shown.
Download figure:
Standard image High-resolution imageThe laser and the x-ray beam intersected at an angle of 90° at the rotation centre of the sample. The sample manipulation stage, which consisted of a motorized goniometer head (two horizontal translations in perpendicular axes; and rotations around each axis; type: Huber 1003-MS) was mounted on a rotation stage with vertical and horizontal translation stages (Huber Diffraktionstechnik GmbH, Germany). The horizontal stage was in parallel with the laser beam at the sample position. In order to avoid laser-induced breakdown of air, the experiments were carried out in a vacuum chamber maintaining a pressure below 5 mbar. Air breakdown would not only massively reduce the energy that reaches the sample but also change the focal spot. The vacuum chamber that was used has x-ray transparent 125 μm thick Kapton windows (200 mm diameter), and optical windows (50 mm diameter) made of high damage threshold fused silica substrates.
Two types of laser shock experiments were performed. In the first, referred to as confined interaction, the loading pressure was increased by confining the plasma expansion, as detailed in section 3.1. The diameter of the irradiated spot was a few millimetres to match the inhomogeneous nature of the sample. In the second, referred to as direct interaction, the laser was focused onto a much smaller spot.
2.2. X-ray phase-contrast imaging
The beamline's two U32 undulators operating with minimum gaps of 11.1 mm and 11.5 mm were used as a polychromatic x-ray source. To reduce the heat load arising from the x-ray absorption in the sample and in the scintillator screen, the low energy content of the beam was attenuated by a 1.4 mm thick diamond filter and a 0.7 mm thick aluminium filter. These settings guaranteed a maximum photon flux (approximately 1013 ph mm−2 s−1 or 107 ph mm−2 per pulse) at the sample with the lowest usable harmonics at 20 keV and a peak photon flux density of 30 keV [32]. Additionally, the total x-ray exposure time was limited to 0.2 s by operating a fast beam shutter during each recording. The x-ray beam size was several millimetres and adapted to the field of view of the x-ray detector. A large propagation distance of 7.2 m between the sample and the detector was used in order to maximize the x-ray phase-contrast enhancement in radiography [29]. The x-ray image detector used was an indirect system composed of a fast-decay scintillator (250 μm-thick Ce-doped (Lu(2−x)Yx)SiO5 (LYSO:Ce), Hilger Crystals, UK), which is lens-coupled to an ultra high-speed visible light camera (Hyper Vision HPV-X2, Shimadzu Corp., Japan) [20]. The camera has a frame-transfer complementary metal oxide semiconductor sensor with 400 × 256 (250 effective) pixels of 32 μm (30 μm × 21.3 μm active area). 128 images were stored on-chip in one recording sequence. Using a  magnification objective lens system (0.2 numerical aperture, Optique Peter, France), we obtained an effective field of view of 3.2 mm × 2.0 mm with an effective pixel size of 8.0 μm. The camera has no external clock synchronization capability; consequently, the nearest inter-frame time provided by the internal camera clock was 700 ns (1.4 Mfps acquisition rate). This resulted in a maximum usable frame rate but with several recorded frames being empty when the camera acquired between two x-ray flashes (due to frequency mismatch). In order to avoid the empty frames and achieve a full exploitation of the 128 images on-chip memory, an inter-frame of 1410 ns (0.71 Mfps acquisition rate) was used in the experiments. The camera exposure time was 600 ns.
2.3. Timing and synchronization
The timing and synchronization between the laser pulse, the x-ray pulses and the imaging detector are essential for imaging the laser-sample interaction. The synchronization concept allowed us to generate a laser pulse that was temporally coincident with the x-ray pulse at the sample position. Figure 3 shows the synchronization diagram and the corresponding timing scheme that was applied in this experiment.

Figure 3. (a) Diagram of the timing and synchronization devices and (b) timing scheme. The RF clock of the storage ring served as the master clock of the whole circuit. A Quad 4-input logic unit was used to realize the temporal coincidence between the laser and the x-ray pulses. Delay generators (DGs) were used to tune the time delays of the trigger signals to the (1) laser flash lamp, (2) laser Q-switch and (3) ultra high-speed camera. The color code of the coincidence logic is given as: black when the coincidence logic unit was waiting for the start signal, red when the start signal appeared, followed by the 'ready for laser shot' signal from DG(1); and green when the bunch clock signal appeared, which means that all the signals needed for coincidence logic are high or present. A coincidence logic output signal was then generated to trigger the laser Q-switch via DG(2) and the camera via DG(3).
Download figure:
Standard image High-resolution imageThe ESRF RF system (352.202 MHz ± 500 Hz) was used as a master clock signal. The bunch clock corresponding to the 4-bunch revolution frequency (1.420 168 MHz) was derived from the RF using a Bunch Clock Delay Unit (BCDU8, ESRF in-house developed). The bunch clock signal was used to feed a multi-purpose digital input/output (I/O) module (OPIOM, ESRF in-house developed) that can be controlled via the beamline computer. This I/O module was used to generate a 5 Hz TTL signal, which was synchronized with the bunch clock and triggered the continuous operation of the laser flash lamp. Approximately 340 μs after the flash lamp was triggered, maximum laser energy was achieved and the Q-switch (Pockels cell) was operated to generate a laser pulse. The laser pulse emission was made temporally synchronized with the x-ray pulse by using a coincidence signal output from a logic unit (CO-4020 4-Input Logic Unit, ORTEC, Netherlands) to trigger the laser Q-switch. The coincidence input signals were: bunch clock, laser flash lamp signal (delayed by 340 μs), and a software triggered start signal. The exact time delay needed to coincide the x-ray pulse and laser pulse was measured using a photodiode (G4176-03, Hamamatsu Photonics K.K., Japan), which was able to simultaneously register the laser radiation and the x-ray radiation. The signals were recorded using a high-voltage bias tee (Model 5531, Picosecond Pulse Labs, USA), and read by a 2.5 GHz signal oscilloscope (Waverunner 8254M-MS, Teledyne Lecroy, USA) via a singular cable. Figure 4 shows a plot of the oscilloscope data depicting the laser Q-switch trigger signal, and photodiode signals, which recorded the x-ray pulses and a single-shot laser pulse measured during the experiment.

Figure 4. Plot of the oscilloscope data depicting the laser Q-switch trigger signal (black curve), photodiode signals which recorded the laser pulse (blue curve) and x-ray pulses (green curve) as measured during the experiment. The laser pulse was observed 930 ns (cable delays and device insertion delays were all included) after the Q-switch trigger. In this given example the x-ray pulse (green curve) followed the laser pulse after 20 ns. This time delay value was tuned to zero for an exact x-ray and laser pulse coincidence by shifting the Q-switch trigger delay using DG(2).
Download figure:
Standard image High-resolution imageDelay generators (DG645, Stanford Research Systems, USA) were used to tune the timing delays for the flash lamp, Q-switch and camera. Shifting the flash lamp trigger delay with the first delay generator (DG(1)) allowed for the tuning of the time delay between the flash lamp and the Q-switch, which changed the laser energy output while keeping the laser-x-ray coincidence. The delay value for the camera trigger was chosen in such a way that the third image was taken at the time of laser-x-ray coincidence. The timing jitter in the experiments was ≈10 ns, which was limited by the 100 MHz internal clock frequency of the ultra high-speed camera.
3. Experiments and results
Here we present the experimental details and results of the observed dynamic processes relating to the propagation of laser-induced shock in a polyurethane foam and a graphite rod.
3.1. Polyurethane foam
An accurate control of shock attenuation has immense importance for various engineering and industrial applications such as automotive, aeronautic, aerospace industries or safety. Of the numerous methods that have been investigated to attenuate shock waves, porous structures featuring rigid or flexible granular filters [37] or foams [38, 39] made of solid materials or liquids demonstrated a great deal of promise [40–43]. However, detailed mechanisms of shock wave attenuation in these porous structures are not yet completely understood because of their extremely complex features. Shock wave interaction with complex media is now one of the most important research topics in shock dynamics [44]. This work using ultra high-speed XPCI to visualize foam deformation during shock loading and unloading aims at providing key information on the macroscopic behaviour including pore closure, elastic-plastic response of the matrix, cracks, and subsequent pressure decay with propagation distance.
Polymeric foams are widely available and possess properties well suited for use in shock wave experiments [45]. In this work, we used laser ablation to generate shock compression in expanded polyurethane foams (mass density = 320 g mm−3, speed of sound as solid material = 1800 m s−1) [46]. A 12 μm thick layer of aluminium was used as the ablator. It was deposited onto a 5 mm thick polyurethane cylinder-shaped foam and then covered by a 5 mm thick glass that is transparent to the laser wavelength. With this so-called confined interaction approach, the laser pulse penetrates the glass and induces ablation at the aluminium surface. An ablation plume confined between the sample and the cover layer induces a pressure that generates the shock onto the sample. Both amplitude and time of application of this shock are increased by the presence of the cover layer, but the laser intensity is confined in order to avoid the breakdown of this layer before reaching the sample surface. The corresponding threshold intensity for glass is about 10 GW cm−2. Here, a pulse of 4.0 J energy and 10 ns duration was focused onto a spot of 3 mm diameter, which leads to a laser intensity of 5.7 GW cm−2, below the laser breakdown threshold in glass. The laser beam path was parallel to the axis of the cylindrical specimen. The radiography images were collected with a frame rate of 710 kfps and recorded with a 600 ns exposure time.
A time series of XPCI images of a polyurethane foam subjected to a laser shock applied onto the right surface is shown in figure 5. As theoretically expected, two fronts can be seen to propagate from right to left: a slow compaction wave and a faster elastic compression wave. The compaction wave is seen to initially propagate at ≈250 m s−1 between t = 1.35 μs to t = 5.58 μs after the laser impact in figure 5(a). After the passage of the compaction wave, the foam returned to a decompressed state. The compaction wave continued to propagate with a slightly decreasing speed and with diminishing contrast until t = 18.27 μs in figure 5(a). This clearly demonstrates compaction wave attenuation in the foam. The plasma plume generated by the ablator caused the foam to progressively delaminate. At t = 12.63 μs the ablator delaminated entirely from the glass. The elastic wave propagation at t = 1.35 μs is demonstrated in figure 5(b), where the images were divided by the image of the pre-shocked foam at t = −0.06 μs. A propagation of a disturbance as far as 1.4 mm from the glass edge indicates an elastic wave propagation of ≈1 km s−1.

Figure 5. X-ray phase-contrast images of a polyurethane foam subjected to a laser shock applied on the right surface (the laser was directed through a glass plate onto an aluminium foil). The indicated times correspond to the time delay after the laser impact. Two fronts, attributed to a slow 'compaction wave' and a faster 'elastic compression wave' can be seen to propagate from right to left. Compaction wave propagation and attenuation in the foam are demonstrated between t = 1.35 μs and t = 18.27 μs in (a). The initial speed of the compaction wave propagation is ≈250 m s−1. Elastic wave propagation at t = 1.35 μs is demonstrated in (b), where the images were divided by the image of the pre-shocked foam image at t = −0.06 μs. The speed of the elastic wave propagation is ≈1 km s−1. See the online supplementary information (stacks.iop.org/JPhysD/51/055601/mmedia).
Download figure:
Standard image High-resolution image3.2. Graphite rod
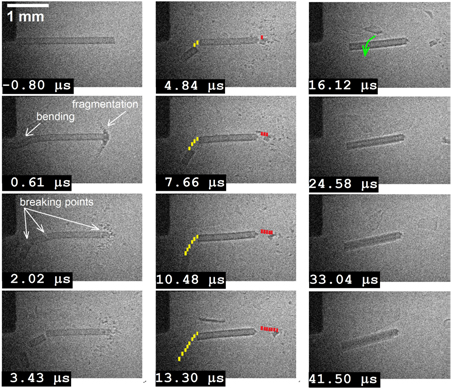
As a second experiment, the impact of the laser pulse on a graphite rod (125 μm × 125 μm × ≈2 mm) glued on an aluminium support was imaged. The laser was irradiated parallel to the rod axis, directly impacting the free face of the rod to generate shock compression. The laser energy was 4 J and the laser spot diameter was 100 μm (FWHM), giving a laser intensity of 5 TW cm−2.
The behaviour of graphite under shock loading is of high interest for science and technology. Dynamic shock compression experiments, e.g. with pulsed high-energy laser drives, are able to generate fast processes that are very comparable to the real conditions that take place, for example, during meteor impacts. The understanding of high pressure phase transition of carbon materials taking place during meteor impacts [26] can lead to applications such as fabrication of diamond via shock-driven graphite. For spacecraft technology, and safety applications, debris shielding against hyper-velocity impacts is also a major concern. Metals and some brittle materials have been subject of hyper-velocity impact studies. Due to their low density and high mechanical properties, composite materials are now being used widely in the aerospace industry. For instance, the behaviour of graphite under hyper-velocity [47] and laser-driven impact [13] has been studied.
In order to improve the predictive capabilities of hydrodynamic simulations for such materials, there has been a need for modelling of porous graphite with experimental verification. Figure 6 shows results from two-dimensional hydrodynamic simulations of the drive laser impact using MULTI2D [48] in combination with the SESAME7832 equation of state table for graphite. The hot ablating plasma drives a shock-compression wave into the sample, with a shock pressure of 60 GPa. This shock heats the compressed material to temperatures of 3000 K; the graphite is compressed by a factor of 1.6× and changes into the diamond phase on sub-nanosecond timescales [26]. In figure 6, the pressure front moves approximately 7.5 km s−1 (75 μm between time step 10 ns and 20 ns). This is consistent with the different data sets for a 60 GPa shock propagating in carbon (from graphite of various initial densities to vitreous carbon), which gave supersonic shock velocities between 7.8 and 8.2 km s−1 [49]. Shock compression is followed by gradual unloading, so that the pressure pulse becomes roughly triangular, and the peak pressure decays with increasing propagation distance. The propagation of the shock compression wave will be slower and slower until the sound speed in graphite (1.47 km s−1) may be reached. From that point it is no longer a shock wave, but just a normal longitudinal compression (sound) wave.

Figure 6. Two-dimensional radiation hydrodynamic simulations of the nanosecond drive laser irradiating the tip of a graphite rod. Density (left), temperature (middle), and pressure (right) are shown for the time 10 ns (top) and 20 ns (bottom) after laser irradiation. At 10 ns, the ablating plasma drives a shock-compression wave into the rod. At 20 ns, the drive laser is off and the compression wave decays as it propagates further along the rod axis.
Download figure:
Standard image High-resolution imageA time series of XPCI images of a graphite rod subjected to a laser shock applied onto the right surface is shown in figure 7. At t = 0.61 μs after the laser impact, the fixed end of the graphite rod, 2 mm from the impacted face, shows strong bending. This suggests that the compression wave has reached the rear side by that time; thus, the average velocity of the compression wave was well above the graphite sound speed. This is in good agreement with the initial propagation of a supersonic shock wave when the laser strike the rod. A probable cause for bending (transverse effect) was that the face of the rod was not perfectly perpendicular to the long axis of the rod. Such an angle at the rod tip can be seen in the first frame.
Figure 7. X-ray phase-contrast images of a graphite rod subjected to a laser shock applied on the right surface. The indicated times correspond to the time delay after the laser impact. Fragmentation and failure (breaking) in a brittle material graphite is demonstrated. The red and yellow dotted lines indicate the trajectory of the fragments at opposite ends of the rod. The green arrow indicate the spin of the large fragment in the middle. The time intervals of the image series in each column from left to right are 1.41 μs, 2.82 μs, and 8.46 μs, respectively. The sharp linear object that appeared at 13.30 μs was flying hard glue, which delaminated when the rod detached from the aluminium support. See the online supplementary information.
Download figure:
Standard image High-resolution image
At t = 0.61 μs after the laser impact, disintegration of the rod face can also be observed, and material streaks were ejected sideways (compare with figure 6). These developed an 'umbrella' shape with an angle of about 60° relative to the rod axis. The disintegrating rod face, which shows a granular structure, may result from diamond grains formed in the shock compression process [26]. With the pressure reached in this experiment, the initial shock compression wave would turn the front of the graphite rod into diamond at least for the duration of the drive laser. When the laser is turned off, these compressed diamond grains would undergo pressure release and the compressed rod surface disintegrates.
At t = 2.02 μs and 3.43 μs after the laser impact, fracture and breaking can be observed at various parts of the rod as a consequence of the interactions of incident and reflected waves, including transverse waves and the longitudinal unloading wave following the shock front. Fragments at the ends of the rod were projected at opposite directions (see t = 4.84 μs to t = 13.30 μs). In addition, a large fragment of the rod moved with spin while falling (see t = 4.84 μs to t = 13.30 μs). This spin was due to the strong bending, which created a tension that was not parallel with the direction of the applied shock.
Here, we note that the SESAME-based hydrodynamic simulation shown in figure 6 cannot model anything like solid grain structure and does not include fragmentation models. Application of such hydro simulations is reasonable for the ns-laser-matter interaction and the formation of the shock wave. For any times later than 20 ns, the connection of the simulation to reality will become worse as it does not include the necessary physics. This would require a much more sophisticated, multi-scale approach; and experiments like ours will be very helpful for benchmarking such new efforts in the future.
4. Discussion
As illustrated in our case studies, XPCI has revealed high-contrast images of laser-induced shock compression of polyurethane foam. Due to the very light mass density of the foam, the x-ray transmission through the 5 mm thick sample was ≈90%. One can therefore neglect attenuation and attribute the intensity distribution generated by the foam to propagation-based x-ray phase contrast. Explicitly, the bright (or dark) areas in the images do not correspond to high (or low) transmission, but constitute a speckle pattern attributed to the pores in the polyurethane foam. X-ray tomography revealed that the pore sizes are in the range of 100–200 μm. We attribute the reduction in contrast manifested as a dark band in the image to pores collapsing to much smaller than their initial size. This hypothesis agrees with the expected pore collapse during compaction as predicted by shock dynamics. Density change is also expected during compaction, but needs to be decoupled from pore collapse and needs further investigation. This result emphasizes the advantage of using an x-ray source with partial spatial coherence like the synchrotron for studying low-density materials such as polymeric foam, which may not give enough contrast when imaged using a source with low spatial coherence like laser-based x-ray backlighters.
This work also highlighted another advantage of using synchrotron x-rays for dynamic imaging: the exploitation of the MHz repetition rate of the x-ray pulses to produce MHz frame rate imaging capable of following the dynamics related to laser-induced shock compression in a continuous manner with multiple-frame recording. The observation of elastic wavefront propagation in the foam (see figure 5(b)), and motion tracking of the fragments' trajectory in laser-shocked graphite (see figure 7) would not have been observed without multiple-frame recording. However, it should be noted here that MHz frame rate XRI using synchrotron radiation is currently limited to capturing low speed wave propagation. Unlike most shock events which happen within 100 ns, the propagation of mechanical waves in polymeric foam is slow, making synchrotron MHz imaging applicable for multiple-frame recording. In the case of the laser-induced shock compression of graphite, where the shock wave travels at ≈8 km s−1, the limitation of the method is apparent. In order to record the dynamic processes occurring within 100 ns, a stroboscopic imaging approach is needed, by repeating the experiment and shifting the time delay between the laser impact and the x-ray image acquisition. Nonetheless, it is noteworthy that the observation of fragmentation of graphite is a promising result.
XRI experiments to investigate shock phenomena with MHz acquisition rates are reaching the limit of performance of current synchrotron light sources in terms of brilliance. Currently at the ESRF, the maximum achievable frame rate for single-pulse synchrotron imaging is 5.6 Mfps (1/176 ns), which utilizes every x-ray pulse generated in 16-bunch filling mode. Diffraction-limited, storage ring-based light sources with advanced multi-bend achromat lattices, currently under construction world-wide, will lift this limitation. The ESRF will be upgraded in 2019 and the Extremely Brilliant Source (EBS) will be operational for users in 2020. It promises a 100-fold increase in photon flux density.
The storage ring renewal will be accompanied by beamline refurbishment program that includes construction of new beamlines. A planned in-vacuum insertion device for ID19 beamline will additionally provide an order of magnitude increase in photon flux density, which will allow for a dramatic improvement of the signal-to-noise ratio. According to our estimations, the ultimate imaging frame rate for the ESRF of 352.2 Mfps (equivalent to the RF of the ring) is potentially achievable. Moreover, with the increase in photon flux density comes the opportunity to improve the spatial resolution of the imaging system by employing higher magnification optics to achieve micrometre resolution. The decreased field of view may be solved by employing a large scintillator with visible light optics simultaneously diverting the light to multiple paths and detector. The increase of the fraction of coherent photons at higher photon energies towards 50 keV will also open the possibility to probe denser materials, such as intermetallic composites which are of use in the automotive and aerospace industries.
One of the proposed EBS beamlines is designed for time-resolved XRD, x-ray emission and XRI studies of dynamically compressed matter. Presented in the conceptual design report 6 (CDR6), this beamline will address a variety of scientific applications in material physics and synthesis, earth and planetary science, high-energy-density and warm dense matter physics and chemistry at extreme pressure and temperature, and applied engineering materials [50]. CDR6 will share the 100–200 J, nanosecond pulsed laser of the High-Power Laser Facility presently under construction close to the XAS beamline ID24. Additionally, it is planned to equip the beamline with a two-stage, helium gas gun and a chamber for the use of explosives. The realization of CDR6 will provide a unique facility worldwide for studies of dynamically compressed matter by a combination of synchrotron x-ray techniques, amongst which XPCI will play a dominant role. The present work is therefore expected to pave the way for a future establishment of XRI methods as a routine diagnostic tool for laser-induced shock compression studies.
5. Summary
We have applied a MHz frame rate XPCI using synchrotron x-ray pulses to study the laser-induced shock compression in polyurethane foam and graphite. As theoretically expected, two fronts attributed to a slow compaction wave at ≈250 m s−1 and a faster elastic compression wave at ≈1 km s−1 were observed on the shock compressed polyurethane foam. Evidences of pore collapse and attenuation of compaction wave were demonstrated. As for the graphite rod, we confirmed a propagation of a pressure front at supersonic velocity as predicted in the simulation. Fragmentation has also been observed. Our results emphasize the advantage of exploiting the partial spatial coherence of a synchrotron source for studying low-density, carbon-based materials, which may not give enough contrast when imaged using laser-based x-ray backlighters. Although limited to the observation of low-speed wave propagation, around a km s−1 in polymeric foams, we have shown the advantage of exploiting the MHz repetition of synchrotron x-rays for multiple-frame recording of a single-shot laser experiment. Finally, we present the prospectives on the future of MHz frame rate XPCI using synchrotron radiation applied to laser-induced shock studies in the light of upcoming diffraction-limited storage ring light sources.
Acknowledgments
We thank Dr Wolfgang Seidel and Mario Gude (both HZDR) for the support during the preparation of the experiment; Elodie Boller, Jean-Paul Valade, Gilles Berruyer, Jose Maria Clement and Emmanuel Papillon (ESRF) for their technical support at ID19; Camille Berruyer (ESRF) and Emilio Escauriza (Oxford University) for their help in the drawings and proofreading the manuscript. The French National Research Agency (ANR) is acknowledged for support via EQUIPEX grant ANR-11-EQPX-0031 (project NanoimagesX).