

Abstract
Optical Tamm state (OTS) aided room-temperature amplified spontaneous emission (ASE) from carbon quantum dots (CQDs) embedded all-dielectric one-dimensional photonic crystals (1DPhCs) is presented. 1DPhCs, constituting twelve pairs of alternating quarter wave thick SiO2 and TiO2 thin films are fabricated by sol-gel synthesis route. The 1DPhCs are covered with ~50 nm thick silver thin film to obtain the Tamm structures. CQDs are prepared using organic precursors (onion pulp) and incorporated in the TiO2 matrix of the final four pairs of the 1DPhCs. OTSs are observed in the reflection spectra at a detection angle of ~15°, at ~648 nm and ~618 nm, for the samples with and without CQDs respectively. Comparisons of enhancement of photoluminescence from samples with and without CQDs are presented. ASE at ~648 nm corresponding to the OTS of the CQDs incorporated Tamm structure, and suppression of emission within the photonic stop-band is demonstrated.
Export citation and abstract BibTeX RIS
1. Introduction
Studies on surface electromagnetic waves (SEWs) in one-dimensional photonic crystals (1DPhCs), analogous to surface plasmon polariton propagating along the metal-dielectric interface, showed that the SEWs exist below the vacuum light line in the dispersion diagram [1, 2]. This implies that the SEWs can be excited only in the prism or grating coupling configuration. In 2003, Gasper-Armenta and Villa showed the existence of electromagnetic modes at the interface between a 1DPhC and a metallic film within the light cone [3] that can be excited by direct illumination from the vacuum. These modes can be present at any frequency below the plasma frequency of the metal. These states are called optical Tamm states (OTSs) or Tamm plasmon polaritons (TPPs) [4, 5] from their analogy to electronic Tamm states localized at the crystal surface [6]. The electromagnetic field associated with OTS remains confined near the metal 1DPhC interface [4, 7] and the enhancement of the local electromagnetic field leads to amplified spontaneous emission (ASE) [8] from active materials embedded in the terminal layers of the photonic crystal (PhC). PhC devices based on TPP modes are being widely studied as an efficient medium for enhancing light–matter interactions [9, 10], to fabricate vertical cavity lasers by patterning the metal layer to tailor the TPP mode [11] and to enhance second-harmonic generation intensity [12].
On the other hand, the newest member of the carbon family, carbon quantum dots (CQDs), have drawn immense research interest due to their extraordinary luminescence properties with high tunability, large quantum yield and excellent photostability, small size and biocompatibility [13]. The photoluminescence (PL) spectrum of CQDs commonly exhibits a broadband nature as compared to the other inorganic semiconductor quantum dots or nanocrystals [14, 15], but the exact physical origin of such emission are still unrevealed and the precise control of the emission wavelength is challenging. The broad spontaneous emission from CQDs can be amplified and controlled when incorporated in a 1DPhC covered with a metal film, by tuning the OTS coupled with the emitter at the metal-1DPhC interface. In this context, the effects of external field and quantum confinement on the spontaneous emission of spherical quantum dots embedded in a photonic crystal have been reported [16]. Also, wideband absorption of 1DPhC structures composed of lossy dielectric layer and graphene-based hyperbolic metamaterials has been investigated [17, 18].
In this study, we experimentally demonstrate room-temperature ASE from CQDs embedded TiO2 thin film due to the presence of OTS at the interface between a Bragg mirror, constituted of twelve pairs of SiO2/TiO2 bi-layers, and a silver thin film. The CQDs are embedded in the TiO2 matrix of the final four bi-layers of the 1DPhC. The fabricated structure shows promising properties for the development of a room-temperature on-chip photonic source.
2. Experimental section
Fabrication of 1DPhC: The 1DPhC is obtained by depositing twelve pairs of quarter-wave thick alternating layers of silica (SiO2) and titanium dioxide (TiO2) on an optically polished silicon substrate using sol gel synthesis route and dip-coating technique. The preparations of SiO2 and TiO2 sols are described elsewhere [19, 20]. The thin films were then alternatively dip-coated on silicon substrate at a dipping rate of 1000 μm s−1. Each layer was annealed in air, at 900 °C for 1 min, prior to the next coating.
Preparation of CQDs: The CQDs are prepared using organic precursors due to its ease of fabrication, low-cost and non-toxicity. Typically, an absolutely clean carbon containing precursor (onion pulp) mixed with de-ionised water produces highly luminescent CQDs via hydrothermal treatment (~160 °C and 120 min). At higher temperatures and pressures, the dehydration and decomposition of long carbon chain takes place, resulting in aromatization and formation of aromatic clusters. The resultant dark blackish solution was filtered and washed several times to remove any residual unreacted organic molecules. The solution was centrifuged to obtain smaller sized CQDs and used for further processing.
Tamm structure: The solution of CQDs thus obtained was mixed with the TiO2 sol in 1:10 ratio which was used for depositing the TiO2 layers of the final four bi-layers of the 1DPhC. The resultant 1DPhC was covered by a silver thin film by vapor deposition at a pressure of 2 × 10⁻⁶ mbar.
The cross-section image of the Tamm structure was obtained by employing the sample in the field emission scanning electron microscopy (FESEM), a LYRA3 TESCAN system working at 5.0 kV.
The transmission electron microscopy (TEM) image of CQDs was obtained using FEI-Tecnai G2 20S-Twin Analytical TEM. The CQDs were dispersed on the TEM grid and dried overnight at room temperature prior to the measurement.
The atomic force microscopy (AFM) image of the as-synthesized CQDs was obtained using scanning probe microscope (Agilent Technologies, Inc. 5500 AFM). The CQDs were spin coated on Si substrate at 2000 r.p.m. and dried overnight at room temperature prior to the measurement.
Raman spectroscopy was carried out to study the compositions and local structural disorder of the CQD incorporated TiO2 thin film dip-coated on a si substrate and annealed at 900 °C. The sample was excited using 514 nm line of an argon (Ar+) laser focused onto the sample through a 100× microscope (Olympus) objective with numerical aperture (NA) of 0.9. The Raman shift was recorded with a LabRam HR spectrometer (Jobin Yvon T64000) equipped with a Peltier-cooled charge-coupled device (CCD) detector.
The normal-incidence UV–visible reflection spectrum was recorded by fiber coupled CCD based spectrometer Avaspec-3648 UV–vis, to observe the position of the stop-band and the optical Tamm state.
The room-temperature PL spectra were recorded by exciting the samples with a 325 nm line of a CW Kimmon He–Cd laser (model no. IK3452R-F). The PL emission from the structures were dispersed by a Triax 320 monochromator and detected using a Hamamatsu R928 photomultiplier tube. The excitation intensity for PL was 1225 mW cm−2 for all the samples.
3. Results and discussions
The TEM cross-section image of the 1DPhC sample is shown in figure 1. The bright and dark regions correspond to TiO2 and SiO2 layers, respectively. The average thicknesses of TiO2 (56 ± 4 nm), SiO2 (105 ± 4 nm) and silver (50 ± 4 nm) thin films were measured from the cross-section image.
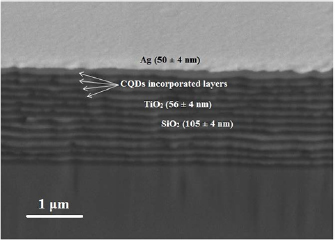
Figure 1. FESEM cross section image of silver deposited 1DPhC. The bright and dark regions correspond to TiO2 and SiO2 layers, respectively. The TiO2 layers of the final four bi-layers are embedded with CQDs.
Download figure:
Standard image High-resolution imageThe TEM image of CQDs representing the formation of spherical quantum-dots is shown in figure 2(a). The average lateral size of CQDs observed is ~1.7 ± 0.2 nm. Figure 2(a) exhibits that the mono-dispersed CQDs are well distributed over large area and seem to be sphero-symmetric in nature. The histogram in the inset of figure 2(a) of the corresponding TEM image exhibits the ensemble distribution of CQDs in the range of 1.1 nm to 3.5 nm, with a peak size at 1.7 nm.

Figure 2. (a) TEM micrograph of as-synthesized CQDs in solution. Inset shows histogram of lateral size distribution of 100 randomly selected CQDs from the TEM image. The average size of CQDs observed is ~1.7 ± 0.2 nm. (b) AFM image of CQDs coated on Si substrate. The height of the CQDs are ranging from 1.0–3.5 nm.
Download figure:
Standard image High-resolution imageA typical AFM image of the as-synthesized CQDs is presented in figure 2(b). The height of the CQDs are ranging from 1.0–3.5 nm and are in agreement with lateral size distribution obtained from TEM image confirming the nearly spherical nature of CQDs. The lateral size distribution observed in figure 2(b) is larger compared to the size observed in the TEM image due to the ensemble of CQDs formed during the dispersion of CQDs by spin coating on the substrate for AFM studies. The ensembles were formed due to the surface tension effect during evaporation. Also, AFM measurement was performed using a scanner tip having a larger width in comparison to the CQD size.
Raman spectra of the CQD incorporated TiO2 thin film is shown in figure 3. Figure 3 exhibits the presence of vibrational modes for both TiO2 and CQDs. The peak observed at ~131.2 (Eg), 385.9 (B1g), 512.6 (A1g) and 628.2 (Eg) cm−1 are attributed to the anatase phase of TiO2 thin film [21]. Raman spectrum for as synthesized CQDs spin coated on a Si substrate is also shown in figure 3 and it is shifted vertically for clarity. It shows two distinct Raman modes at 1349 and 1597 cm−1 for the as-synthesized CQD sample denoted as 'D' and 'G' band of carbon, respectively. However, in TiO2 matrix, the Raman modes for carbon are found at ~1330 and ~1595 cm−1, respectively. The disordered 'D' band arises due to the breathing mode of clustered hexagonal aromatic rings, which are not active in the single crystalline graphite symmetric sites but the existence of defects in CQDs allows this mode to be Raman active. Whereas, the 'crystalline' G-band is attributed to the primary in-plane vibrational mode caused by LO (longitudinal optical) E2g phonons at Γ-point. The intensity ratio of ID/IG is found to be 0.92, which is close to 1 and indicates the formation of carbon or graphene nanostructure i.e. carbon quantum dots in our case [22].

Figure 3. Raman spectrum of CQD incorporated TiO2 thin film. The Eg, B1g, A1g, Eg peaks are characteristics of the TiO2 anatase phase and the D-band and G-band are attributed to the CQDs. The D-band to G-band intensity ratio (ID/IG) for CQDs is 0.92. Raman spectrum for as synthesized CQDs is also shown. For clarity the spectrum is vertically shifted.
Download figure:
Standard image High-resolution imageThe OTS modes are observed within the photonic stop-band (PSB) at frequencies below the plasma frequency of the metal and its position depends on the choice of the constituent materials for the 1DPhC, the thickness of the layers of the period, and the truncation of outermost layers. Figure 4(a) compares the UV–visible reflection spectrum of the bare 1DPhC (without silver cover) with the reflection spectrum of the 1DPhC after deposition of ~50 nm thick silver thin film on it. Hereafter, the silver deposited sample would be referred to as Tamm structure. We observe a ~224 nm broad photonic stop-band with peak reflectivity greater than 96% for the 1DPhC structure. For the Tamm structure, the OTS appears within the PSB at ~659 nm (marked by an upward arrow) with a quality factor of ~101. The reflectivity towards the higher frequency band-edge of the PSB is reduced primarily due to the absorption from the metallic layer. Figure 4(b) presents the simulated reflectance spectra calculated by transfer matrix method for the fabricated 1DPhC and the Tamm structure. For the simulation, the average layer thicknesses obtained from FESEM images and respective refractive indices ( = 1.45,
  = 2.45) of the constituent layers were used. The experimental results in figure 4(a) show good agreement with the theoretical data. In figure 4(c), the electric field intensity distribution corresponding to the OTS overlaid on the refractive index profile along the depth of the Tamm structure is shown. It can be observed that the intensity is confined and enhanced at the metal-1DPhC interface and it decays within the 1DPhC.

Figure 4. Normal-incidence UV–visible reflectance spectra for the 1DPhC and the Tamm structure, (a) experimental and (b) simulated. A 224 nm wide stop band is observed for the 1DPhC before deposition of the silver film. The Tamm resonance is observed at 659 nm and marked by a upward arrow in (a). (c) Simulated electric field intensity profile along the depth of the sample for the OTS. The black solid line shows the refractive index profile along the depth of the sample.
Download figure:
Standard image High-resolution imageFigures 5(a) and (b) show the PL spectra obtained from CQDs embedded 1DPhC and Tamm structure, respectively. PL emission obtained from one pair of SiO2/TiO2 thin films with CQDs incorporated in TiO2 matrix is also presented in the figures as a reference. The PL from the CQDs incorporated reference layer shows a broad emission covering the visible region from ~400 to 850 nm. The PL from the CQDs embedded 1DPhC and Tamm structure was performed at a detection angle of ~15° measured with respect to the surface normal. The measurement of reflectance spectrum at the detection angle of 15° was not possible because of instrumental limitations. The reflectance spectra of the samples were simulated at the detection angle of ~15° with the help of transfer matrix method incorporating the layer thicknesses obtaind from the FESEM image and are shown in figures 5(a) and (b). Figure 5(a) illustrates that the emission from the CQDs incorporated 1DPhC is suppressed within the PSB and it is enhanced at the band-edges where the reflectivity exhibits minima. The suppression of emission is attributed to the inhibition of local density of states (LDOS) within the photonic stop band and the enhanced band-edge emission is a result of increased LDOS at the band-edges. In the case of the Tamm structure in figure 5(b) the enhanced sharp emission peak at ~649 nm corresponds to the OTS (at detection angle of ~15°), where the photon density of states is extremely enhanced. In agreement with the reflectance spectrum, the emission at other regions of the spectrum is largely suppressed. The mismatch, in the band edge modes of figure 5(a) and Tamm resonance positions of figure 5(b) with the corresponding PL emission peaks, of about 7 nm can be attributed to the experimental limitations in the fabrication method, and the thickness and angle measurements in FESEM and PL studies, respectively. Another peak at 680 nm is observed in figure 5(b) corresponding to the reflection dip at ~680 nm. The field distribution corresponding to this mode does not show confinement at the metal-1DPhC interface, and hence is not the Tamm state.

Figure 5. Photoluminescence spectra from 1DPhC-CQD (a) without silver (I1DPhC + CQD), (b) with silver layer (I-Tamm). The black lines show the corresponding normal incidence reflectance spectra ( ). The dashed blue lines show the corresponding simulated reflectance spectra at 15° (RSim 15°). PL emission from a SiO2/TiO2-CQD pair is also shown as reference (I1pair + CQD). PL intensities are highly enhanced at the reflectance minima observed at the band edges (a) and at the Tamm resonance (b).
Download figure:
Standard image High-resolution imageUnder UV-blue excitation SiO2 and TiO2 thin films are known to exhibit defect state emissions in the visible region [23]. The broad PL band for the anatase phase mixture of TiO2 is ascribed to oxygen-related defects in TiO6 octahedra [24]. In order to confirm the role of CQD emission over the defect state emissions of SiO2 and TiO2 thin films in the observed enhanced OTS emissions, further studies were carried out. In this context, four samples, viz. 1DPhCs without CQDs, a similar 1DPhCs with CQDs in the TiO2 layers of the final four bi-layers, one pair of SiO2/TiO2 thin film (i.e. one bi-layer) without CQDs in the TiO2 matrix, and one bi-layer with CQDs in the TiO2 matrix were studied. Figure 6(a) shows the comparison of PL emission from 1DPhCs with and without CQDs incorporated in them. As a reference, PL spectra from one bi-layer with CQDs and one bi-layer without CQDs are also plotted. Since both SiO2 and TiO2 thin films exhibit PL under UV excitation, samples without CQDs in the TiO2 matrix also show PL emission in the visible region, though weak compared to CQDs incorporated samples as seen in figure 6(a). With the help of PL spectroscopy, it is difficult to distinguish the emissions arising from CQDs, TiO2-CQD matrix and from the defect states in TiO2 and SiO2 thin films. However, the advantage of embedding CQDs in TiO2 matrix of the 1DPhC is evident when the intensities of emission are compared. The emission of the one pair of SiO2/TiO2 with CQDs is enhanced approximately six times in comparison to that from one pair of SiO2/TiO2 layers in the absence of CQDs. It can also be seen that at the high frequency band-edge mode of the 1DPhC, the CQDs incorporated sample shows larger enhancement compared to the sample without CQDs in it, clearly indicating the advantage of CQD incorporated 1DPhCs. In figure 6(b), the PL emission corresponding to the Tamm states of the silver deposited samples with and without CQDs are shown. The position of the Tamm state is very sensitive to the constituent layer thicknesses, silver film thickness and the detection angle. For the Tamm structure without CQDs, the Tamm state is observed at ~618 nm (at a detection angle of ~15°) as shown in the reflection spectra corresponding to the 1DPhC overlaid on to the PL emisision, whereas, for the sample with CQDs the Tamm state was observed at ~648 nm (at a detection angle of ~15°). This discrepancy could be due to variation in thicknesses of various layers of the two independently fabricated samples. Furthermore, it is to be noted that the Tamm state for the sample without CQDs lies at the peak emission of the reference sample, whereas the Tamm state for the sample with CQDs lies at a red-shifted position with respect to the peak emission of the reference sample as seen in figure 6(b). It is evident that the PL emission intensity is strongly enhanced at the Tamm state for the structure incorporating CQDs in the TiO2 matrix. The PL enhancement factors obtained from figures 6(a) and (b) are shown in tables 1 and 2 for the 1DPhCs and the Tamm structures, respectively. The enhancement factors are calculated by evaluating the ratio of the PL intensities for the structured samples to the reference sample (one pair of SiO2/TiO2 without CQDs) at the corresponding wavelengths at pump intensity of 1225.5 mW cm−2, to compare the effect of the band-edge modes in the 1DPhCs and Tamm modes in the Tamm structures in presence of CQDs with respect to the sample without CQDs. Throughout, the reference has been chosen as one pair of SiO2/TiO2 sample without CQDs in order to obtain a cumulative enhancement factor resulting due to the structuring of the sample and incorporation of CQDs. It is evident from the tables that the PL emission is highly enhanced in the CQD incorporated samples. In table 1 for the 1DPhC samples, the lower wavelength band edge mode is enahanced up to 47 times in CQD embedded structure in comparison to the structure without CQD wherein the enhancement is about 18 times. The large enahancement is attributed to the gain provided by CQD and the increased LDOS at the photonic band edges. However, the enhancement factors at the higher wavelength band edge mode is similar in both the samples, though the availability of gain is higher for the CQDs embedded sample, which could be associated to scattering losses in the CQD embedded structures due to possible agglomeration of particles. The overall enhancement of emission in 1DPhC structures depends on the availability of gain, LDOS, quality factor of resonance, material absorption losses and scattering losses. In table 2 the PL enhancement in the CQDs embedded Tamm strucutre is shown to be 77, in comparison to 24 obtained in the Tamm strucutre without CQDs, despite the possibility of having higher scattering losses in CQD embedded Tamm structure, justifying the higher gain available in the CQD embedded Tamm structure.
Table 1. Comparison of PL enhancements at band-edge modes of 1DPhCs with and without CQDs in the TiO2 matrix.
| Sample | Position of reflection dip at band edges (at normal incidence) | PL emission at band edges (at ~15°) | ||||||
|---|---|---|---|---|---|---|---|---|
| Lower wavelength (nm) | Higher wavelength (nm) | Lower wavelength | Higher wavelength | |||||
| PL peak position (nm) | PL enhancement | FWHM (nm) | PL peak position (nm) | PL enhancement | FWHM (nm) | |||
| 1DPhC without CQD | 510 | 669 | 473 | 18 | ~9.5 | 653 | 21 | ~16 |
| 1DPhC with CQD | 520 | 688 | 479 | 47 | ~14 | 654 | 20 | ~12 |
Table 2. Comparison of PL enhancements at Tamm resonances of Tamm structures with and without CQDs in the TiO2 matrix.
| Sample | Position of reflectance dip at Tamm resonance | Position of Tamm resonance in PL spectrum (detection angle ~15°) | FWHM of PL emission peak at ~15° | PL enhancement at Tamm resonance (at ~15°) | |
|---|---|---|---|---|---|
| At normal incidence | at ~15° (simulated) | ||||
| Tamm structure without CQD | 629 nm | 619 nm | 618 nm | ~11.8 nm | 24 |
| Tamm structure with CQD | 659 nm | 653 nm | 649 nm | ~9.5 nm | 77 |
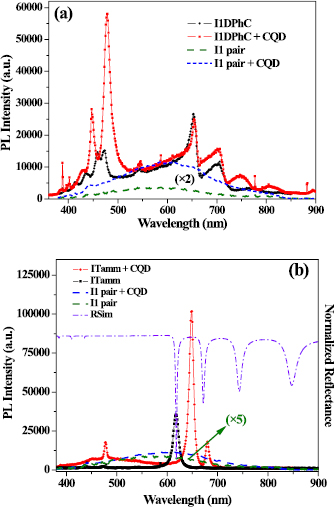
Figure 6. Comparison of PL intensities of 1DPhCs and Tamm structures with and without CQD. (a) PL from 1DPhC before depositing silver thin film (I1DPhC). (b) PL from Tamm structures obtained after deposition of silver thin film (ITamm). The dashed plots in both (a) and (b) correspond to PL from the reference samples, one bi-layer with CQDs in the TiO2 matrix (I1pair + CQD) and one bi-layer without CQDs in the TiO2 matrix respectively (I1pair). In (b) reflectance spectrum (dash dotted line) corresponding to the Tamm structure without CQD is also shown (RSim).
Download figure:
Standard image High-resolution imageThe power dependent PL spectra for the CQDs incorporated Tamm structure are presented in figure 7(a). The PL peak emission corresponding to the Tamm resonance at 649 nm is observed to be enhanced and the FWHM is observed to be decreased from 13.2 nm to 9.5 nm with the increase in pump intensity. Figures 7(b) and (c) show the pump intensity dependence of the peak intensities of PL emission corresponding to the TPP modes of the Tamm structures with and without CQDs in the TiO2 matrix respectively. In figure 7(b), ASE like behavior is observed at ~649 nm for the CQDs incorporated sample. In figure 7(b), a change in slope from 23 to 83 is observed for the two linear fits which confirms ASE from the CQDs incorporated Tamm structure. The ASE threshold is obtained to be 40 mW cm−2. Whereas, in figure 7(c), for the Tamm structure without CQDs, we observe that the peak PL intensity recorded at ~618 nm (at a detection angle of ~15°) changes linearly with pump intensity throughout the experimental data range. The slope of the linear fit in figure 7(c) is found to be 29.2. The PL peak intensity ratio at the Tamm resonance for the structures with and without CQDs (I649/I618) is observed to be 1.2 and 2.9 at threshold and beyond threshold (pump intensity = 1225.5 mW cm−2), respectively. In the inset of figure 7(c), the change in slope of the peak emission intensities for both the Tamm structures are shown in double—logarithm scale, which confirms the ASE like behaviour in case of CQD incorporated Tamm structure. However, for the Tamm structure without CQDs, the change in slope is not evident.

Figure 7. (a) Pump power dependent PL spectra for the CQDs incorporated Tamm structure are shown. Pump intensity dependent peak PL intensities of the OTS corresponding to Tamm structure with CQDs (b) and without CQDs (c) in the TiO2 matrix are shown. In (b) a change in the slope observed for the fitted curve is attributed to the amplified spontaneous emission. Inset shows the double-logarithm plot for both the Tamm structures with and without CQD.
Download figure:
Standard image High-resolution image
4. Conclusion
In summary, we have demonstrated amplified spontaneous emission from CQDs embedded optical Tamm structures owing to the confinement of electric field at the metal—1DPhC interface at room temperature. The Tamm structures were fabricated by depositing silver thin film on 1DPhCs, constituting of alternating SiO2 and TiO2 thin films. Field confinement at the metal-1DPhC interface, and hence enhancement corresponding to the OTS is supported by transfer matrix method simulation. Detailed comparison of the PL enhancements of the samples incorporated with and without CQDs suggests that CQDs embedded Tamm structure can be an excellent candidate for room-temperature on-chip photonic source. Finally, the concept of OTS aided ASE in the visible region from CQD incorporated Tamm structure can be replicated at other frequencies, provided we embed emitters with their emission at the desired OTS frequency, and we choose the metal such that its plasma frequency lies above the OTS frequency.
Acknowledgments
This work was supported, in part, by IIT Kharagpur sponsored project 'UPM' and 'ARS'. CMPDI is also acknowledged for the financial support.