

Abstract
Room temperature optical absorption spectroscopy (OAS) and Raman spectroscopy measurements have been carried out in order to understand the effect of structural disorder on the electronic and phononic states. For this purpose, polycrystalline samples of Cr doped PrFeO3 have been prepared via wet chemical route. OAS analysis suggests the systematic scaling of electronic disorder with Cr doping; whereas, shifting in Raman line shapes and an increase in Raman line width has been observed with Cr doping. X-ray diffraction analysis clearly suggests the increase in structural disorders in the form of crystallographic strain with Cr doping, which is consistent with the broadening in Raman line shapes. The major contribution to Raman line width has been understood in terms of temperature independent terms i.e. structural disorder induced by doping. The generation of a new phonon mode at ~510 cm−1 has been observed and understood as a disorder phonon mode due to strain induced structural disorder. Moreover, a systematic correlation between crystallographic strain, Raman line width, disordered parameter (σ) and Urbach energy has been observed, which implies that structural disorder affects phononic as well as electronic states of the system. Such comparative study allows us to find the correlation between densities of tail states, structural disorders and anharmonic effects probed by Raman spectroscopy.
Export citation and abstract BibTeX RIS
1. Introduction
The exponential variation of optical absorption near band edge (Urbach tail states/ Urbach energy) is one of the well-known feature of optical absorption spectra and the same has been observed in the optical spectra for almost all kinds of crystalline semiconductor materials, amorphous semiconductors and highly disordered non-metallic glassy systems [1–5]. Generally, it is believed that Urbach energy (EU) is a measure of total electronic disorder present in the system and the same scales with temperature and structural disorders (structural disorder induced by defects, vacancies, static strain fields, doping) etc [5–7]. Earlier, various efforts have been made by many research groups in order to explain the behaviour of EU, its functional form as a function of temperature (T) and structural disorder (X) [1, 4, 8, 9]. The said tail states are very important from practical applications such as the improving electronic properties, improvement in absorption spectra in solar cells [10] and broadening of the emission spectra in light emitting devices etc [11]. The major contributing factors which influence the values of Urbach energy arises from presence of structural disorder, inhomogeneity due to compositional fluctuation, thermal disorders and anharmonicity [5, 6, 12]. The contribution due to thermal disorder can be considered as very small and could be treated as constant at given temperature T in the case of doping dependent measurements. In addition to thermal disorder the anharmonic terms do not have significant involvement at room temperature (RT) [12, 13].
The perovskite type oxides are very popular and are being investigated due to their interesting underlying physics [14–17] as well as technological importance [18–21]. Among these perovskites, orthoferrites have attracted huge attention; possibly due to their potential applications in spintronic devices [22–24], high dielectric constants materials [25, 26], ultrafast magneto-optical storage devices [27–29] and as magneto-dielectric devices [30–32]. In the case of ABO3 type of perovskite oxide it is known that [6, 33, 34] the doping of impurity atom at A or B site modify the electronic and structural disorder. In the case of Raman spectroscopy the effect of structural disorder on the octahedral breathing mode is expected to modulates mainly the asymmetric M–O–M stretching frequencies through the variable M–O bond distance [35]. In addition to these disorders, the tilt angle disorder arises due to change in the octahedral tilt angles also affects the total disorder. Thus, it is clear that the structural, compositional, chemical and thermal disorder contributes to the tail part of the optical absorption spectra and affects the total value of Urbach energy. The exact quantification of these disorders is not easy only by using such absorption spectroscopy techniques. For this purpose the combined synchrotron x-ray diffraction (SXRD) and Raman measurements may be useful, as these data have information on the relative change in the value of octahedral tilts and anharmonicity in Raman modes.
The main objective of present work is to gain a comprehensive understanding on the impact of PrFe1−xCrxO3 on the optical as well as phononic properties. Inclusion of Cr at Fe site seems to modify the local strain field and on-site columbic potential, possibly due to difference in the ionic radii and atomic number (Z) [36–40]. These two effects results in an overall increase in the electronic disorder [36–40] and the said structural disorders have been probed by using SXRD studies, and Raman spectroscopy and the electronic disorder has been probed with optical absorption spectroscopy (OAS) [5, 6, 8, 41–43].
One of the major outcomes of the present work is the broadening in the Raman line shapes is mainly due to temperature independent term i.e. structural disorder, whereas the contributions due to anharmonic terms are not considered as it is predicated to be small at RT. Moreover, a systematic correlation between crystallographic strain, Raman line width, disordered parameter (σ) and Urbach energy has been observed, which implies that structural disorder affects phononic as well as electronic states of the system. To the best of our knowledge, such correlation between structural disorders, phonon disorder and Urbach energy EU which is nothing but electronic disorder, is missing in the available literature. Present study would be useful to understand the variation of electronic disorder and phononic disorder with structural strain and density of disordered phonons. The results have been further confirmed by inducing structural disorder in pure PrFeO3 through laser irradiation.
2. Experimental
2.1. Sample preparation
Polycrystalline samples of PrFe1−xCrxO3 have been prepared via sol-gel method [6, 33]. Citric acid has been used as a chelating agent and ethylene glycol as a fuel. The details of sample preparation methodology has already been reported elsewhere [6, 33].
2.2. Structural characterizations
The structural phase purity of the prepared samples has been investigated by SXRD technique using angle-dispersive x-ray diffraction beamline BL-12, at Indus-2, the Indian synchrotron source. All the experiments were performed in angle-dispersive mode using a Huber 5020 diffractometer and with beam energy of 15 keV [19, 44].
2.3. Diffuse reflectance measurements
RT and temperature dependent (TD) variation of electronic disorder in terms of EU of prepared samples has been estimated using diffuse reflectivity measurements. These measurements have been performed in the 190 nm to 800 nm wavelength range using Cary-60 UV-VIZ-NIR spectrophotometer having Harrick Video-Barrelino diffuse reflectance probe [5, 6, 41, 42, 45, 46].
2.4. Raman measurements
The Raman measurements were carried out on prepared pellets samples by using LABRAM HR dispersive spectrometer equipped with a 633 nm excitation laser source and a CCD detector in backscattered mode. For TD Raman measurements THMS600 stage from Linkam having accuracy 0.1 K was used.
3. Results
3.1. Structural studies
Figure 1(a) shows the representative refined SXRD pattern of polycrystalline 10% Cr-doped PrFeO3. The obtained x-ray diffraction data has been refined considering orthorhombic structure having space group Pnma [6, 33]. A comparison of experimental and the calculated diffraction data and the absence of any extra peak in the diffraction data confirm the structural phase purity of the prepared samples. Figure 1(b) represents the SXRD for the prepared series of samples. It is clear from the inset of figure 1(b) that the peaks shift towards higher 2θ values with increase in Cr content, indicating the decrease in lattice parameters/compressive strain with inclusion of Cr doping. The variation of lattice parameters and Fe–O bond lengths is tabulated in the table 1. A systematic decrease in lattice parameters is consistent with the fact that the ionic radii of Cr3+(0.61 Å) is smaller than Fe3+ (0.64 Å) [33, 47]. From the variation of lattice parameters, octahedral tilt angles [48] are estimated as shown in figure 1(c). It is observed that with increase in Cr doping octahedral tilt angles decreases systematically, which is well conformance with earlier report [35] on similar system. The systematic decrease in the values of Fe–O bond lengths clearly suggest the compressive strain induced with inclusion of Cr doping and has been further estimated by Williamson–Hall plot as shown in figure 1(d). The finite value of strain in pure unoped PrFeO3 could be due presence of natural defects such as; point defects, line defects, dislocations, stacking faults, twins etc which are generally present in the prepared samples [49–51]. The systematic scaling of crystallographic strain with Cr concentration has been further understood by OAS and Raman spectroscopy as discussed in sections 3.2 and 3.3.
Table 1. The variation lattice parameters, Fe–O bond lengths and Fe–O–Fe bond angles as a function of Cr doping. The number in open bracket represents the error bar for that parameter.
| Cr% (x) | a (Å) | b (Å) | c (Å) | Fe-O1 (Å) | Fe-O1 (Å) | Fe-O2 (Å) | Fe-O1-Fe (°) degrees | Fe-O2-Fe (°) degrees |
|---|---|---|---|---|---|---|---|---|
| 0 | 5.477(9) | 5.5649(5) | 7.7735(9) | 2.013(7) | 2.001(7) | 1.998(18) | 153(4) | 153(5) |
| 0.05 | 5.4736(7) | 5.5581(5) | 7.7714(7) | 2.007(7) | 1.998(7) | 1.995(2) | 153.8(4) | 153.7(5) |
| 0.10 | 5.4721(6) | 5.5507(7) | 7.7658(5) | 2.012(6) | 1.993(6) | 1.9982(8) | 153.5(4) | 153.6(5) |
| 0.15 | 5.4709(8) | 5.5464(4) | 7.7647(4) | 1.999(7) | 2.002(7) | 1.991(3) | 153.6(6) | 154.2(6) |
| 0.20 | 5.4694(3) | 5.5421(7) | 7.7614(8) | 1.995(7) | 1.991(7) | 1.991(3) | 153.7(5) | 154.3(6) |

Figure 1. (a) Representative refined SXRD of the polycrystalline 10% Cr-doped PrFeO3. The obtained SXRD has been refined considering orthorhombic structure having space group Pnma. (b) SXRD patterns of the prepared series of samples. Inset (a) illustrates the increase in FWHM of XRD peak with Cr concentration. Inset (b) shows the shifting of XRD peaks towards higher 2θ values with increase in Cr content, indicating the decrease in lattice parameters with inclusion of Cr doping. (c) The variation of octahedral tilt angles as a function of Cr doping. (d) The variation of crystallographic strain as a function of Cr doping in PrFeO3 estimated by using Williamson–Hall method. The systematic scaling of strain is a clear indication of increase in the structural disorder with inclusion of Cr doping and has been understood in terms of difference in the ionic radii of Fe and Cr or difference in the onsite columbic potential.
Download figure:
Standard image High-resolution image3.2. Optical absorption spectroscopy
In order to investigate the possible effect of the above mentioned structural disorder on the electronic disorder near band edge, OAS experiments have been carried out. The Urbach energy EU has been estimated by plotting optical absorption [5, 6, 9, 36, 42, 43, 46, 52] α as a function of energy E. This optical absorption coefficient α is related to energy as:
here, α0 and E00 are the constants that can be determined by inverse of slope of linear region from ln(α) versus E curves at given temperature T. The term  is known as Urbach energy.
Representative data from where Urbach energy is estimated is shown in figure 2(a). The variation of electronic disorder term EU as a function of Cr concentration is illustrated in figure 2(b). From the figure, it is clear that the electronic disorder near band edge systematically increases with Cr doping.
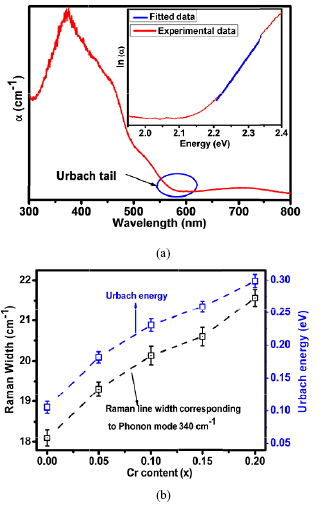
Figure 2. (a) Representative plot from which Urbach energy is estimated. (b) The systematic correlation between Raman line width (Raman mode having a single mode of vibration 340 cm−1) and an electronic disordered term i.e. Urbach energy as a function of Cr content.
Download figure:
Standard image High-resolution image3.3. Raman spectral analysis
PrFeO3 has orthorhombic distorted structure having 24 Raman-active modes which decompose into (7 Ag + 7 B1g + 5 B2g + 5 B3g), 25 infrared-active modes (7 B1u + 9 B2u + 9 B3u), eight inactive modes (8 Au) and 3 acoustic translational modes (1 B1u + 1 B2u + 1 B3u) [23, 53]. The Raman spectra for prepared series of samples are shown in figure 3(a). An increase in the overall Raman line width (corresponding to phonon mode ~340 cm−1) has been observed with inclusion of Cr clearly indicating the scaling of Cr induced structural disorder with Cr concentration. Further, the generation of a new phonon mode at ~510 cm−1 is clearly evident from figure 3(a), which could be either due to structural phase transition with doping or Cr induced structural disorder [23, 54–56]. The variation in the FWHM of phonon mode corresponding to 340 cm−1 is shown in figure 2(b).

Figure 3. (a) The Raman spectrum for prepared series of samples. Raman line shapes shift to the higher wave number region with inclusion of Cr and clearly indicates the Blue shift/compressive strain/hardening behaviour. An additional band generated at around 510 cm−1 whose intensity goes on increasing with the increase of the Cr content is a direct indication of increase in structural disorder with incorporation of Cr doping. (b) The Raman spectrum for pure and irradiated bulk PrFeO3. The scaling of Raman line width with irradiation of Laser pulses clearly indicates the locally induced structural disorder, which further leads to changes in the relative intensity ratio of AS (asymmetric stretching) and SS (symmetric stretching) of FeO6 octahedral modes similar to Cr doping. Inset (a) of figure clearly signifies the increase in the structural disorders/amorphous after higher irradiation/exposed time. The shifting of Raman modes (inset (b)) to lower wave-number side signifies softening of AS/SS FeO6 octahedral modes, indicating the expansion of material due to irradiation.
Download figure:
Standard image High-resolution image4. Discussion
From the SXRD experiments it is clear that with Cr doping FWHM of the diffraction peaks systematically increases (inset (a) of figure 1(b)) which confirms the decrease in structural coherency or increase in the structural disorder. Further, systematic increase in the value of Urbach energy i.e. electronic disorder near band edge has been observed with inclusion of Cr doping. In present study, the systematic variation of electronic disorder has been understood with the help of x-ray diffraction, OAS and Raman spectroscopy as discussed below.
4.1. Optical absorption studies analysis
The variation of electronic disorder EU for prepared series of samples is shown in figure 2(b). It is well accepted that EU is a measure of total disorder present in the system and has contribution due to thermal induced disorder (arises due to random vibrations of atoms with temperature), static structural disorder which are further induced due to mismatch in the ionic radius of Fe and Cr ions as is clear from figures 1(b) and (d). In the present case, the contribution due to thermally induced disorder can be considered as constant, since all the measurements have been carried out at RT. Hence, systematic increase in EU with Cr doping could be due to increase in the extent of structural disorders.
4.2. Raman spectral analysis
It is well known that in AFeO3 type of systems, the observed Raman spectrum is basically dominated by FeO6 octahedral vibration modes [23, 57]. The spectral features are clearly evident in figure 3(a). The modes between or around 400–500 cm−1 and 600 cm−1 are assigned to bending/asymmetric stretching (AS) and symmetric stretching (SS) of FeO6 octahedral Raman modes respectively [57, 58]. It should be noted here that Raman mode that appears around 620 cm−1 in AFeO3 type of systems is assigned to SS of FeO6 octahedral Raman modes and becomes harder with doping [57, 58]. Therefore, its appearance at higher wave number is quite reasonable due to Cr substitution at Fe site. Raman spectrum for prepared series of samples is shown in figure 3(a). It is clear from the figure that in Cr doped samples Raman peaks shifts to higher wave number region, clearly indicating the blue shift/compressive strain/hardening behaviour. Here, it should be noted that symmetric broadening of Raman peaks is essentially controlled by crystallographic strain [23, 53]. However, anti-symmetric broadening of Raman line shapes could be due to interaction of electrons/excitons with phonons [59]. In the present case, symmetric broadening (Raman line shape having single mode of vibration i.e. 340 cm−1) in Raman line shapes has been observed with Cr doping which clearly indicates the increase in crystallographic strain after inclusion of Cr3+ ions at Fe site.
4.3. Systematic correlation between the structural disorder and Urbach energy
As discussed above, a systematic scaling of Urbach energy, broadening in Raman line width and FWHM of x-ray diffraction peak follow the same trend as a function of Cr doping, which suggest that SXRD/Raman line width and Urbach energy are dominated by a common factor. Hence, it might be possible to separate the effects of structural, compositional disorders from those of anharmonic effects and will be discussed later. These results suggest that the crystallographic disorder affects phonons as well as electronic states of the system. In order to understand the physical significance of the various broadening contributions discussed above, it is useful to make a comparative study between electronic disorder term EU and Raman line width. Such comparative study allows us to find the correlation between densities of tail states, structural disorders and anharmonic effects probed by Raman spectroscopy.
It is important here to note that both PrFeO3 and PrCrO3 have orthorhombic structure and have 24 Raman active modes [23, 53]; hence, from Raman spectrum it's not easily possible to differentiate the orthorhombic and any other space group. However, any change in the spectrum with incorporation of doping is expected to be either due to a structural phase transition or it can also be treated as disordered phonon modes [54–56, 60]. It is clear from the figure 3(a) that with Cr doping an additional mode is generated at around 510 cm−1 and intensity of this mode increases with increasing the Cr doping.
As discussed in earlier section, the generation of new mode in Raman spectra with Cr doping can be due to structural disorder [54, 55] or due to symmetry breaking [56, 60], SXRD studies do not show any new peak due to symmetry breaking as no new peak in the diffraction patter appears or existing peak disappears even at much higher values of 2θ where the resolution of the system is much higher. Hence, it appears that the formation of new Raman mode in the Raman spectra is possibly due to structural disorder [40, 54, 55]. Present results are in well agreement with earlier reports [54, 60–62]. In order to further confirm the appearance of Raman mode around 510 cm−1 is due to the structural disorder; laser irradiation has been carried out on pure PrFeO3 samples. The used laser parameters are listed in the table:
| Laser | KrF excimer |
|---|---|
| Wavelength | 248 nm |
| Energy density | 2 J cm−2 |
| Rep rate | 2 Hz |
It is important here to note that various researchers have used laser and irradiation to produce the structural disorder [40, 54, 55, 63]. Figure 3(b) shows the effect of laser irradiation on the Raman spectra of pure PrFeO3. Interestingly the relative intensity ratio of disorder peak (around 510 cm−1) increases after laser irradiation. Further change in the relative intensity of AS and SS mode (as indicated in figure 3(b)) indicates that the bending or AS of FeO6 octahedral modes are highly sensitive to structural disorder which is consistent with earlier studies [40, 57, 61, 66]. From the inset (a) of figure 3(b) it is clearly evident that further laser irradiation leads to huge structural disorder as evident from increase in the intensity of disorder peat at 510 cm−1. Additionally, scaling of Raman line width with irradiation of Laser pulses clearly indicates the locally induced structural disorder, which further leads to change in relative intensity ratio of AS and SS FeO6 octahedral modes similar to Cr doping. A significant red shift due to irradiation is clearly visible from inset (b) of figure 3(b). This shifting of Raman modes to lower wave-number side signifies softening of AS/SS FeO6 octahedral modes, indicates expansion of material (or tensile strain) due to irradiation. At this point it should be noted that according to Raman selection rules, PrFeO3 exhibit 24 first order Raman active modes and Fe does not contribute in scattering due to presence of inversion symmetry. However, structural disorders (defects and impurities) can destroy the inversion symmetry of FeO6 octahedra which in turn may result to formation of additional mode at 510 cm−1. Similar phenomena was previously observed in case of centro-symmetric NaCl, KI and KCl crystals [64, 65]. From this discussion, it can be concluded that the generation of new Raman mode at around 510 cm−1 with Cr doping is due to structural disorder and represents the disordered phonon mode and not a symmetry/structure change.
4.4. Discussion on cationic disorder
Additionally cationic disorder has been studied and estimated value of disorder parameter σ [56, 66] is shown in figure 5. It is well known that disorder due to ionic size mismatch between various ions at the same crystallographic site influences the transport properties of materials [66]. Average cation size and cation disorder are known to affect the electronic as well as magnetic properties of highly correlated oxides [67]. Cation disorder at B-site (σ2) in this ABO3 system can be calculated by standard deviation of the average ionic radii [66, 67].
Here in case of Cr-doped PrFeO3. The cation disorder parameter σ scales with the Cr content as illustrated in figure 5 and has been understood in terms of modification of strain and on-site potential fluctuations due to difference in the ionic radii and atomic numbers of Fe and Cr.
4.5. Some additional remarks and quantification of different kind of disorders
As discussed in the earlier sections OAS have a potential to probe the total disorder present the system. However, in order to quantify the different kind of disorders (structural, thermal, compositional, chemical etc) are not possible only through the OAS techniques. The octahedral breathing mode disorder modulates mainly the asymmetric M–O–M stretching frequencies through the variable M–O bond distance [35] and the corresponding changes can be reflected in Raman Spectroscopy. Similarly the change in the tilt angle and the corresponding tilt disorder, however, affects the lower frequency MO6 liberation-type modes of Ag symmetry [23]. In order to probe the said tilt angles SXRD data has been carefully analysed. The tilt angles θ [1 1 0] and φ [0 0 1] are related to the lattice parameters as [48, 68]:

where a, b and c are the lattice constants of orthorhombic unit cell.
From systematic variation of lattice parameters (which is consistent with the fact that the ionic radii of Cr3+(0.61 Å) is smaller than Fe3+ (0.64 Å)) octahedral tilt angles θ and φ has been estimated and are provided in figure 1(c). It is clear from the figure that with increase in Cr doping θ decreases systematically, which is well conformance with earlier report on similar ferrite system [35]. The disorder due to variation in tilt angle disorder affects the lower frequency soft modes of Ag symmetry. Figure 4 represents the low frequency mode of Ag symmetry in magnified view. It is clear from the figure that with inclusion of Cr doping corresponding mode shifts slightly to lower wave number region. The detail analysis of this mode suggests that the FWHM of this peak also increases which could be responsible for tilt angle disorder, in the present case the percentage change in the FWHM (with respect to the pure PrFeO3 samples) is found to be increasing with Cr doping.
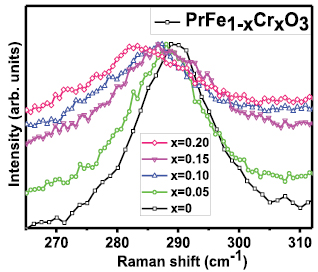
Figure 4. Represents the soft mode of Ag symmetry in magnified view. The red shifting of Raman Ag symmetry mode is well consistent with the variation of octahedral tilt angles with Cr doping.
Download figure:
Standard image High-resolution image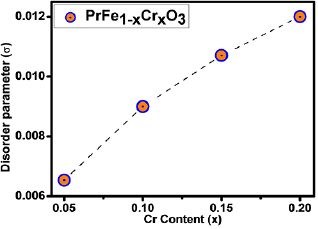
Figure 5. The variation of disorder parameter (σ) as a function of Cr content in PrFeO3.
Download figure:
Standard image High-resolution imageOur evolution of results shows the linear relation between the vibrational frequencies of soft Ag modes and the octahedral tilt angles. However, direct probing of tilt angles are chronically not easy to probe directly, because it requires in depth synchrotron radiation diffraction experiments or neutron diffraction experiments. Our results clearly suggest the linear relation of tilt angles with soft Ag modes; hence, it seems that Raman spectroscopy could be an appropriate tool to probe the lattice distortions and slight changes in octahedral rotations.
However, disorder in octahedral breathing modes modulates mainly the asymmetric M–O–M stretching frequencies through the variable M–O bond distance. A systematic decrease in Fe–O bond length has been observed, whereas Fe–O–Fe bond angles increases with Cr doping. The variation of Fe–O bond length and Fe–O–Fe bond angles is consistent with earlier reports [33, 35, 69]. These parameters affect the asymmetric M–O–M stretching mode (AS) as illustrated in figure 3(a). It seems that AS mode shifts towards higher wave number, which could be due to compressive strain induced with Cr doping (due to decrease in Fe–O bond lengths). Hence, it seems that Raman spectroscopy could be an effective tool to quantify the different types of disorders.
In order to quantify the weightage of octahedral/polyhedral tilt angle disorder and octahedral breathing mode disorder (i.e. disorder due to the presence of two different M–O bond lengths) (i.e. Cr–O and Fe–O bond length) percentage change in FWHM for corresponding Raman modes has been estimated. The percentage change in Raman mode (B3g) around 340 cm−1 is found to be 27% with respect to PrFeO3 which could be the involvement due to the presence of two different M–O i.e. Cr–O and Fe–O bond length. However, the percentage change in Raman mode corresponding to soft Ag mode/octahedral tilt angles is found to be 7% with respect to parent sample which could be considered as the involvement due to tilt angle disorder. The values of said disorders have also been estimated from the corresponding shifts in the peak positions. It has been observed that the contribution due of octahedral breathing mode disorder is ~4 times larger than that that of the tilt disorder. Hence the value of the total Urbach energy will have involvement from the said disorders accordingly (assuming the linear contributions from each disorder).
In order to estimate the possible impact of anharmonic terms, TD Raman spectroscopy measurements were carried out on 20% Cr doped PrFeO3 sample. Figure 6 illustrates the temperature dependence of Raman shift in temperature range 120 K to 300 K. A significant red shift to lower wave-number side is clearly visible, signifies expansion of material (or tensile strain) due to temperature. In order to estimate the effect of anharmonic terms variation of Raman FWHM (corresponding to Raman mode at 340 cm−1) as a function of temperature is fitted with Balkanski model expressed as [12, 13, 70]:
where term T(0) in the model is corresponding to temperature independent terms such as compositional fluctuations, structural defects, inhomogeneity contribution etc. A is related to the anharmonic coefficients for three phonon processes. Here, in the present study we have not considered the four phonon process due to the reason that the involvement of anharmonic terms is small even at RT and becomes less significant at low temperatures. Figure 7 presents the variation of Raman line width as a function of temperature with fits to Balkanski model. The term T(0) (=17.01 cm−1) is temperature independent term (attributed to structural disorders) have significant contribution, whereas, ΔT (6 cm−1) and anharmonic involvement is considered as negligible. These results are well conformance with the earlier reports [12, 70].
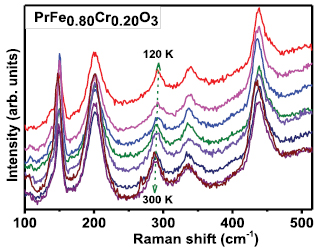
Figure 6. TD Raman spectra for (some TD data points for sake of clarity) 20% Cr doped PrFeO3.
Download figure:
Standard image High-resolution image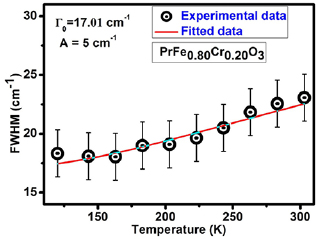
Figure 7. The variation of FWHM of Raman mode at 340 cm−1 as a function of temperature. Balakanski model fitting of experimental FWHM data clearly suggest the contribution due to anharmonic terms is negligible up to RT.
Download figure:
Standard image High-resolution imageAs discussed earlier sections that all EU measurements have been carried out at 300 K, hence it can be assumed that thermal disorder is approximately constant. This statement seems meaningful since the weightage of anharmonic terms is almost constant up to RT. In addition to this, the statement appears to be justified as there exists no substantial variation in Debye temperature even with 20% Ni doping in similar ortho-ferrite LaFeO3 [71, 72]. Thus, the contribution due to thermal disorder may be treated as constant. Hence, it can be concluded that the systematic scaling of Urbach energy, broadening in Raman line width and FWHM of x-ray diffraction peak are dominated by a common factor i.e. structural disorder.
From this discussion, it is clear that at RT the major contributing factor in Urbach energy is due to structural disorders. In order to understand this context in details high temperature OAS and Raman measurements were carried out. Here, it should be noted that increase in random vibrations of atoms with temperature would leads to create thermal disorder as clear from OAS analysis (depicted in figure 9). Raman is a powerful technique to probe the thermal/structural disorders and possible signature of such disorders is essentially lies in spectral width of Raman line shapes. The increase in Raman line width with temperature is depicted in figure 8. It is clear from the figure that EU varies in similar trend as the Raman line width increase, clearly indicating the affection of temperature on phonons dynamics as well as on electronic states of the system. The scaling of FWHM of Raman line width and Urbach energy follows the same trend, i.e. the systematic variation with temperature is dominated by a common factor. However, at high temperatures anharmonic influence significantly contributes to the both terms. The similar variation of electronic disorder term and Raman FWHM is due to increase in random vibrations of atoms with temperature as discussed in earlier literature briefly [5, 13, 34, 70].
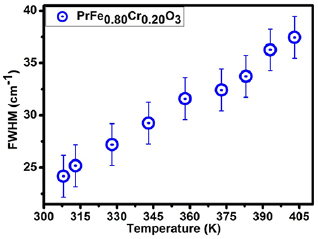
Figure 8. The variation of FWHM of Raman mode at 340 cm−1 as a function of temperature for 20% Cr doped PrFeO3.
Download figure:
Standard image High-resolution image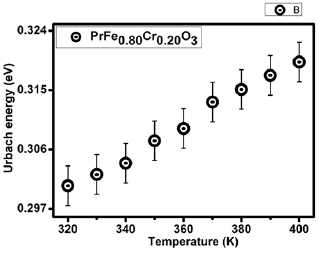
Figure 9. The variation of Urbach energy as a function of temperature for 20% Cr doped PrFeO3.
Download figure:
Standard image High-resolution image
In additional, Raman spectra (shown in figure 3(a)) the mode around 660 cm−1 consists very less intensity in the parent PrFeO3, whereas this peak gains intensity in mixed combination of both Fe and Cr at the B-site, could be due to enhancement in orbital mediated electron–phonon coupling (EPC) with inclusion of Cr doping [35, 73, 74]. However, due to lack of such coupling in PrFeO3, the mode around 660 cm−1 gains very less intensity. This mode is attributed to be due to in phase Fe–O stretching/breathing vibrations [35, 73, 75, 76]. The possible origin of enhancement in intensity of such stretched modes is the charge transfer (CT) between the Fe3+ (d5) and Cr3+ (d3) through an orbital facilitated e–ph interaction mechanism [35, 73, 74]. At this juncture, it should be noted that d5 and d3 electronic configurations does not support such orbital mediated EPC due to absence of highly interacted half-filled eg levels in both transition metal ions. However, when a photon having energy equal to or greater than CT energy gap between transition metals ions (i.e. Fe3+ and Cr3+ in present case), an electronic transition takes place from Fe3+ to Cr3+ ions leaving them in a highly coupled configuration (d4–d4). The increase in such super exchange interactions with inclusion of Cr doping clearly suggests the enhancement in the magnetic interactions [35, 73, 74]. From this discussion, it seems that Raman spectroscopy could be used as a characterization technique for predicting the magnetic properties, this need further investigation.
5. Conclusion
In conclusion, extent of electronic disorder EU is quantified in terms of octahedral breathing mode disorder, tilt angle disorder, thermal and contributions due to anharmonic terms. Present results clearly suggest the linear relationship of tilt angles and soft Ag modes. Hence, it seems that Raman spectroscopy could be an appropriate tool to probe lattice distortions and slight changes in octahedral rotations etc. An additional band observed in Raman spectra around 510 cm−1 has been understood in terms of structural disorder produce by Cr doping. Moreover, a systematic correlation between crystallographic strain, Raman line width, disordered parameter, and Urbach energy has been observed, which implies that structural disorder affects phonons as well as electronic states of the system.
Acknowledgments
SIC IIT Indore is acknowledged for providing some of the experimental facilities. We sincerely thank the Raja Ramanna Centre for Advanced Technology (RRCAT) Indore for providing synchrotron radiation facilities. The authors sincerely thank Dr A K Sinha, Mr M N Singh and Mr Anuj Upadhyay for their help during x-ray diffraction measurements. The authors sincerely thank DST-FIST (SR/FST/PSI-225/2016) for providing funding for Raman spectrometer. Authors (AK, KW, VM) acknowledges the IITI for providing financial support through Teaching Assistantship. Ms. Aanchal Sati acknowledges CSIR New Delhi for providing Junior Research fellowship through Grant No. 1061651837 and IIT Indore for providing an opportunity to pursue a PhD.