

Abstract
In this work, we investigate the intrinsic as well as modulated optical properties of the AB-stacking bilayer armchair graphene ribbons in the absence and presence of external electric fields. Single-layer ribbons are also considered for comparison. By using a tight-binding model in combination with the gradient approximation, we examine the energy bands, the density of states and the absorption spectra of the studied structures. Our results demonstrate that when external fields are not present, the low-frequency optical absorption spectra display numerous peaks and they vanish at the zero point. In addition, the number, the position, and the intensity of the absorption peaks are strongly associated with the ribbon width. With the wider ribbon width, more absorption peaks are present and a lower threshold absorption frequency is observed. Interestingly, in the presence of electric fields, bilayer armchair ribbons exhibit a lower threshold absorption frequency, more absorption peaks, and weaker spectral intensity. When increasing the strength of the electric field, the prominent peaks of the edge-dependent selection rules are lowered, and the sub-peaks satisfying the extra selection rules come to exist. The obtained results certainly provide a more comprehensive understanding of the correlation between the energy band transition and the optical absorption, in both single-layer and bilayer graphene armchair ribbons, and could provide new insights into developments of optoelectronic device applications based on graphene bilayer ribbons.
Export citation and abstract BibTeX RIS
1. Introduction
Since the first experimental demonstration in 2004, graphene has attracted huge attention from researchers due to its unique physical properties [1–4]. With extremely high electron mobility ( cm2 (V·s)−1), graphene promises to be applied widely in electronic devices in the future. Besides the appealing electronic properties, graphene also exhibits rich and peculiar optical features that are interesting for optoelectronic devices [5]. An example is the universal optical conductance in the visible range [6, 7]. The optical absorption is also found to be frequency-independent [6] with negligible reflectance
  [8] which is a fascinating consequence of linear energy–momentum dispersion. In addition, owing to the dependence of the transmittance on the number of layers [9–11], the percentage of energy absorbed in bilayer graphene is estimated at about
  of the incident light.
Thanks to these novel properties, single- and multiple-layer graphene systems have attracted the attention of numerous scientists. In detail, the study of Wang et al [12] illustrated that the IR spectrum of a bilayer graphene is distinct from that of a single one with some van Hove singularities appearing due to the interband transitions between the parallel valence bands. On the other hand, electrical gating has a significant role in tuning the characteristics of IR spectra for graphene bilayer. For instance, Tang et al [13] denoted the quick augment in the intensity of the Fano resonance spectra at the gate voltages away from the charge neutral state. And at the same time, Kuzmenko et al [14] asserted that the occurrence of a broad spectral peak at energy 195 meV arises from the opening gap. Moreover, several studies have been carried out to further examine the optical properties of these materials, for example, the emission spectrum of multilayer graphene [15], the optical conductivity of various structures in Bernal stacking (AB-stacking) [16], and the scanning tunneling spectroscopy of bilayer graphene [17].
Interestingly, for single-layer graphene ribbons (SL-GNRs), theoretical studies indicated that the peak distribution in its low-energy absorption spectra is dominated by the electronic features of each different group [18–20]. This means that, while transitions are allowed between parabolic bands of semiconducting and insulating ribbon structures forming the first peak at low frequency [20], the existence of linear subbands at the Fermi level in the metallic behavior does not produce any optical peaks [21]. Moreover, the distinct selection rules in ribbon structures [18],  and
and  are applicable for the electronic states of the armchair and zigzag ribbons, respectively (where
  is the minimum energy difference between the Fermi level and the correlative subband).
On the other hand, some intensive studies on bilayer graphene ribbons (BL-GNRs) pointed out that the optical responses of this structure are different from those of SL-GNRs [22]. This discrepancy originates from the dissimilarity in the  -electronic structure of single- and bilayer structures. Firstly, the number of electronic states in the double-layer structure is more formidable than in the single-layer one [23]. Secondly, the interlayer interactions in BL-AGNRs are capable of transforming linear subbands at the zero-point energy (appear in SL-GNRs) into parabolic ones, as well as destroying the symmetry between the conduction and valence bands around
  [24]. From that, the peak distribution in BL-AGNRs is more diversified and distinctive from SL-AGNRs.
In the presence of a perpendicular electric field, the gap size of SL-GNRs remains unchanged; meanwhile, the energy gap of the Bernal stacking bilayer structure is modulated and strongly depends on the potential strength. This leads to electron density redistribution and tunability in the number of optical transition channels between the subbands together with the opening gap [25, 26]. Additionally, the effect of the electric field on two edge terminations exhibits both similarities and discrepancies. In detail, the tendency of inducing and modulating the energy gap in group  of the armchair ribbons and the zigzag ones is similar under the impact of both transverse and perpendicular electric fields [27–29]. On the contrary, the semiconducting-to-metal transition is observed for two groups
  and
and  of armchair ribbons under the effect of these electric fields [30]. That is to say, for BL-GNRs, the optical spectra for different families of armchair edges could exhibit diverse transformations under the impact of stimuli and need to be investigated. There have been several works in efforts to unveil the optical properties of BL-GNRs [31–35]. Among these studies, a few studies tried to explore the device performance based on single-layer or multiple-layer GNRs for applications such as photodetectors [32–34] or field-effect transistors [35]. The primary understanding of the intrinsic optical properties of BL-GNRs was unveiled by Berahman et al using ab-initio calculations [31] or the modulated optical properties of these structures under the impact of a magnetic field were studied by Chung et al based on a tight-binding model [19]. However, a general picture of optical properties in BL-GNRs is still largely incomplete, i.e. a lack of consideration about the variation of intrinsic optical properties with the size of the ribbons or the difference as well as the similarity in optical properties of different groups of armchair-edge ribbon structures. In particular, deep analyses of the transition between bands in the electronic structure and optical peaks in the absorption spectra have been not yet provided to interpret the physics underlying the optical properties of BL-GNRs. An extensive study on the impact of external electric fields is also not yet carried out. Therefore, further studies are needed to provide a more comprehensive understanding of the optical properties of BL-GNRs. In this study, by using the tight-binding method and the gradient approximation, we try to provide an insightful view of the mentioned pending issues. The number, intensity, and position of the absorption peaks, as well as the correlation with the electronic states in these structures, are explored for both cases without and with the effect of perpendicular and parallel electric fields. The purpose of this study is to provide a more complete picture of the optical properties of BL-GNRs as well as the guidance in choosing an effective type of stimulant for controlling optical properties, leading to higher absorption efficiency and optical response. The understanding of how to enhance the efficiency of optical-to-electrical conversion in different frequency ranges is important in the practical use of the material for applications such as in photosensors and photovoltaic cells.
2. Modeling and methodologies
2.1. Modeling
To consider the electronic transitions induced by the electromagnetic field, we utilized a model consisting of two layers of graphene that absorb photons in incident light, with energy  as illustrated in figure 1(a). At
  electrons (represented by the red spheres in the inset of figure 1(a)) induce optical transitions from the initial state in the valence band
  to the final state in the conduction band
  resulting in the appearance of the holes in energy subbands
  (illustrated by the hollow red spheres). Interestingly, the perpendicular transitions between the energy levels in graphene structures of armchair edges have the same wave vector
  [36], meaning that
  which is demonstrated by the red arrows. Hence, the excitation energy of an inter-
 -band transition is
  This will be presented in more detail in section 3 below.
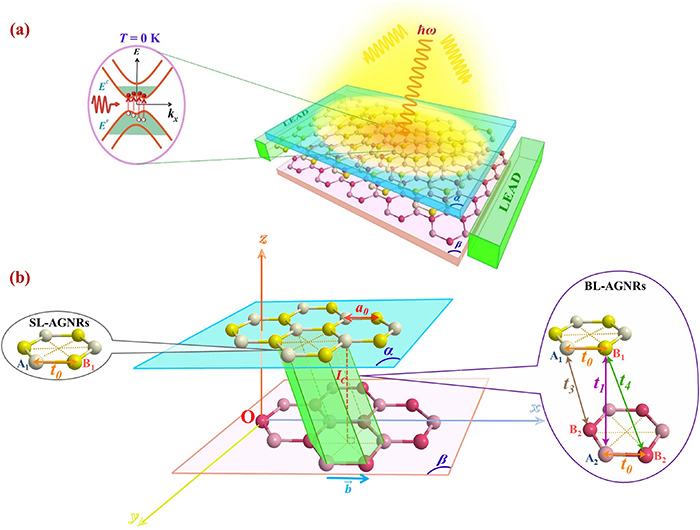
Figure 1. Sketch of (a) the absorption spectra for BL-AGNRs with the interlayer excitations under the presence of an electric field at  (b) the interaction parameters in SL-AGNRs and BL-AGNRs are presented in the left and right panels, respectively.
Download figure:
Standard image High-resolution imageBesides, previous studies have demonstrated that the optical transition is strongly related to the electronic features at low energies [20, 21]. To investigate the electronic structure of bilayer structures, we employed a tight-binding model that atomistic interactions are presented in figure 1(b). Each layer  or
or  illustrates the hexagonal lattice including A1 and B1 (represented by yellow spheres), or A2 and B2 (specified in pink spheres) carbon atoms. The interplanar spacing (in the Oz-direction) is
  [37] and the in-plane C–C bond length (in the Ox-direction) is
  [38]. The interlayer hopping parameters of pairs B1-A2, A1-B2, and B1-B2 are noted as
  and
and  respectively [39]. Meanwhile, there is only one existence of the intralayer coupling
  between two atoms A1-B1 (or A2-B2) [39].
2.2. Methodologies
At  under the presence of electromagnetic waves, electrons are excited from the valence bands (occupied
  bands) into conduction ones (unoccupied
  ones), leading to optical transitions of
  band-to-band. The absorption function according to the Fermi Golden rule at a frequency
  can be written as follows [21, 40]:
Equation (1) contains two parts: the first part  is the velocity matrix element, which determines the optical transition probability between the initial state
  and the final one
  This part is calculated by the gradient approximation, i.e.
  [41, 42], where
  is the momentum operator,
  is the bare mass of the electron, and
  is the derivative of the Hamiltonian
  in
in  -space which is calculated by the tight-binding method. The eigenfunction and the eigenvalue of Hamiltonian
  are
are  and
and  respectively, in which
  corresponds to the subband index of conduction
  or valence subbands
  In this study, by calculating the
  we will define the spectral intensity and after that, investigate the dependence of this quantity on different factors such as the ribbon width and the strength of the applied potential. The second part in equation (1) is the joint density of states (DOS), which is related to the number of allowed channels and utilized to define the absorption peak width. When an electron transition occurs, the optical excitation energy from
  to
to  states is
 and Fermi–Dirac distribution functions for the hole (with
  ) and the electron (with
  ) are described by
 ![$f\left[ {{E^h}\left( {{k_x},{J^h}} \right)} \right].$](https://content.cld.iop.org/journals/0953-8984/35/38/385301/revision2/cmacdc75ieqn56.gif) Furthermore, to avoid divergence
Furthermore, to avoid divergence  the parameter
  is also introduced in equation (1)
  [22]. It is also noted that the primary goal of this work is to unveil a correlation between the characteristics of the optical absorption and those of the electronic structure. As the electronic structure is commonly calculated at the ground state (
 ), we therefore set temperature
  in the Fermi–Dirac distribution function for calculating optical absorption in equation (1).
To obtain eigenstate  and eigenvalue
  in the spectral function
  the Hamiltonian
  explored by the tight-binding approach is given by [43]:
In this equation, the first term  is the constant onsite energy of carbon atoms that is set equal to
  [43]. The second one is referred to as the hopping coupling of the nearest-neighboring atoms in the same layer [39] (i.e.
  ). For bilayer structures, the interactions between two neighboring layers appear and they are presented by the third term in equation (2) [39] (with

 ).
).  is the electrostatic potential energy induced by the external electric field. Depending on the type of electric field, this factor is defined by different expressions [27, 29]; i.e.
  or
or  is in accordance with a perpendicular or parallel electric field. Herein,
  or
or  corresponds to the applied potential of these fields,
  is the parallel electric intensity,
  is the ribbon width, and
  stands for the distance from the origin of potential energy (or the negative electrode
  ) to
) to  th atom site.
It is obvious that if the optical excitations take place, the electronic distribution in subbands will be altered. Because the electronic DOS is sensitive to changes in the electronic structure, this quantity can be employed to examine the electronic distribution in subbands as well as the alternation due to external fields. The DOS spectrum can be computed within Green's function approach:
here Green's function is defined directly from the Hamiltonian 
3. Results and discussions
3.1. Intrinsic optical and electronic properties of SL-AGNRs and BL-AGNRs
In this section, we will focus on the correlation between the electronic and optical properties of SL-AGNRs and BL-AGNRs in the absence of external fields. We will in turn analyze the main characteristics of the optical absorption to be reflected in the electronic transitions among the energy subbands for all three groups  according to the number of dimer lines
3.1.1. Correlation between the absorption spectra and the electronic bands of SL-AGNRs and BL-AGNRs for two groups  and .
and .


First of all, we considered semi-conducting groups  and
and  of armchair-edge structures. The spectra functions of group
  in BL-AGNRs for different ribbon widths correspond to
  as represented in figure 2.
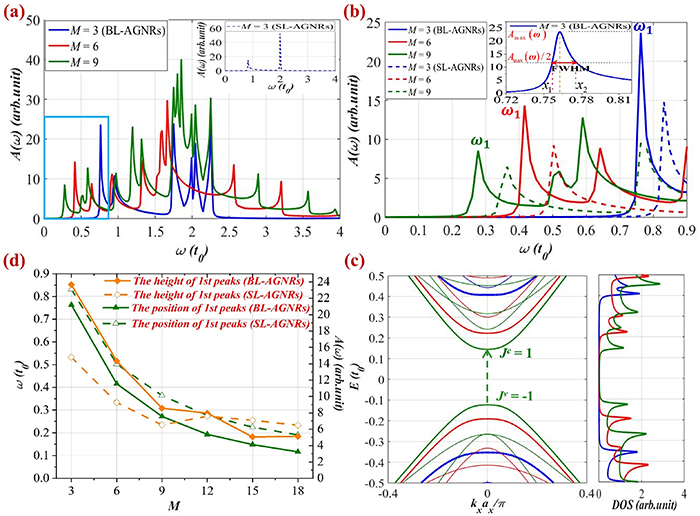
Figure 2. Optical absorption spectra for AB-stacking BL-AGNRs and SL-AGNRs corresponding to group  (a) spectra function calculated for three ribbons of width
  and
and  of BL-AGNRs. The inset presents the absorption spectrum of a SL-AGNRs of width
  (b) The variation of the frequency and the strength of the 1st peaks for BL-AGNRs and SL-AGNRs with the same width. Inset is the FWHM for
  (c) Electronic band structures and DOSs of BL-AGNRs with respect to
  and
and  (d) The height and the position of peaks
  of both SL-AGNRs and BL-AGNRs as functions of the ribbon width.
Download figure:
Standard image High-resolution imageIn figure 2(a), the distinction of the structure peaks in the range ![$\omega = \left[ {0,\,4{t_0}} \right]$](https://content.cld.iop.org/journals/0953-8984/35/38/385301/revision2/cmacdc75ieqn99.gif) indicates a remarkable variation of the position, the height, and the number of optical peaks with the change of the ribbon width
indicates a remarkable variation of the position, the height, and the number of optical peaks with the change of the ribbon width  We noticed that the appearance of the prominent peak near
  stems from the concave-upward parabolic
  bands at
  (in valence bands) and the concave-downward parabolic
  bands at
  (in conduction ones) [22]. More importantly, the previous studies pointed out that the complete flat bands at
  occur in the energy bands of the odd dimer lines
  where the electrons are localized the most significantly [20, 44]. This can be considered as the reason for the existence of the main peak at
  in the absorption spectra for
  and
and  and it is more prominent than that for
  Moreover, the optical spectroscopy of SL-AGNRs (with
  ) also exists a striking peak at this crucial frequency position, as shown in the inset on the upper right corner of figure 2(a).
When comparing the optical spectra in BL-AGNRs and SL-AGNRs at the same ribbon width  it can be seen that the main differences are the positions of peaks
  in the low-frequency region of the former structure closer to the zero-point than those of the latter structure, i.e.
  in BL-AGNRs and
  in SL-AGNRs. In addition, the number of absorption peaks in BL-AGNRs is more outstanding than in SL-AGNRs. The physical explanation is that the energy structure in BL-AGNRs has a more remarkable number of subbands than in SL-AGNRs with the same value of
  [45]. This outcome suggests that when increase in the number of layers to three or more, due to the increment in the number of subbands and the decrease in the gap size [46], it likely causes a significant variation in the absorption spectrum, i.e. a rise in the number of subbands will create new excitation channels, and therefore an increase in the number of peaks. In addition, the narrowing of the electronic gap will result in the redshift as well as the decrease in the height of the threshold absorption peak.
In summary, when the number of these subbands increases, the excitation channels are notably diversified, causing a vigorous increment in the number of absorption peaks. This result is in agreement with the experimental observation on the optoelectronic devices in which it unveiled the dependence of optical properties on the ribbon width as well as the number of layers [47, 48].
It can be also observed that the subpeaks in the left- and right-hand neighborhoods of the main peak move in two opposite directions, which are a redshift (to lower frequencies) and a blueshift (to higher frequencies) respectively. At once, the heights of subpeaks also decline formidably when the width  increases. The above analyses show that the peak structure in the low-frequency absorption spectra varies strongly with the width
  of ribbon structures.
It is worth noting from figure 2(a) that the height of the prominent peak increases with increasing the ribbon width  Our further check on different width structures also confirmed this interesting outcome. This result stems from a special feature in the electronic structures of group
  in which some low-slope or complete flat bands exist near the crucial energy points
  and
and  When the width increases, the number of these bands also raises, therefore the strength of the associate optical peak is also enhanced.
In figure 2(b), the spectral structure of the 1st peaks is observed even more obviously for both BL-AGNRs (solid lines) and SL-AGNRs (dashed lines) in the considered range ![$\left[ {0,0.9{t_0}} \right].$](https://content.cld.iop.org/journals/0953-8984/35/38/385301/revision2/cmacdc75ieqn124.gif) The position of these peaks seems to displace significantly to the lower-frequency range, i.e. the threshold absorption frequencies of BL-AGNRs and SL-AGNRs are correlative to
The position of these peaks seems to displace significantly to the lower-frequency range, i.e. the threshold absorption frequencies of BL-AGNRs and SL-AGNRs are correlative to 

 and
and 


 respectively. Concurrently, the spectral peak shape is adjusted remarkably when changing the ribbon width
  especially it modifies the width of the 1st peak. It is worth noting that the peak width can be calculated by the full width at half maximum technique (FWHM) [49], as an example shown in the inset of figure 2(b) for a BL-AGNR of
  FWHM is defined as the difference between the two values of the independent variable
  and
and  in which the dependent variable is half of the maximum amplitude
  Within this approach, the widths of the spectral peak in BL-AGNRs are
 corresponding to three ribbons of widths
  and
and  It is noted that for group
  the smaller the ribbons are, the narrower the peak widths are, and vice versa. The phenomenon can be interpreted by the fact that for the large values of armchair lines
  both the number of the transition channels forming the peaks
  as well as the electronic distribution at these peaks are increasing, resulting in the broadening of FWHM.
To evidence a correlation between the inter- -band excitations and the formation of optical peaks, we examined the energy bands and the DOSs of BL-AGNRs as shown in figure 2(c). It is worth noting that in this study, the pairs of the conduction and valence subbands are symbolized by the indices
  in an increasing sequence accounted from the Fermi level, with
  where the signs
  and
and  represent the unoccupied
  and the occupied states
  For two groups of semiconducting and insulating ribbons, the previous studies indicated that the formation of the absorption peaks comes from the allowed transitions among the energy levels belonging the same index
  [21, 22]. For instance, the excitation to form the 1st peaks is from
  (
( band) to
  (
( band), meaning that the minimum energy difference is equal to the gap size. More interestingly, because of the van der Waals interactions which are presented via the interlayer parameters (as mentioned in section 2.1), the energy dispersion of BL-AGNRs shows a discrepancy from that of SL-AGNRs. Although electron–hole symmetry can be observed with SL-AGNRs, the interlayer atomic interactions
  lead to the asymmetry between the energy levels around the Fermi energy
  in BL-AGNRs [22, 50]. It results in the fact that the positions of the 1st peaks in SL-AGNRs and BL-AGNRs are defined slightly differently, i.e.
  and
and 
 respectively [18]. When the ribbon width
  increases, the electronic gaps of both single- and bilayer ribbon structures are narrower [51], and then the distance between the two
  and
and  subbands reduces. This causes the shifting of peaks
  towards a lower frequency. Furthermore, with the larger values
  it is easy to notice the decrease of charge density distributed near two peaks around
  of the DOS, leading to the tendency of lowering the height of the 1st peaks in the absorption spectrum. Therefore, it can affirm that the variations in the electronic properties are reflected evidently in the optical features of this group.
Besides, to seek out the regulations about the fluctuations of the strength and frequency of the 1st peaks in the optical spectra for the larger ribbon widths, we investigated the correlation between these two quantities and the ribbon width  (see figure 2(d)) for both SL-AGNRs (dashed lines) and BL-AGNRs (solid lines). These outcomes reveal that the threshold frequency moves to lower energies and the height of these peaks shortens plainly when the ribbon width increases. This result is fully consistent with the consequences seen in figures 2(a) and (b). It also unveils that in the continuity of raising of
  the peak position will tend to approach the frequency
  This result is in agreement with the previous observation on the increase of the metallic behaviors and eventually reaching the nature of infinite graphene sheets when enlarging the size of nanoribbons [52, 53].
Similar outcomes are obtained for the semiconducting group  in both BL-AGNRs and SL-AGNRs, as shown in figure 3 for three ribbons of width

Figure 3. Low-energy absorption spectra with different widths for SL-AGNRs and BL-AGNRs belonging to group  (a) absorption spectra for three considered dimer lines
  and
and  The inset for that of SL-AGNRs with
  (b) Modulations of the frequency and the height of the threshold peaks following the ribbon widths
  and
and  (c) Optical excitation energy induces the 1st peak in the band structure and the corresponding charge density in DOS. (d) Variations of the intensity and the position of the 1st peaks for AB-stacking and SL-AGNRs as the functions of their width.
Download figure:
Standard image High-resolution imageNevertheless, by comparing the spectral structures in figures 2 and 3, we can observe a discrepancy in the spectra of two groups  and
and  the tendency of the moving to lower energies of the threshold frequency in group
  is faster than in group
  (as illustrated in figures 2(b) and 3(b)). In detail, the positions of peaks
  in BL-AGNRs for three ribbons of width
  representing group
  are
are  respectively (see figure 3(b)), meanwhile, the corresponding values of ribbons of width
  within group
  are
are  respectively (see figure 2(b)). This discrepancy can be explained by the fact that the gap size of group
  is always smaller than group
  for the same
  -value [51, 54, 55]. More interestingly, for each group, the bandgap of BL-AGNRs is always smaller than that of SL-AGNRs with respect to the same dimer lines
  [23] resulting in the shifting of threshold frequency of BL-AGNRs to the zero-point frequency is faster than that of SL-AGNRs.
It is also worth noting that the variation of the 1st peak with the change of the ribbon width for two groups  and
and  is similar to what was observed for the energy gap in these groups [27, 29], indicating a strong correlation between the optical and electronic properties. To reveal a correlation between the optical peaks, in particular, the first one, and the energy gap, we plot in figure 4 the relationship between the frequency of the 1st peaks and the gap size in groups
  and
and  for both SL-AGNRs and BL-AGNRs, for the same number of dimer lines
  computed in figures 2(d) and 3(d). Interestingly, it unveils that the position of the
  is equivalent to the magnitude of the energy gap,
  for both groups. Thus, the formation and the characteristics of the first peak depend strongly on the gap size of the structure, revealing a possibility to tune the optical properties by modulating the electronic properties, in particular, the gap size of the electronic structure.

Figure 4. Correlation between the first peak position and the energy gap corresponding to each dimer line for both groups: (a)  and (b)
  The green triangle symbols represent for group
  and the purple ones illustrate the other group.
Download figure:
Standard image High-resolution image3.1.2. Correlation between the absorption spectra and the electronic bands of SL-AGNRs and BL-AGNRs for group 3p + 2.
To present a thorough understanding of the optical spectra for all three groups of armchair ribbons, we continue to investigate the ribbons of group  The results of ribbons of width
  and
and  are displayed in figure 5.
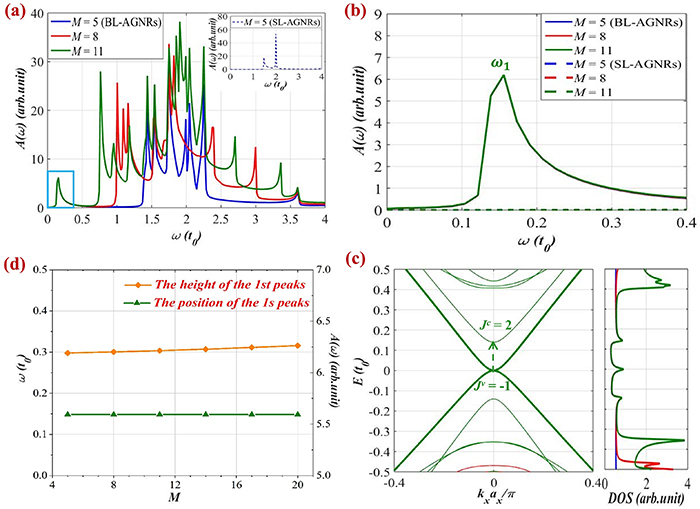
Figure 5. Optical absorption function and electronic properties computed for group  in BL-AGNRs and SL-AGNRs: (a) the rich peak structures for BL-AGNRs of widths
  and
and  Inset is the low-energy absorption spectrum of SL-AGNRs with
  (b) The invariance of the position and the intensity of peaks
  according to the values
  in BL-AGNRs, and the disappearance of these peaks in SL-AGNRs for the same frequency. (c) Excitation in the band structure and the DOS of armchair ribbons of widths
  and
and  (d) The height and the position of the 1st peaks for AB-stacking as the functions of the ribbon width
  .
.
Download figure:
Standard image High-resolution imageFigure 5(a) points out that when ascending the ribbon width, the peak pattern of ribbons belonging to this group also exhibits many features similar to the semiconducting groups considered in section 3.1.1. The prominent absorption peaks are also distributed richly in the low energy region, and the number of peaks also augments when  increases. However, figure 5(b) shows that the spectra of this group present some distinct characteristics, i.e. the 1st peak positions and intensities are almost invariable according to the ribbon width
  This phenomenon is understandable due to the fact that ribbon structures of group
  persist in the semi-metallic state and the low-energy region is almost not modulated when changing the ribbon width [51].
Notably, the optical absorption spectra of peaks  for BL-AGNRs and SL-AGNRs are not identical entirely, even though groups
  of both structures are semi-metallic. In particular, in the low-frequency range
 ![$\left[ {0,\,0.4{t_0}} \right],$](https://content.cld.iop.org/journals/0953-8984/35/38/385301/revision2/cmacdc75ieqn220.gif) there exists a sole peak in absorption spectra of BL-AGNRs that its height and frequency position remain unchanged with respect to the change of the ribbon width. Meanwhile, this peak seems to vanish in the same region for SL-AGNRs. These consequences agree well with the alternations in the band structure of SL-AGNRs and BL-AGNRs and can be interpreted as the interlayer (van der Waals) interactions in BL-AGNRs result in the creation of extra subbands [45, 50]. In other words, the number of optical peaks in the spectral function of BL-AGNRs is more remarkable than those of SL-AGNRs.
there exists a sole peak in absorption spectra of BL-AGNRs that its height and frequency position remain unchanged with respect to the change of the ribbon width. Meanwhile, this peak seems to vanish in the same region for SL-AGNRs. These consequences agree well with the alternations in the band structure of SL-AGNRs and BL-AGNRs and can be interpreted as the interlayer (van der Waals) interactions in BL-AGNRs result in the creation of extra subbands [45, 50]. In other words, the number of optical peaks in the spectral function of BL-AGNRs is more remarkable than those of SL-AGNRs.
Further analyses, we can see from the energy dispersion in figure 5(c) that the formation of the 1st peaks in group  for BL-AGNRs obeys the additional selection rule that is different from the cases of the two groups
  and
and  And this phenomenon derives from the insistence in the semi-metallic behavior of group
  when increasing the ribbon width [51]. This leads to the fact that subbands
  and
and  are almost in contact at Fermi energy for all cases of width
  Consequently, the electronic excitations between parabolic bands
  (lying at the Fermi level) and
  induce the presence of the optical peak in the low-frequency range. And at the same time, although the ribbon width
  varies, the charge distribution at these levels remains constant as reflected in the DOS panel on the right side of the band structure, and this explains the constant amplitude of peaks
  for different
Interestingly, our further examination of the variations in the frequency and the height of the 1st peaks with the change of the ribbon widths shows that these quantities are almost unchanged with the increase of  as can be seen in figure 5(d). Thus, in the absence of electric fields, both the absorption spectra and the low-energy electronic structure of ribbons within group
  are nearly independent of ribbon width
  concurrently the electronic properties retain in the half-metallic behavior for all ribbons.
Although the AA-stacking order is not considered herein, it is still worth noting that for the ribbon of width belonging to group  the electronic structure of AA-stacking BL-AGNRs presents a linear character around the Fermi level, the same as in the single-layer ribbon. In contrast, the low-energy bands of the AB-stacking structure are parabolic [56]. As a result, the absorption spectrum of AA-stacking BL-AGNRs is likely analogous to that of single-layer ribbons and there is no existence of the 1st peaks at low-frequency
3.2. Impact of an external electric field on the optical and electronic properties
It has been demonstrated that external electric fields can modulate the electronic properties of BL-AGNRs that changes can be visibly observed in the band structure and the DOS of this material [27–30]. This means that both the gap size and the electron distribution are modulated significantly with electrostatic potentials. On the other hand, the above analyses pointed out that there is a tight correlation between the optical and electronic properties, thus leading to the possibility of employing stimuli such as electric fields to tune the optical quantities. AB-stacking BL-AGNRs are also demonstrated to react with external electric fields more strongly than AA-stacking ones [56]. This is the special feature of AB-stacking compared with AA-stacking and SL-GNRs. Therefore, the optical properties of AB-stacking bilayer ribbons can be efficiently modulated by external electric fields. In this section, we will investigate the variation of the absorption peak structure under the influence of either a perpendicular or a parallel electric field.
3.2.1. Impact of a perpendicular electric field
3.2.1.1. Optical absorption spectra of two groups and under the impact of a perpendicular field.


First, we consider the impact of a perpendicular electric field on the optical properties of the intrinsically semiconducting groups  and
and  Figure 6 presents the results corresponding to BL-AGNRs of widths
  and
and  representing these two groups respectively. Two cases of the applied electric potentials
  and
and  were considered.
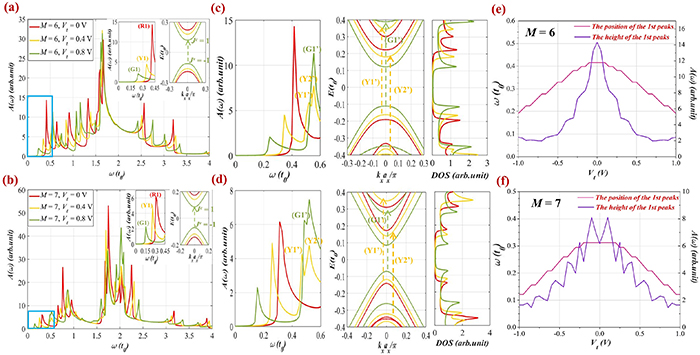
Figure 6. Absorption spectra  of the AB-stacking in the perpendicular case for the two groups (a)
  and (b)
  Insets in each figure are the modifications of the position and the excitation energy of peaks
  respectively. In (c) and (d), the appearance of new peaks (Y1ʹ), (Y2ʹ) and (G1ʹ) in the
  of each group. The corresponding band structures and DOSs are on the right-hand side of the
  spectroscopies. The position and the height of threshold peaks with varied potential
  for dimer lines (e)
  and (f)
  .
.
Download figure:
Standard image High-resolution imageIn figures 6(a) and (b), we can observe a considerable modulation of absorption spectra when varying the field strength (via  ). Interestingly, under the impact of the electric field, the peaks are shifted visibly, in which the subpeaks on the left-hand side of the main peak tend to move toward lower frequencies, and vice versa, those on the right-hand one shift toward higher frequencies. The insets in figures 6(a) and (b) clearly show the trend of shifting of the absorption peaks in the low-frequency region when increasing the applied voltages. Additionally, the electric field impacts significantly on the main peak at
  in the ribbons of group
  These phenomena are quite similar to those observed in figures 2 and 3 when varying the ribbon widths
  of these two groups and can be explained as follows: when enhancing the applied voltages, the displacement of subbands
  in the energy bands (see the insets of figures 6(a) and (b)) is the main reason for the moving of peaks
  When the electric potentials increase, these subbands tend to get closer to each other, and then the gap size is narrower as can be seen from the electronic structures in figures 6(c) and (d). Besides, we also found that the intensity of peaks
  declined greatly at the stronger electrostatic potentials.
Therefore, the outcomes unveil that the perpendicular electric field has strong effects on modulating the frequency and the height of the 1st peaks in the spectral function for both groups  and
and  It is also worth noting that in the comparison of the displacement of the 1st peaks among these two groups, the results show that for the same applied voltage, the peaks
  in group
  exhibit a tendency of the move to the low-frequency range faster than in group
  In detail, when applying different potentials
  in the ribbon of width
  the frequencies of the 1st peaks (R1), (Y1), (G1) are
  respectively. For the ribbon of width
  the values correspond to
  respectively. Such discrepancy is because the magnitude of the energy gap in group
  reduces formidably compared to that in group
  at the same applied potential
Further analysis, in the higher-frequency region, i.e.  as shown in figures 6(c) and (d), we can observe three new peaks marked as (Y1ʹ), (Y2ʹ), and (G1ʹ) in both ribbon structures. These peaks are determined at the frequencies of
  (in group
  ), and
  (in group
  ) when
  and
and  respectively. These peaks do not obey the selection rule as for the 1st peaks but are satisfied with the extra selection rules [19]. In particular, the possible transitions happening between
  (
( bands) and
  (
( bands) or from
  (
( bands) to
  (
( bands) are illustrated by the dashed green and yellow arrows in the electronic bands in figures 6(c) and (d). This indicates an increment of transition channels when enhancing the electric field strength as the excitations not only occur from the top valence band
  to the bottom conduction one
  but also with other different energy levels in the subband structure. Thereby, the reduction of the amplitude of the 1st peaks and the enlargement of the height of neighboring new peaks are seen at higher voltages. Moreover, these changes are reflected by strong alternations in the number and the position of peaks in the DOS panels, as shown in figures 6(c) and (d).
Furthermore, to provide an overall picture of the variation in the intensity as well as the position of the peaks  with the applied potential, we considered these quantities when varying
  in the range from −1 V to 1 V as shown in figures 6(e) and (f). The violet and pink lines (relative to the peak height and position) point out that these quantities reduce with the increase of
  in particular, a rapid reduction is observed in the range of
 ![${V_t} = \left[ { - 0.5\,{\text{V}},\,0.5\,{\text{V}}} \right].$](https://content.cld.iop.org/journals/0953-8984/35/38/385301/revision2/cmacdc75ieqn295.gif) The phenomenon of moving towards the lower frequencies of the peaks
The phenomenon of moving towards the lower frequencies of the peaks  can be elucidated by the narrowing of the gap size under the effect of electric fields [27, 29]. When the excitation energy
  reduces, electrons are easily transmitted between the valence and conduction bands, leading to the increment of the optical conductivity.
Thus, the perpendicular field impacts significantly on the position, the number, and the height of the optical peaks in semiconducting groups of BL-AGNRs.
3.2.1.2. Optical absorption spectra of group under the impact of a perpendicular field.

To understand completely the optical properties of all three groups of ribbon structures under the effect of a perpendicular electric field, we continue to analyze the optical spectra of group  which is represented via the results obtained in figure 7 for the ribbon of width
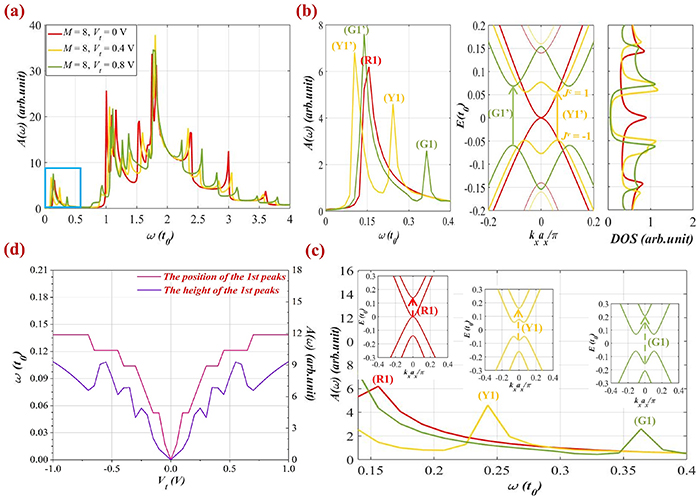
Figure 7. Optical spectra function is shown for the BL-AGNRs with  under the control of different perpendicular electric fields: (a) optical spectra for
  without and with fields applied
  (b) Electronic excitations to form two new peaks (Y1ʹ) and (G1ʹ) correspond to the potential strengths
  and
and  in the energy band. Also illustrated are the absorption spectra and the DOS on the left- and right-hand side of the electronic dispersion, respectively. (c) Displacements of peaks (R1), (Y1), and (G1) towards the higher frequency. The inset shows the corresponding optical transition to form each peak. (d) The 1st peak height and position are the functions of applied voltage
  in the range
 ![$\left[ { - 1\;{\text{V}},\;1\;{\text{V}}} \right]$](https://content.cld.iop.org/journals/0953-8984/35/38/385301/revision2/cmacdc75ieqn307.gif) for ribbon width
for ribbon width  .
.
Download figure:
Standard image High-resolution imageFigure 7(a) shows that the perpendicular electric field gives rise to new peaks contiguous to the threshold absorption peaks as well as adjusts the shape of the main peak near  Specifically, observing the energy bands in figure 7(b), it can be seen that the energy gap exhibits a trend of, first, opening, and then enlarging in the presence of the electric field, i.e.
  when
when  respectively. It is worth mentioning that the two new peaks (Y1ʹ) and (G1ʹ) obey the selection rule
  Here, once again we notice a correlation between the excitation energies in the electronic band and the peak positions
  in the spectral function. For example, for
  the peak frequency (Y1ʹ) is positioned at
  equal to the energy difference between the energy levels
  (corresponding to
  ) and
) and  (corresponding to
  ) in the energy bands. Furthermore, when varying
  the two new peaks (Y1ʹ) and (G1ʹ) tend to move to higher frequencies. The above outcomes are distinct from the behaviors of groups
  and
and 
Comparing the amplitude of these two new peaks, (G1ʹ) is more outstanding than (Y1ʹ), thus demonstrating that the increase of the potential strength leads to the augmentation of the peak height. Such a change in the optical spectrum is strongly correlated with the change in the electronic DOS (on the right-hand side of the energy dispersion). We can observe the formation of the first DOS peak around  when applying an electric field, and with a stronger applied voltage, these two new peaks shift far away from the zero energy point. For example, these DOS peaks are determined at the energy levels
  and
and  when
when  and
and  respectively. In addition, we also realize that the splitting effect occurs in the vicinity of the degenerate levels in the DOS, implying that the perpendicular electric field has a vigorous impact on the modification of the sub-energy bands of BL-AGNRs.
We also examined clearly a variation of the position and the height of peaks (R1), (Y1), and (G1), as shown in figure 7(c) for the range of frequency  In which, the dashed arrow in each inset panel of the energy structure illustrates the optical transition of these peaks corresponding to the applied potentials
  It is worth mentioning that these excitation channels have the same regulation, arising from the energy level
  to the one
  in the electronic structure. For instance, the transition from
  to
to  causes the formation of the peak (Y1) at
  Notably, several Mexican-hat shape dispersions could appear when the applied voltage is large enough as seen in the band structures in figures 7(b) and (c). This phenomenon is explained by 'the band inversion', as presented in [57, 58].
To understand the variations in the amplitude and the position of the first peak in the optical spectra, we plotted these quantities as a function of the applied potential in the range ![$\left[ { - 1\;{\text{V}},\;1\;{\text{V}}} \right],$](https://content.cld.iop.org/journals/0953-8984/35/38/385301/revision2/cmacdc75ieqn339.gif) as shown in figure 7(d). The results show that these two quantities seem to augment significantly in the range
as shown in figure 7(d). The results show that these two quantities seem to augment significantly in the range ![$\left[ { - 0.5\;{\text{V}},\;0.5\;{\text{V}}} \right],$](https://content.cld.iop.org/journals/0953-8984/35/38/385301/revision2/cmacdc75ieqn340.gif) then beyond this region, the rate of increase tends to be slower. In other words, when the gap size is extended vividly in the small values of the applied voltages, the position of the peaks
then beyond this region, the rate of increase tends to be slower. In other words, when the gap size is extended vividly in the small values of the applied voltages, the position of the peaks  reaches a higher frequency. This result is consistent with the previous studies [27, 29], and the above discussions.
3.2.2. Impact of a transverse electric field.
The above analyses indicate vigorous effects of a perpendicular electric field on the absorption spectra. This could lead to the question of how physics changes under the impact of a transverse electric field. To answer this questionnaire, we keep investigating the variation in the spectral function of BL-AGNRs as well as SL-AGNRs under the presence of a transverse electric field. The results are shown in figure 8.
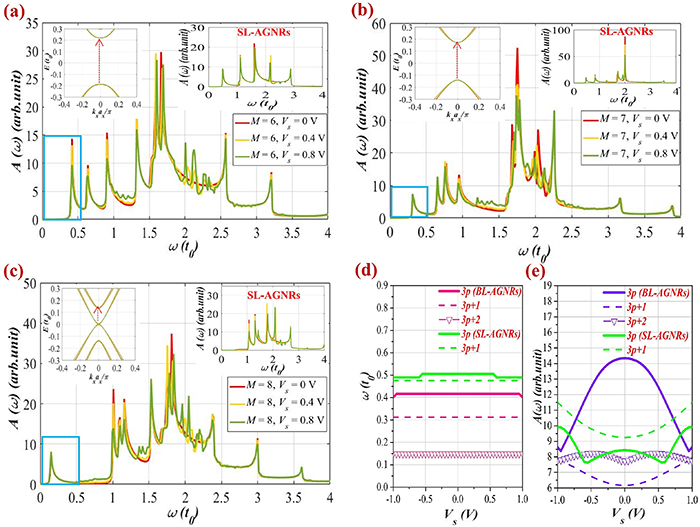
Figure 8. Effects of the transverse electric field on the absorption spectra of BL-AGNRs and SL-AGNRs exhibited for three ribbon widths: (a)  (b)
(b)  and (c)
  Insets in the left- and right-hand sides relative to the electronic excitation in the energy band of BL-AGNRs and the optical spectra of SL-AGNRs. In (d) and (e), the frequency position and the height of the threshold peaks are considered as functions of
  .
.
Download figure:
Standard image High-resolution image
Observing the low-energy absorption spectra in figures 8(a)–(c) for various ribbons of width  and
and  we notice that the features of the optical structure in BL-AGNRs and SL-AGNRs do not change much compared to the case without the external fields. Specifically, the outcomes show that there is no emergence of any striking peaks in the absorption spectra when varying the field strengths, meaning that the transverse electric fields do not enrich the optical properties as in the case of the perpendicular ones. The only tunability is the reduction in the height of the main peak at
  in the rising of the applied voltage. As analyzed in figure 2(a), to form this peak, electrons are excited among the parabolic bands
  (see figures 8(a) and (c)), or the complete flat bands
  (see figure 8(b)). The electrostatic potentials lead to a redistribution of electrons in these subbands, causing variations in the height of the main peak as well as the small perturbations of subpeaks nearby.
Importantly, the position of the peaks  seems to be invariant in raising the applied potential
  for all the considered ribbons. Such a result can be interpreted as the bandgap is not opened or the excitation energy among the subbands adjoining the Fermi level to form these peaks is almost constant (indicated in the inset, on the left-hand side of each absorption spectrum). Moreover, when examining the low-energy absorption spectra of SL-AGNRs, as indicated in the inset in figure 8(c), we recognize that there does not exist any 1st peak in the peak structure of the metallic group
  in the low-frequency region.
In figures 8(d) and (e), we examine the dependence of position and amplitude of the peaks  on the applied voltages
  in the range
 ![$\left[ { - 1\,{\text{V}},\,1\,{\text{V}}} \right]$](https://content.cld.iop.org/journals/0953-8984/35/38/385301/revision2/cmacdc75ieqn352.gif) for SL-AGNRs (groups
for SL-AGNRs (groups  and
and  ) and BL-AGNRs (groups
  and
and  ). The results disclose that the frequency position of the 1st peaks in each group is nearly constant in the considered range of the applied potential
  Nevertheless, the position of these peaks in different groups and distinct structures is not the same. Besides, we also denote that the height of these peaks is more sensitive under the impact of transverse fields (see figure 8(e)), in which, group
  of BL-AGNRs has the most considerable changes among the considered structures.
In the analyses for the impacts of the transverse and perpendicular electric fields, we have thus seen the dissimilarities in modulating the optical and electronic properties of each field. The perpendicular field exhibited a strong impact on the gap size and electron distribution, resulting in significant changes in the increment of the number, the alteration of the height, and the position of the optical peaks. On the contrary, the transverse field presented weak impacts on these quantities. Such a discrepancy between the effects of two electric fields on the optical properties is similar to what is observed in the electronic properties [27, 29]. And the distinguished influences can be explained as follows: in BL-AGNRs, the perpendicular field generates the same potential at the atomic sites in the same plane, and therefore its impact does not rely on the ribbon width  Hence, the influence of this type of electric field is characterized mainly by the applied potential
  In contrast, with the model of applying the transverse field, the atoms are lying away from the electric gating
  (chosen as the origin) with various distances, meaning that the effect of this field is dependent directly on the ribbon widths. Interestingly, the perpendicular field exhibits a more strong influence than the transverse one in the alternation of the peak structure for optical spectra of the AB-stacking sequence.
4. Summary and conclusions
By utilizing the tight-binding calculations in combination with the gradient approximation, the variations of the optical absorption, the energy dispersion, and the DOS spectra of BL-AGNRs were investigated detailedly in comparison with those of SL-AGNRs. The results showed that the alternations in the peak structure of the absorption spectra  for these two types of ribbon structures not only depend on the ribbon of width
  but also the type of applied electric field (a perpendicular or a parallel field).
First, in the absence of external fields, the optical spectrum of BL-AGNRs exhibits richer features compared to SL-AGNRs thanks to additional subbands appearing in the electronic structure. With the same ribbon width, the absorption peaks of BL-AGNRs are observed at lower frequencies compared to that of their counterparts. When increasing the ribbon width, the 1st peaks alter differently for each group of BL-AGNRs and SL-AGNRs. Nevertheless, for two semiconducting groups  and
and  the peaks
  in both BL-AGNRs and SL-AGNRs obey the selection rules,
  and shift gradually to the zero-point frequency when increasing the ribbon width. For the semi-metallic group
  there exists an absorption peak in the frequency range
 ![$\left[ {0,\,0.4{t_0}} \right]$](https://content.cld.iop.org/journals/0953-8984/35/38/385301/revision2/cmacdc75ieqn369.gif) of the optical spectrum of BL-AGNRs and it remains unchanged with the ribbon width, meanwhile, no such peak is observed in the same frequency region of SL-AGNRs.
of the optical spectrum of BL-AGNRs and it remains unchanged with the ribbon width, meanwhile, no such peak is observed in the same frequency region of SL-AGNRs.
In the presence of external electric fields, the number, the frequency position, and the intensity of absorption peaks are modulated significantly. The perpendicular electric field exhibits a stronger effect than the transverse one in causing the diverse distribution of the optical peaks, as well as in modulating the energy gap of the ribbon structure. By applying a perpendicular field, the subpeaks following the additional selection rule are created in the low-energy region of the absorption spectra of BL-AGNRs. Furthermore, when the field strength increases, the 1st peaks of the two groups  and
and  show a tendency moving towards the zero frequency, and vice versa, the ones of group
  shift towards higher frequencies due to the enlarging of the energy gap. In addition, the height of these peaks also raise considerably by enhancing the magnitude of the electric potential. Unlike the perpendicular field, the transverse one only results in variations in the intensity of the 1st peaks, especially in group
  without affecting the position of these peaks in both two single-layer and bilayer structures.
Our study has provided a thorough perspective on the tight correlation between the optical absorption spectrum and the electronic structure. It also pointed out the effectiveness of each type of stimuli on the optical absorption properties of BL-AGNRs and could open paths for using BL-AGNRs in optoelectronic applications.
Acknowledgments
This research was supported by Vietnam National Foundation for Science and Technology Development (NAFOSTED) under Grant Numbers 103.01-2020.10.
Data availability statement
All data that support the findings of this study are included within the article (and any supplementary files).