

Abstract
Particle therapy is increasingly attractive for the treatment of tumors and the number of facilities offering it is rising worldwide. Due to the well-known enhanced effectiveness of ions, it is of utmost importance to plan treatments with great care to ensure tumor killing and healthy tissues sparing. Hence, the accurate quantification of the relative biological effectiveness (RBE) of ions, used in the calculation of the biological dose, is critical. Nevertheless, the RBE is a complex function of many parameters and its determination requires modeling. The approaches currently used have allowed particle therapy to thrive, but still show some shortcomings. We present herein a short description of a new theoretical framework, NanOx, to calculate cell survival in the context of particle therapy. It gathers principles from existing approaches, while addressing some of their weaknesses. NanOx is a multiscale model that takes the stochastic nature of radiation at nanometric and micrometric scales fully into account, integrating also the chemical aspects of radiation-matter interaction. The latter are included in the model by means of a chemical specific energy, determined from the production of reactive chemical species induced by irradiation. Such a production represents the accumulation of oxidative stress and sublethal damage in the cell, potentially generating non-local lethal events in NanOx. The complementary local lethal events occur in a very localized region and can, alone, lead to cell death. Both these classes of events contribute to cell death. The comparison between experimental data and model predictions for the V79 cell line show a good agreement. In particular, the dependence of the typical shoulders of cell survival curves on linear energy transfer are well described, but also the effectiveness of different ions, including the overkill effect. These results required the adjustment of a number of parameters compatible with the application of the model in a clinical scenario thereby showing the potential of NanOx. Said parameters are discussed in detail in this paper.
Export citation and abstract BibTeX RIS
1. Introduction
The improvement of particle therapy treatments strongly relies on the accurate estimation of the ion relative biological effectiveness (RBE), defined as the ratio of doses of a reference radiation and of the ion necessary to achieve the same biological endpoint (Kraft 2000, Schardt et al 2010). The RBE is a complex function of multiple parameters, such as radiation quality, dose, dose rate, biological endpoint, cell type and cell cycle stage. In this scenario, modeling is fundamental for RBE determination. Since the so-called 'target theory' (Lea 1946), many other models have been published in an attempt to describe and predict cell response to different radiation qualities. The need for such models increased as the interest in particle therapy also grew and the number of facilities using ions heavier than protons spread worldwide. The most developed approaches in heavy-ion therapy are those based on either amorphous track structure or microdosimetry theories. The former makes use of the radial dose, i.e. the mean dose deposited around a single ion trajectory (Butts and Katz 1967). The latter relies on microdosimetric concepts and on the estimation of the stochastic energy deposition into volumes of micrometric dimensions, quantified by the specific energy (Kellerer 1985).
The most suitable observable to examine the induced deterministic effects is cell survival, which integrates all death pathways that may follow irradiation. The experimental measurements on most mammalian cell lines cultured in vitro showed that the fraction of surviving cells exposed to a given dose can be described by a linear-quadratic (LQ) expression:

It is possible to derive tumor control probability (TCP) from this expression (Ahmad et al 2009, Joiner and van der Kogel 2009, Chanrion et al 2014). This representation can neither take account for typical structures at low doses (Cunha et al 2016a) nor for the evolution of cell survival at high dose values, but is the most considered in photon and particle radiotherapy since only two parameters are required for describing cell survival within a dose range matching many treatment sessions. The parameter β, which in the usual semi-logarithmic representation of equation (1) describes the 'shoulder', accounts for the accumulation of sublethal lesions that is effective for sparsely ionizing particles, but also for lesion repair and respective saturation; α, on the contrary, is ascribed to singly lethal events which are known to be more frequent for densely ionizing particles. The parameterization shown in equation (1) is not exhaustive since cell survival presents a complex dependence on multiple factors related to the radiation field and the cell features and environment, which may be implemented in treatment planning systems (TPSs) according to different approaches. Cell survival charts may be measured for a large number of clinically relevant irradiation conditions and cell lines, or alternatively predicted by a biophysical model with a restricted set of input data. In both cases, however, the LQ phenomenological model can be derived to express the dose-response relationship (Brenner et al 1998) and produce a table of  and
and  for a list of ions of type Tk and energy Ek. Such a table constitutes the input for estimating in a simple and fast way the cell survival to mixed fields (Zaider and Rossi 1980, Kanai et al 1997, 1999), which is nowadays employed in particle therapy facilities:

and

where fk is the fraction in dose of ions of type Tk for the mixed field.
The only two models currently implemented in the TPSs of heavy-ion therapy facilities are the local effect model (LEM, versions I (Scholz et al 1997), II (Elsässer and Scholz 2007), and III (Elsässer et al 2008)) (Krämer and Scholz 2000, Krämer et al 2012) and, more recently, the modified microdosimetric kinetic model (mMKM) (Kase et al 2006, 2011, Inaniwa et al 2010, 2015). Both these models rely on the three following basic constituents: target geometry, cell survival curve to photons, and track structure (Kase et al 2008). Using the track structure instead of the estimation of microdosimetric quantities to describe the pattern of energy deposition is the main difference with respect to the original MKM (Hawkins 1994, 2003, Kase et al 2008). Together with the empirical approach applied at the National Institute of Radiological Sciences (NIRS) in Japan, these biophysical models led to the success of particle therapy with carbon ions. However, they present some limitations that should be addressed or questioned. The most striking is, as already mentioned, the use of amorphous track structure, a mean quantity, instead of taking the stochastic nature of the dose deposition fully into account. This procedure facilitates the clinical implementation of the model, but may result in conceptual incongruities (Beuve 2009, Russo et al 2011). An example of such incongruities appears in the aforementioned versions of LEM, which are able to describe the typical shoulder of cell survival curves for lower linear energy transfer (LET) ions, although only local events were considered. As it has been shown in Beuve (2009), a theory based uniquely on local lethal events cannot reproduce these typical shoulders. Recently, a dramatically different version of LEM (LEM IV) was devised (Elsässer et al 2010, Friedrich et al 2012a, 2012b), where the notion of lethal point-like events was discarded in favor of the analysis of the combined effect of sublethal lesions created within a micrometric domain, rendering it very similar to the mMKM approach. Regarding mMKM, although it yields better results than the earlier LEM versions (Kase et al 2008), it rises the concern, among others, of considering as constant the β coefficient of the LQ model. In face of the issues just described, one can argue that there is room for research in view of developing biophysics models.
The motivation for NanOx was to establish a framework to model cell survival with a mathematical approach as rigorous and sound as possible, consistent with the stochastic nature of radiation down to a nanometric scale. In this sense, starting from concepts of the existing models, such as the notion of local and sublethal events, we resorted to microdosimetry and nanodosimetry to implement a fully statistical methodology. Indeed, the magnitude of fluctuations in energy deposition at micrometric and nanometric scales is not negligible and cannot be disregarded (Cunha et al 2016b). With NanOx, it is also possible to obtain the α and β coefficients of the LQ model, which would allow for the implementation of the model in a TPS. An additional objective of NanOx is to test scenarios and new biophysical quantities that may represent the radioinduced cell death, in line with the progress in knowledge regarding the underlying mechanisms. Regarding local lethal events, such quantities may range from the distributions of ionization cluster size (Grosswendt 2004) and the descriptors of DNA damage (Garty et al 2010), to the thermal spikes generated by high-LET ions (Toulemonde et al 2009) and the consequent shock waves (Surdutovich et al 2013). We propose herein to describe non-local lethal events through the accumulation of oxidative stress at the global scale of the cell. NanOx is the acronym for NANodosimetry and OXydative stress to reflect the range of biophysical parameters both in nature and in spatial scale.
We stress that we will not address the full degree of complexity of NanOx in this manuscript. Instead, in this first presentation of the new framework we limit its scope to outlining the main lines of NanOx and to describing its principles and formalism in a simplified manner. The aim is to render the current publication interesting and accessible to a broader community, thereby allowing for a larger discussion of this new model. Further details will be included in forthcoming publications.
2. Short description of the new model
NanOx is a new theoretical framework to calculate cell survival in the context of particle therapy based on a completely stochastic approach, an unprecedented feature regarding literature. It promotes the computation of cell survival probability in terms of an average over all configurations of cells and radiation impacts (ion tracks or photon interactions described at down to nanometer scale). Figure 1 schematically depicts an example of such a configuration with a set of cells exposed to a radiation impact. The stochasticity of NanOx consists in that all the details of these configurations, namely those pertaining to the characteristics of each radiation impact, are fully taken into account at several scales, as explained in the next sections.
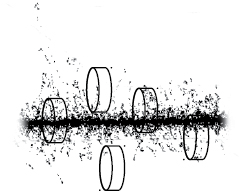
Figure 1. Schematic illustration of a configuration of an irradiation of cells by a given radiation impact. Both the cells and the radiation impacts are described in full detail, accounting for all its characterizing elements, such as cell positions and the complete set of interactions that compose the radiation impact.
Download figure:
Standard image High-resolution imageThe fundamental premise of the new framework is that the probability of cell survival to an irradiation depends on two classes of biological events that take place at different spatial scales: the so-called 'local lethal' and 'non-local lethal' events. In order to model such events, NanOx integrates concepts of nanodosimetry, through a function that describes local lethal events, as well as the cellular oxidative stress, the latter in the form of a chemical specific energy. The modeling of non-local lethal events is relevant since such events are responsible for the typical shoulder in cell survival curves at lower LET values (Beuve et al 2009).
According to a simplification common to many radiobiological models, in the current version of NanOx the possible communications between cells are not described explicitly; this entails that the average cell survival is equivalent to the average survival of a single cell over all configurations of radiation impacts.
2.1. Model definitions
This section introduces the definitions used in NanOx concerning both local and non-local lethal events. Other more general definitions, such as those concerning radiation impacts and the elements composing the geometry of the cell, are also included here and summarized in table 1 along with the corresponding notation.
Table 1. List of the main notations used in NanOx, their name and definition.
| Symbol | Name | Definition |
|---|---|---|
| Vs | Sensitive volume(s) | Region(s) of the cell critical for the evaluation of the radiation effects induced by local and/or non-local lethal events |
 |
Area of influence of the sensitive volume(s) | Area of the volume of influence comprising the radiation impacts that have a non-negligible probability of depositing energy into the sensitive volume(s) |
| i | Local target | Index of any volume that respects the locality condition placed inside the sensitive volume associated with local lethal events |
| N | Set of local targets | Number of local targets, for which N > 1 |
 |
Configuration of the local target i | Set of parameters that describe the local target i, including for instance its geometry, position and rotation |
 |
Configuration of a set of N local targets | Spatial distribution of the N targets, each with an associated configuration  |
| k | Single radiation impact | Index of any set of interactions between the medium and the primary radiation (ion, electron, photon or neutron) and all the secondary particles |
| K | Set of radiation impacts | Number of radiation impacts, for which K > 1 |
 |
Configuration of the radiation impact k | Set of parameters that describe the radiation impact k totally or partially inside the volume of influence, including for instance the spatial distribution of energy-transfer points and the resulting physicochemical events at a given time |
 |
Configuration of a set of K radiation impacts | Spatial distribution of the K radiation impacts, each with an associated configuration  |
| x | Local quantity | Physicochemical quantity inside a local target |
| X | Non-local quantity | Physicochemical quantity inside the cell sensitive volume associated with non-local events |
2.1.1. Definitions relative to radiation impacts.
Radiation impact.
A radiation impact is the set of all the interactions of the primary radiation (ion, electron, photon or neutron) and all the secondary particles with the medium. These interactions result in energy transfer to the medium, which may lead to physicochemical events such as ionizations and excitations.
2.1.2. Definitions relative to the cell geometry.
Sensitive volume.
Critical volume inside the cell to evaluate the effect of radiation. One sensitive volume is associated with local lethal events and another with non-local lethal events.
Volume of influence.
Volume defined around the cell sensitive volumes, encompassing at least all the radiation impacts for which the respective set of interactions with the medium has a non-negligible probability of leading to energy transfer into said sensitive volumes.
2.1.3. Definitions relative to local lethal events.
Local lethal events.
Local lethal events consist of biological events induced by physicochemical processes taking place at a very localized region. These events can, alone, lead to cell death by inducing for instance severe DNA damage, e.g. an unrepaired double strand break (DSB).
Locality condition.
The spatial extension of local lethal events corresponds to a volume inside which the probability that two particle tracks (or more) deposit a significant specific energy can be neglected at clinical doses (i.e. macroscopic dose typically below 10 Gy).
Local target.
Any volume that respects the locality condition, placed inside the sensitive volume associated with local lethal events. The theoretical estimation of such a local scale leads to defining biological targets smaller than approximately 100 nm (i.e. nanometric) (Beuve et al 2009). According to the definition of local lethal events, the inactivation of only one of these local targets is enough to cause cell death.
Local action of radiation.
Throughout this paper, the local action of radiation is represented by the quantity x, which is determined inside the local targets according to the chosen physical or chemical phenomenon taking place in the sequence of cell exposure to a given dose of ionizing radiation. Thereby, it may correspond to e.g. the specific energy, the production of chemical reactive species, or the production of electronic excitations and single or multiple ionizations.
2.1.4. Definitions relative to non-local lethal events.
Non-local lethal events.
Non-local lethal events are complementary to local lethal events, i.e. they are harmful to the cell, but are not able to cause its death on their own. As in microdosimetric models, they may correspond to the interaction between two 'distant' sublethal cellular lesions (i.e. non local) (Hawkins 2003), but they may as well represent sublethal damage like DNA single strand breaks (SSBs) and lesions in different cellular structures (e.g. mitochondria, nuclear and cellular membranes). Non-local lethal events may also correspond to a state of oxidative stress, i.e. an imbalance between the amount of antioxidant defenses and chemical reactive species in the cell. The combination of all these events by an effect of accumulation and/or interaction among each other at the (microscopic) cell scale may result in cell death.
Non-local action of radiation.
The non-local action of radiation is represented by X. The choice for a capital letter is in contrast with that set to denote the local action of radiation in order to highlight that X is considered at a much larger scale than x. Although the same letter was selected to denote the action of radiation at both local and non-local scales, it does not imply that the same quantity is used in both cases; it simply represents the fact that it is possible to choose the quantity to input to NanOx.
Global events.
In this first version of NanOx, we chose to represent non-local lethal events by 'global' events, which describe the accumulation of sublethal events in the associated sensitive volume. The production of chemical reactive species seemed to us of particular interest since they are responsible for inducing a significant part of sublethal damages in the DNA (Ravanat et al 2001, von Sonntag 2006) and are directly involved in cellular oxidative stress.
Chemical specific energy and relative chemical effectiveness.
From the production of reactive chemical species, we can conveniently define a chemical specific energy. For that purpose, we established a concept similar to the RBE, the relative chemical effectiveness (RCE):

where RCEst is the relative chemical effectiveness for a given level st of oxidative stress; Zr and Z are, respectively, the specific energies of the reference radiation and the radiation under consideration that are required to cause such a level of stress in the sensitive volume associated with non-local lethal events (see figure 2). The chemical specific energy  after a configuration of radiation impacts
  is then expressed as:

where  is the specific energy and
  the relative chemical effectiveness in the sensitive volume associated with non-local lethal events after a single radiation impact with configuration
  . All these quantities may be estimated by simulations using the LQD (LiQuiD water radiolysis) Monte Carlo code (Gervais et al 2005, 2006). Consequently, the quantity X representing the non-local action of radiation is set to be equal to
  in the present version of NanOx.
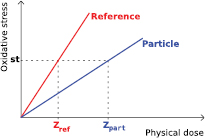
Figure 2. Graph illustrating the dependence of the level of the cellular oxidative stress on the physical dose for both particle and reference radiation. For an equivalent level of oxidative stress st, a higher dose of particle radiation is needed in comparison with the reference radiation, as particle radiation leads to a higher chemical reactive species production, but also to a higher recombination.
Download figure:
Standard image High-resolution image2.1.5. Cell survival versus cell survival to local and to non-local lethal events.
The fundamental premise of NanOx is that the probability of cell survival to an irradiation is characterized by the effect of said irradiation on two sensitive volumes, one associated with local lethal events and another associated with non-local lethal events. Such volumes are a priori different. The probabilities of cell survival to local lethal ( ) and non-local lethal (
 ) events are assumed to be independent. Thus, the probability of cell survival
  to a configuration
  of impacts within a volume of influence is given by the following expression:

2.1.6. Cell survival to local lethal events.
We postulate that a lethal local event corresponds to inactivating a single local target among N identical local targets distributed uniformly in the sensitive volume associated with local lethal events. Furthermore, the inactivation of a local target is directly and only associated with the quantity  in said local target, through the inactivation probability function
  , which means that local target responses are independent. Hence, the probability of cell survival to local lethal events for a given configuration of local targets (
 ) and radiation impacts (
 ) is equal to the probability that no local target is inactivated:
where  is the quantity x in the local target i with configuration
  (i.e. position and orientation) after one radiation impact with configuration
  . Figure 3 shows an example of a radiation impact configuration
  for a 12 MeV u−1 carbon ion in water. The track was simulated using LQD.

Figure 3. Beam-eye view of the configuration of a single impact of a 12 MeV u−1 carbon ion in water. The track was simulated using the LQD Monte Carlo code in a 200 μm thick water medium. The plotted dots correspond to the positions where the primary ion and induced secondary particles interacted with the medium, transferring energy to the medium and leading to ionizations, excitations and electron attachment. The red circle represents a cell sensitive volume at scale.
Download figure:
Standard image High-resolution imageThe average number of local lethal events, determined over the whole set of possible biological responses in the sequence of a given quantity  in a local target i, corresponds to the probability that said local target is inactivated:

We define here a more convenient quantity for the practical implementation of the model, the average effective number of local lethal events (ENLLE) in a local target i:

Given that local lethal events are independent from one another, the average ENLLE in a sensitive volume with N local targets is the sum of the ENLLE in all those local targets:

Equation (7) can then be written as a function of the ENLLE:
Assuming that the number of local targets N is large, each particular configuration  can be disregarded and we can thus simplify the estimate of the ENLLE by averaging it over many configurations of local targets:

Since all local targets are equivalent and homogeneously distributed, we have:

where the effective local lethal function F is:

The expression chosen for F is given in equation (19). Note that N is contained in F and cannot be explicitly determined.
2.1.7. Cell survival to non-local lethal events.
As discussed in section 2.1.4, non-local lethal events are represented by global events. The probability of cell survival to these events is a function of the chemical specific energy  in the sensitive volume associated with non-local lethal events. As expressed in equation (5), such a chemical specific energy is proportional to the density of chemical reactive species produced in water by a given radiation with respect to a reference radiation. In turn, this density is a function of the time TRCE that separates the radiation impact and the observation of the production of the reactive chemical species, since they continuously interact and recombine with each other. TRCE could then be adjusted to obtain a correct description of the dependence of the shoulders in cell survival curves on LET.
The well-known LQ expression was chosen to model the probability of cell survival to global events  as a function of the chemical specific energy
  :
:

where Cnorm is a normalization factor ensuring that the average of cell survival over all irradiation configurations leads to the experimental probability of cell survival to an irradiation with a reference radiation characterized by the coefficients  and
and  of the respective LQ fit. Cnorm,
  and
and  are determined as a function of the
  and
and  coefficients through the convolution of the cell survival for a given configuration of radiation impacts
  with a Gaussian law knowing that: (1) for an irradiation with low-LET photons, the distribution of energy depositions at a microscopic scale corresponding to that of cell dimensions can be modeled by a Gaussian law (Cunha et al 2016b); and (2) the cell survival to a given configuration
  can be determined from the specific energy
  in the sensitive volume, i.e.
  . It is possible to prove that Cnorm can be approximated to 1. In turn, the coefficients
  and
and  are to be determined for each cell line from the probability of cell survival to an irradiation with a reference radiation.
  is set as 0 in this first version of the model, which allows for a separate adjustment of the local and the global events. Regarding
  , it is possible to prove that:

where  corresponds to the β coefficient issued from the LQ fit of cell survival to the reference radiation, and η is defined as:

with  representing the mean specific energy in the sensitive volume of the cell associated with global events and D the macroscopic irradiation dose (for more details on η see section 2.2).
2.1.8. Average and total cell survival.
In order to compare experimental and theoretical results, the cell survival probability to a macroscopic dose D is determined over all radiation impact configurations that deposit such a dose:

2.2. Model settings and parameters
The previous sections describing the model have introduced various parameters, however the estimation of the cell survival probability defined in equation (18) does not entail the adjustment and optimization of all of them. For instance, some can be fixed arbitrarily according to considerations made by the authors. These may be either for simplification purposes, it was the case of  , or to comply with the definitions of the model, such as that of locality and local targets. The remaining are directly or indirectly set based on available experimental data. In particular, the parameters of the effective lethal function and
  are optimized through a fit to experimental data specific to a given cell line. On the other hand, the dimensions of the sensitive volume and TRCE are expected to be less dependent on the cell line, which would allow to set approximated values in the absence of experimental data. Therefore, we can classify the model parameters in function of their dependence on the availability of experimental data specific to the cell line under consideration: not dependent and more or less dependent. Table 2 outlines the parameters of NanOx, the class(es) of events with which they are associated and how they depend on the cell line.
Table 2. Model parameters, the class(es) of events with which they are associated, their description, and their degree of dependence on cell line-specific experimental data (– not dependent; + less dependent; ++ more dependent).
| Class | Name | Description | Cell-line dependence |
|---|---|---|---|
| Local |  |
Sensitive volume associated with local lethal events | + |
| Vt | Local target volume | — | |
| F(...) | Parameters of the effective local lethal function | ++ | |
| Global-subclass of non-local lethal events |  |
Sensitive volume associated with global lethal events | + |
 |
Coefficients of cell response to global events | — | |
 |
++ | ||
| TRCE | Time after the radiation impact at which the production of reactive chemical species is considered | + | |
Besides assigning values to each parameter, the implementation of the model also requires making some more general choices that have implications in one or in both classes of events. It is the case of the reference radiation, which we set herein as low-LET photons, more specifically photons from a 60Co source. Another example is the type and source of the data input to the model as the choice for x and X. More specifically, it was already defined that  in the current version of NanOx (see section 2.1.4). The chemical specific energy is determined from the specific energy inside the sensitive volume, which we obtained by using LQD. This Monte Carlo tool allows the user to store only the energy transferred to the medium that leads to events relevant for the biological effect of radiation (such as ionizations, atomic excitations and attachment of electrons) and discard the energy that simply causes the heating of the medium. The latter is produced by events such as molecular vibrations, the interaction between electrons and water phonons, the geminate recombination (recombination of the electron with the parent cation) or the attachment of electrons to water molecules (Cunha et al 2016b). The consequence of discarding part of the energy is that the specific energy calculated in the cell sensitive volume does not exactly correspond to the definition of this quantity according to the ICRU (ICRU 2011) since we are not accounting for the totality of the imparted energy. This is the reason for the factor η defined in equation (17), which is not a feature of NanOx but rather connected to the Monte Carlo code used for the calculations of specific energy. In the case of the LQD, η is approximately 80%. To be accurate, we would have to use another term to designate this quantity, for instance, restricted specific energy. However, for the sake of simplicity, we will continue to use just specific energy.
3. Application to V79 cells
3.1. Experimental data
We chose V79 cells (lung fibroblasts from Chinese hamsters) for a first application of the model due to the large amount of data available in the literature. α values extracted from experimentally determined cell survival curves of V79 cells were gathered from the database made available by the PIDE project (Friedrich et al 2012b). Given the high level of variability that characterizes these data, values considered to be representative of the experimental data were chosen for photons and monoenergetic beams of different ions (protons, helium, carbon, neon, and argon ions) and used to optimize the function F. Figure 4 shows both the experimental data pool (open symbols) and the 16 selected data points (full symbols) relative to these radiation qualities.
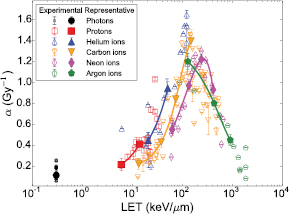
Figure 4. Values of α coefficients from cell survival curves of V79 cells. The empty symbols correspond to values extracted from the PIDE project database (Friedrich et al 2012b) and the full symbols to those chosen as representative of the experimental data. For photons, the single point shown matches the α coefficient reported in Tilly et al (1999), i.e. 0.112 Gy−1, for an LET of 0.3 keV μm−1.
Download figure:
Standard image High-resolution imageIn a second stage, experimental data regarding cell survival to photons, protons and carbon ions for a wide range of LET values were collected from the literature and compared with model predictions. Having tested the ability of NanOx to predict the α coefficients in the previous steps, one of the goals of the calculation of cell survival was to evaluate the β coefficient and its dependence on LET. Considering the strong interplay between the α and β coefficients, the representative β coefficients were defined as the ones of the cell survival curves for which the reported α coefficients were close to the representative ones, thereby reducing the impact of the value of α on the evaluation of the performance of NanOx in describing β.
3.2. Parameter values
Table 3 lists the values assigned to each of the parameters for an application of NanOx to the V79 cell line.
Table 3. Model parameters, the class of events with which they are associated, the respective value for an application of the model to the V79 cell line, and their degree of dependence on cell line-specific experimental data (–not dependent; + less dependent; ++ more dependent). The cell sensitive volumes associated with local and global lethal events were considered to be the same.
| Class | Name | Value | Cell-line dependence |
|---|---|---|---|
| Local and global | Ls | 1 μm | + |
| ds | 9.78 μm | + | |
| Local | Lt | 10 nm | — |
| dt | 20 nm | — | |
 |
20 200 Gy | ++ | |
| 6000 Gy | ++ | ||
| 180 000 | ++ | ||
| Global(subclass of non-local lethal events) |  |
0 Gy−1 | — |
 |
0.0466 Gy−2 | ++ | |
| TRCE | 10−11 s | + | |
3.2.1. Sensitive volume.
In this first version of NanOx the sensitive volumes associated with local and non-local lethal events are assumed to correspond to the same volume. The sensitive volume dimensions were then set to correspond to the nucleus dimensions of a V79 cell reported in Scholz and Kraft (1996), i.e. a cylinder with length  m and diameter
  m, yielding a geometrical cross section
  of 75 μm−2.
3.2.2. Local targets.
The size of the local targets is instead arbitrarily defined, provided that it meets the requirements discussed in section 2.1.3 regarding the concept of locality; we opted to match approximately the extension of a DNA DSB taking the diffusion of reactive species also into account. A DSB may extend up to over 20 base pairs or 6 nm (Elsässer and Scholz 2007, Beuve et al 2009, Schipler and Iliakis 2013) while the reactive species can cause damage up to 4 nm away from the hit site (Nikjoo et al 1997, Elsässer and Scholz 2007). For simplicity reasons, both the sensitive volume and the local targets were oriented according to the direction of the incident radiation.
The quantity x considered inside these local targets was chosen as the specific energy z deposited therein. As discussed in section 2.2, since we chose in LQD to discard the energy transfers that simply caused the heating of the medium, this z actually corresponds to the restricted specific energy in local targets.
3.2.3. Effective local lethal function.
F was built assuming it increases monotonically with the specific energy in local targets. The outcome of the construction procedure, for which the details are outside the scope of this paper, was close to an error function:

Still another method was implemented, this time for the optimization of F. Again, the details are not described herein, but essentially it consisted in deriving coefficients related to local lethal events from the representative data in order to constrain F and optimize its parameters. A threshold value z0 of 20 200 Gy, a σ of 6000 Gy and a function maximum h of 180 000 were obtained.
3.2.4. Global events parameters.
Both  and
and  coefficients can be derived from measurements of the response of V79 cells to the reference radiation. The coefficient
  was, however, simplified and set to zero in order to achieve a separate handling with respect to the local lethal events.
  was found to be equal to 0.0466 Gy−2 from the
  of 0.0298 Gy−2 reported in Tilly et al (1999). Regarding the production of reactive chemical species, we chose to use the hydroxyl radical (
 OH), one of the most effective reactive species in causing cell damage (Pouget and Mather 2001). TRCE was set as 10−11 s to roughly characterize the production of primary chemical reactive species (Kreipl et al 2009).
4. Results
Figure 5 shows a comparison of the α values obtained by the model and a pool of experimental data for protons (left) and carbon ions (right). NanOx follows the trend of the experimental values. This is particularly visible in the case of carbon ions, where the model reproduces the increase in α values in function of the LET up to approximately 155 keV μm−1, followed by the decrease for higher LET values.
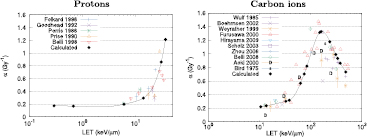
Figure 5. Comparison of α values from the literature (Friedrich et al 2012b) and from cell survival curves obtained with the model (full circles) for protons (Perris et al 1986, Prise et al 1990, Goodhead et al 1992, Folkard et al 1996, Belli et al 1998) (left) and carbon ions (Bird and Burki 1975, Wulf et al 1985, Weyrather et al 1999, Aoki et al 2000, Furusawa et al 2000, Böhrnsen et al 2002, Scholz 2003, Zhou et al 2006, Belli et al 2008, Hirayama et al 2009) (right). The solid lines are for visual guidance purposes only.
Download figure:
Standard image High-resolution imageFigure 6 shows the comparison between cell survival curves determined experimentally after irradiations with protons (left) and carbon ions (right), and the corresponding curves obtained using the model for V79 cells. Photon data are included in both cases. We can observe that there is an overall good agreement between NanOx predictions and experimental data, including the dependence of the shoulder on LET. In the case of protons, the worst agreement is verified for 0.76 MeV, the highest-LET proton. For carbon ions, cell survival becomes increasingly underestimated for the lowest-LET ion, 266.4 MeV u−1, and overestimated for that with the highest LET, carbon ion 3.4 MeV u−1.
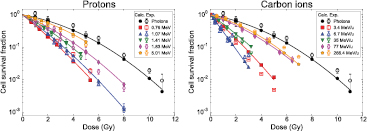
Figure 6. Comparison of cell survival curves determined experimentally (open markers) and using the model (full markers) for V79 cells irradiated with photons (both figures), protons (left), and carbon ions (right). The solid lines represent a fit of the calculated data points with an LQ expression. Data for photons (Tilly et al 1999). Data for 0.76, 1.41 and 5.01 MeV protons (Belli et al 1998), and 1.07 and 1.83 MeV protons (Folkard et al 1996). Data for 3.4 MeV u−1 carbon ions (Furusawa et al 2000), 6.7 MeV u−1 carbon ions (Belli et al 2008), 35 MeV u−1 carbon ions (Aoki et al 2000), and 77 and 266.4 MeV u−1 carbon ions (Weyrather et al 1999).
Download figure:
Standard image High-resolution image5. Discussion
NanOx predictions concerning the V79 cell line, both in terms of α values and cell survival curves, show an overall good agreement with experimental data for a wide range of LET values. The experimental data regarding photons are also well reproduced, which demonstrates the consistency of the model. The wealth of experimental data available for V79 cells allowed us not only to validate the basic principles of NanOx but also its first results, which are very promising specially for a first version of the model.
5.1. Predicted cell survival and LQ coefficients for V79 cells
In particular, the reproduction of the evolution of α values shows the capability of the model to describe the effectiveness of radiation in function of the LET, including the overkill phenomenon of carbon ions. Regarding protons, one may also wonder about such an overkill effect and about whether NanOx is able to reproduce it. Among the literature that reports experimental α coefficients relative to V79 cells for protons, there is only one data set (Belli et al 1998) indicating a decrease in α values above 30 keV μm−1. This, allied to the fact that the proton range is very short in this LET region, led us to disregard experimental proton data in this LET region when setting the representative data points. It could probably be possible to make the model describe these data, however whether α values actually decrease for protons is debatable. More and reliable data would be necessary to confirm this scenario. Overall, the most remarkable regarding these results is how NanOx can reproduce α over a large range of LET values (from less than 10 keV μm−1 to 1000 keV μm−1) and for ions as different as protons and carbon ions with a function describing local lethal events that relies only on three fitted parameters.
In terms of cell survival curves, the model reproduces the dependence of the shoulder on LET rather well and thus the β coefficient. This was possible due to the introduction of a chemical specific energy based on the cellular level of oxidative stress and represented by the  OH production, which allowed to describe how the role of non-local lethal events changes with LET. As pointed out before, β is less well described in some cases. This is likely due to the value of
  used as input, which may strongly vary from one set of experimental data to another (Friedrich et al 2012b). Therefore, the
  coefficient from a given data set may not be the most suitable for all the ions considered. The discrepancies in cell survival data may also be due to differences in the α values. In any case, considering the typical uncertainties on experimental α values and the variability on cell survival data, which may amount up to 50%, we can conclude that the predictions yielded by NanOx are in overall good agreement with the experimental survival curves. Therefore, we can state that, even if it is not possible to establish a straightforward connection between the LQ model coefficients and the parameters characterizing the new model, NanOx is able to predict such coefficients with enough accuracy for clinical purposes thereby demonstrating the potential to be integrated into TPSs in the context of particle therapy. This is supported by the comparison of the calculated α coefficients with NanOx to the experimental data, as shown in figure 5, but also to the predictions by the models that are currently used in clinical practice, MKM and LEM. This is what can be observed in figure 7 for carbon ions. NanOx compares better to MKM, which overall performs better than any of the three versions of LEM at reproducing the experimental data. These are very encouraging results and show the potential of this new framework.

Figure 7. Comparison of the pool of experimental α values of V79 cells for carbon ions with those predicted by MKM, the three earlier versions of LEM, and NanOx. The solid red line connecting the red triangles is for visualization purposes only, it does not represent actual calculations. The data relative to LEM and MKM were extracted from Russo and Peroni (2011).
Download figure:
Standard image High-resolution image
5.2. Dependence of the model parameters on experimental data
As already stated, the good results obtained with this first version suggest that the principles upon which NanOx is built are solid and coherent. It is therefore important to continue the development of the model and explore its possibilities. Of particular interest is the analysis of the values assigned to the model parameters and their impact on the outcome. Although such an assessment requires a systematic and thorough study, we can speculate about their sensitivity to cell-line-specific data.
In section 2.2, we have mentioned that some parameters are expected to be more dependent on experimental data relative to the cell line under consideration while others can be arbitrarily fixed. It was the case of  that was set to zero for simplification reasons. In the same way, the dimensions of the local targets were defined to comprise the extension of DSBs and the diffusion of chemical radical species, but as long as the conditions of locality are fulfilled, other dimensions could be used. For instance, the dimensions of larger, more complex structures DNA structures, such as nucleosomes or chromatin fibers would also be suitable.
The remaining parameters were directly or indirectly estimated from experimental data.  was obtained from the
  coefficient of the cell survival to a reference radiation, which in turn was fitted to experimental measurements. As already mentioned,
  may significantly vary from one data set to another. Indeed, the level of variability in β coefficients is even greater than that in α values (Friedrich et al 2012b). Therefore, the estimation of
  greatly relies on the availability of experimental data and it is sensitive to the selected data set. The parameters of F, three for V79 cells, were optimized in the present study using 16 representative α values. Also in this case, experimental data are required to perform the fit and the value and even the number of parameters is expected to be susceptible to the specific set of input data used. Therefore, F and its parameters are intrinsically dependent on the experimental α values of the cell line under consideration.
Finally, TRCE and the sensitive volume dimensions were set based on values reported in the literature. The time for observation of the reactive chemical species production after the radiation impact was set as 10−11 s since it is assumed that at this point the primary chemical species are already produced. Then, chemical interaction and diffusion processes follow with the consequent modification of the chemical species distribution (and thus the chemical specific energy) due to their recombination. In a biological complex system, it is not clear when the chemical development of the track stops but dedicated simulation tools consider the range between 10−12 and 10−6 s (Gervais et al 2005, Kreipl et al 2009). In his work, Gauduel states the importance of the knowledge about the early (up to 10−10 s) short-lived radical processes involved in radiation-induced cell damage (Gauduel 2011). This means that another value corresponding to such events could be set instead. Moreover, the uncertainties in the calculated production of chemical radical species due to the scarcity of experimental data to benchmark simulations should not be disregarded. The dimensions of the sensitive volume were chosen as those of the cell nucleus size reported in Scholz and Kraft (1996), but there is a plethora of values reported in the literature (e.g. Datta et al (1976), Wulf et al (1985) and Maeda et al (2008)) that would as well be valid. We can even argue that, if no value can be found in the literature pertaining to the dimensions of the sensitive volume of a given cell, line it is always possible to employ a value from a different cell line. Indeed, it is our conviction that the dimensions of cellular structures like the nucleus should not vary significantly from one cell line to another. Alternatively, we could consider an 'effective size', in which only the DNA content of the nucleus is taken into account (Scholz and Kraft 1996, Hawkins 2003). As a consequence, both TRCE and the dimensions of the sensitive volume can be regarded as less dependent on the cell line and less sensitive to the assigned value as well. In any case, as stated before, only through systematic studies we will be able to infer about their impact on the outcome and even to clarify if they can be fixed regardless of the cell line.
5.3. Further developments
Besides the aforementioned assessment of the impact of the values assigned to the model parameters on the outcome, other studies may also be envisaged. Still regarding the parameters, we could for instance introduce two distinct and separated cell sensitive regions to each class of events and make use of a different reactive chemical species in the determination of the chemical specific energy.
More generally, NanOx was initially developed as a flexible framework aimed at testing new ideas. It assumes that the probability of cell survival is the result of cell response to local and non-local lethal events resulting from an irradiation, each described by physical or chemical events at different spatial scales. The model makes no assumptions about the underlying mechanisms, e.g. repair mechanisms or accumulation of reactive chemical species. Introducing assumptions on these mechanisms could be envisaged in future developments, for instance, including the description of dose-rate effects. In addition, NanOx gives the possibility to evaluate other physicochemical quantities to input into the model. In particular, a quantity other than the specific energy could be chosen to represent the local quantity x. Examples are the already mentioned electronic excitations and single or multiple ionizations (section 2.1.3). Experimental data pertaining to cellular DNA damage could be even more interesting since it is closely connected to cell survival at therapeutic doses.
All the studies and possible developments aforementioned will not be limited to V79 cells, but rather to a broad set of cell lines, including human cells. More specifically, the next step will be to apply NanOx to human salivary gland (HSG) tumor cells. The goal is to test how NanOx performs with other cell lines and verify whether the conclusions drawn for V79 cells apply also to other types of cells.
6. Conclusions
This paper presents the predictions of cell survival and values of the LQ α coefficient for V79 cells obtained with a new theoretical framework, NanOx. This new model accounts for the fluctuations in dose deposition at multiple scales, an unprecedented feature in equivalent approaches. By decoupling the probability of cell survival to an irradiation in terms of a component related to local lethal events, and another to non-local lethal events, the new formalism includes concepts of both nanodosimetry and oxidative stress. This peculiarity and the incorporation of a solid statistical framework, allows to achieve theoretical predictions that are in general good agreement with experimental data of V79 cells irradiated with protons and carbon ions. This implies that NanOx is able to determine the α and β parameters accurately through a suitable number of parameters for the clinical environment, showing its potential for application in treatment planning in the context of particle therapy. The reproduction of α entails a correct description of the overkill effect, while that of β ensures a satisfactory description of the dependence of the shoulder on LET due to the inclusion of non-local lethal events. Even though this is the first version of NanOx, the results presented herein are very encouraging, hence we will continue its development, namely by challenging its predictions for other cell lines. The rigorous mathematical formulation of NanOx means that it may have a vast field of application and that it can be extended to other innovative radiotherapy treatments, e.g photoactivation of nanoparticles or neutron capture therapy.
Acknowledgments
This work was performed within the framework of the LABEX PRIMES (ANR-11-LABX- 0063) of Université de Lyon, within the program 'Investissements d'Avenir' (ANR-11-IDEX- 0007) operated by the French National Research Agency (ANR). We acknowledge the financial support by ITMO Cancer in the framework of Plan Cancer 2009–2013 and of the project no. PC201312, designated 'Domaine de la physique, des mathématiques ou des sciences de l'ingénieur appliqués au Cancer'.