

Abstract
Osteoporosis, characterized by reduced bone mineral density and micro-architectural degeneration, significantly enhances fracture-risk. There are several viable methods for trabecular bone micro-imaging, which widely vary in terms of technology, reconstruction principle, spatial resolution, and acquisition time. We have performed an excised cadaveric bone specimen study to evaluate different computed tomography (CT)-imaging modalities for trabecular bone micro-structural analysis. Excised cadaveric bone specimens from the distal radius were scanned using micro-CT and four in vivo CT imaging modalities: high-resolution peripheral quantitative computed tomography (HR-pQCT), dental cone beam CT (CBCT), whole-body multi-row detector CT (MDCT), and extremity CBCT. A new algorithm was developed to optimize soft thresholding parameters for individual in vivo CT modalities for computing quantitative bone volume fraction maps. Finally, agreement of trabecular bone micro-structural measures, derived from different in vivo CT imaging, with reference measures from micro-CT imaging was examined. Observed values of most trabecular measures, including trabecular bone volume, network area, transverse and plate-rod micro-structure, thickness, and spacing, for in vivo CT modalities were higher than their micro-CT-based reference values. In general, HR-pQCT-based trabecular bone measures were closer to their reference values as compared to other in vivo CT modalities. Despite large differences in observed values of measures among modalities, high linear correlation (r ε [0.94 0.99]) was found between micro-CT and in vivo CT-derived measures of trabecular bone volume, transverse and plate micro-structural volume, and network area. All HR-pQCT-derived trabecular measures, except the erosion index, showed high correlation (r ε [0.91 0.99]). The plate-width measure showed a higher correlation (r ε [0.72 0.91]) among in vivo and micro-CT modalities than its counterpart binary plate-rod characterization-based measure erosion index (r ε [0.65 0.81]). Although a strong correlation was observed between micro-structural measures from in vivo and micro-CT imaging, large shifts in their values for in vivo modalities warrant proper scanner calibration prior to adopting in multi-site and longitudinal studies.
Export citation and abstract BibTeX RIS
1. Introduction
Osteoporosis is a bone disease characterized by reduced bone mineral density (BMD), degenerated bone micro-structure, and enhanced fracture-risk (Riggs et al 2012, Black and Rosen 2016, Sözen et al 2017). Although osteoporosis is a disease across all ages and both genders, its prevalence grows with aging (The World Health Organization Bulletin 1999). As estimated in 2010, 10.2 million adults over the age of 50 had osteoporosis in the United States alone (Wright et al 2014). Nearly, one in two women and one in four men suffer one or more fragility fractures in their lifetime (Melton 1988, National Osteoporosis Foundation 2017). Osteoporotic fractures commonly occur at hip, forearm, spine, pelvis, distal femur, wrist, and humerus among which hip fractures are clinically most devastating. During the period of 2000–2011, 2.6 million post-menopausal women were hospitalized in the United States due to osteoporotic hip fracture (Singer et al 2015).
Osteoporosis mostly remains non-symptomatic until a fracture occurs, often due to already advanced disease stage with porous and weaker bone. Early and accurate diagnosis of osteoporosis is critical to alleviate fracture-risk, and bone imaging plays an important role in assessing bone quality for improved diagnosis and care of osteoporotic patients (Kazakia and Majumdar 2006, Adams 2013).
Dual-energy x-ray absorptiometry (DXA) computed BMD is clinically used to characterize osteoporosis. It has been shown that BMD explains 60%–70% of the variability in bone strength and fracture-risk, and the remaining variability comes from the collective effect of other factors such as cortical and trabecular bone distribution, and their micro-structural basis (Wehrli et al 2002, Seeman and Delmas 2006). Roles of trabecular bone micro-structure in determining bone strength and fracture-risk have been convincingly established in histologic studies (Parfitt et al 1983, Kleerekoper et al 1985, Moore et al 1992, Legrand et al 2000, 2007, Chappard et al 2007, Sornay‐Rendu et al 2017, Litwic et al 2020).
Based on a post-menopausal study (Moore et al 1992), women with vertebral fractures were found to be associated with loss of individual trabecular elements and increased trabecular spacing leading to a significant decrease in trabecular bone volume. Reduced trabecular volumetric density and number and increased trabecular separation was found to be highly associated with fracture-risk in a histologic study among women (n = 3912) (Litwic et al 2020). Another study (Sornay‐Rendu et al 2017) found that post-menopausal women who suffered osteoporotic fractures had significantly lower trabecular bone volumetric density and number as well as cortical bone area and thickness as compared with control women.
Significant differences in trabecular bone micro-structural measures between fracture and non-fracture groups were observed in a histologic study among osteoporotic men, while the differences in age and body mass index (BMI) between the groups were non-significant (Legrand et al 2000); differences in BMD between the groups were non-significant by study design. In another study (Legrand et al 2007) involving men with low BMD (T-score <−2.5) and different risk factors including age, BMI, alcohol intake, corticosteroid therapy, hypogonadism, and chronic diseases, it was observed that men with three or more risk factors had low trabecular bone volume, cortical bone thickness, and a marked disorganization of the trabecular network.
Trabecular bone can be seen as a collection of structures that are usually referred to as 'rods' and 'plates'. Also, trabecular bone mostly consists of 'longitudinal' and 'transverse' structures. Longitudinal trabeculae run parallel to the main loading axis, and transverse structures are perpendicular to that axis. Most trabecular plates are longitudinal, and transverse trabeculae are mostly rods (Liu et al 2009). There is histological evidence confirming relationships between the gradual conversion of trabecular plates into rods and increased fracture-risk (Parfitt et al 1983, Kleerekoper et al 1985, Chappard et al 2007). In a post-menopausal study (Kleerekoper et al 1985), women with vertebral fractures had significantly lower trabecular plate density than BMD-matched controls without fracture. In a histologic study (Parfitt et al 1983), age-related trabecular bone loss was noted to be primarily due to reduced plate density, and a further reduction in plate density was observed among patients with osteoporotic vertebral fractures. Trabecular plate thinning and perforation were detected among males with corticosteroid-induced osteoporosis (Chappard et al 2007). Loss of transverse trabeculae was noticed to be associated with a marked reduction in bone strength leading to failure due to buckling of longitudinal trabeculae (Silva and Gibson 1997).
In the last two decades, there has been remarkable progress in high-resolution imaging and analytic technologies enabling in vivo assessment of trabecular bone micro-structure (Link 2012). State-of-the-art imaging modalities for trabecular bone micro-structural assessment include magnetic resonance imaging (MRI) (Majumdar et al 1996, Wehrli et al 2002, Majumdar 2002), high-resolution peripheral quantitative computed tomography (HR-pQCT) (Boutroy et al 2005, Burghardt et al 2010, Whittier et al 2020), extremity cone beam CT (CBCT) (Gupta et al 2008, Subramanian et al 2019), and whole-body multi-row detector CT (MDCT) (Chen et al 2018). Also, dental CBCT has been applied to assess bone density and micro-structure of mandibular bone and dental implants (Ibrahim et al 2014, Parsa et al 2015). A 10 year follow-up study (Sundh et al 2017) has demonstrated that radiographic assessment of mandibular trabeculation as 'dense', 'mixed', or 'sparse' had a substantial additive effect to the fracture risk assessment tool (FRAX) score without BMD measurements in predicting major osteoporotic fractures. CT-based methods are relatively easy to apply and calibrate for data uniformity for multi-site studies, and also provide quantitative BMD measures (Link 2012).
However, major challenges with CT-based methods of measuring trabecular bone micro-structure emerge from wide variability in their noise and spatial resolution characteristics. Therefore, there is a need to evaluate the performance of different CT-based methods of measuring trabecular bone micro-structure and understand their relationships with micro-CT-based reference values. In this paper, we evaluate the performance of different in vivo CT modalities in measuring various trabecular bone micro-structural features, especially those related to trabecular plate/rod and longitudinal/transverse distributions. Specifically, an excised cadaveric bone specimen study and its results are presented evaluating four in vivo CT imaging modalities, including: HR-pQCT, dental CBCT, whole-body MDCT, and extremity CBCT, which are compared to the reference micro-CT imaging at 8.67 μm isotropic voxel size. Also, we introduce a generalized method of computing modality-specific parameters for generating bone volume fraction (BVF) images from CT scans by maximizing trabecular micro-structural agreement between micro-CT and the target CT modality.
2. Methodology
To evaluate the performance of different in vivo CT-based modalities for measuring trabecular bone micro-structure, we compared the performance of four in vivo CT modalities: HR-pQCT, dental CBCT, whole body MDCT, and extremity CBCT. Excised cadaveric bone specimens from distal radius were used for these experiments, and trabecular bone measures derived from micro-CT imaging were considered as reference. In this study, we primarily focus on CT-modality-specific effects on trabecular bone micro-structural measures related to trabecular plate/rod and longitudinal/transverse distributions.
2.1. Cadaveric specimens
We used 14 excised cadaveric human radii bone specimens, donated to medical research at the University of California, San Francisco in accordance with the ethical guidelines regulating such donations (Klintström et al 2018). The specimens were defatted chemically and then stored in water at normal room temperature to ensure long-term scanning reproducibility (Klintström et al 2016). Each specimen is approximately cubic, with at least one side containing some cortical bone. The side lengths are 12–15 mm. See figure 1 for an example. For all modalities, except micro-CT imaging, specimens were surrounded with resin that mimics fat and soft tissue. For all scans including micro-CT, specimens were placed in test tubes filled with water.

Figure 1. An example of cadaveric bone specimen and acquired CT scans. (a) A photographic representation of a distal radius bone specimen. (b) A 3D volume rendition of micro-CT scan of the same specimen. (c)–(g) Volume renditions of matching VOIs from registered images acquired using different scanners: (c) micro-CT, (d) HR-pQCT, (e) dental CBCT, (f) whole body MDCT, and (g) extremity CBCT.
Download figure:
Standard image High-resolution image2.2. Micro-CT imaging
Each specimen was scanned in a SkyScan1176 micro-CT (SkyScan, Kontich, Belgium) scanner. The following micro-CT scan parameters were used—tube voltage 65 kV, tube current 385 µA, 1 mm Al filter for beam hardening, 30 × 23 mm2 field of view, 0.3° rotation step, 1100 ms per projection, total scan time per specimen 2 h. This scanner had a true resolution of 100 lp mm−1 = 5 µm at 10% modulation transfer function (MTF); all scans were reconstructed at 8.67 µm isotropic voxel size using filtered back-projection with Hamming filter, and the observed contrast-to-noise ratio (CNR) was 24.12 ± 3.68 (mean ± std.). Intensity values were acquired as an uncalibrated linear attenuation coefficient over the range of [0 65,535].
2.3. HR-pQCT imaging
HR-pQCT images were acquired in an XtremeCT (Scanco Medical AG, Brüttisellen, Switzerland) scanner. The following scan parameters were used: tube voltage 60 kVp, tube current 0.9 mA, field of view 126 × 126 mm2, imaging time 336 s. Acquired images were associated with the following properties—voxel size: 82 µm isotropic, true resolution at 10% MTF: 5 lp mm−1 = 100 µm, CNR: 4.07 ± 0.53, and CT dose index (CTDI): 5.5 mGy. HR-pQCT intensity values were acquired in the unit of mg HA; mineral density in the unit of mg/cc is obtained by adding 1000 to mg HA values.
2.4. CBCT imaging
Two different CBCT scanners were used in this study.
2.4.1. 3D Accuitomo 80 (J. Morita MFG., Kyoto, Japan)
A dental CBCT device. The following CBCT parameters were used for all scans on this device: tube voltage 85 kV, tube current 5 mA, field of view 40 × 40 mm2, exposure time 17 s. Images were associated with the following properties—voxel size: 80 µm isotropic, true resolution at 10% MTF: 2 lp mm−1 = 250 µm, CNR: 7.37 ± 1.26, CTDI: 4.9 mGy.
2.4.2. Verity (Planmed, Helsinki, Finland)
An extremity CBCT device. For all scans on this device, the following parameters were used: tube voltage 90 kVp, tube current 12 mA, Sharp Light filter, field of view 160 × 160 mm2, exposure time 6 s. Images were initially reconstructed at 250 µm isotropic voxel size. The reconstructed images were later resampled at 125 µm isotropic voxel size using a cubic B-spline filter implemented in the MatLab software; other image properties were as follows—true resolution at 10% MTF: 1.25 lp mm−1 = 400 µm, CNR: 4.53 ± 0.59, CTDI: 5.4 mGy.
For extremity CBCT scanner, the Feldkamp, Davis, and Kress (FDK) image reconstruction algorithm (Feldkamp et al 1984) was used, and for the dental CBCT scanner, a proprietary version of the FDK algorithm was applied. For both CBCT scanners, image intensity values were acquired in gray values similar to the Hounsfield unit (HU).
2.5. MDCT imaging
A Siemens SOMATOM Force (Siemens AG, Erlangen, Germany) scanner was used, with the following parameters: tube voltage 120 kVp, tube current 62 mA, filter type WEDGE_2, field of view 500 × 500 mm2, slice thickness 400 µm, spacing between slices 200 µm, rotation time: 1 s, pitch 0.8. Axial MDCT images were reconstructed using an ultra-sharp kernel UR69u and advanced modeled iterative reconstruction (Admire) setting of 3. The reconstructed field of view was 50 × 50 mm2 with a 98 × 98 µm2 in-plane pixel size and a slice thickness of 400 µm. Different image properties were as follows—true resolution at 10% MTF: 2.48 lp mm−1 = 202 µm (in-plane) and 2.1 lp mm−1 = 238 µm (z-direction) (Chen et al 2018), CNR: 4.91 ± 0.82, CTDI: 8.5 mGy. Image intensity values were acquired in HU.
2.6. Image processing and computation of trabecular bone micro-structural measures
Three major image processing steps were applied―(1) registration of HR-pQCT, CBCT, and MDCT images to corresponding micro-CT data, (2) optimization of soft-threshold parameters for individual modalities to convert raw scan data into BVF images, and (3) computation of different trabecular bone micro-structural measures. These steps are briefly described in the following.
2.6.1. Image registration
The images from different in vivo CT scanners, i.e. an HR-pQCT, two CBCT, and an MDCT scanner, were manually registered to matching micro-CT images in a two-step process implemented in MeVisLab (MeVis Medical Solutions AG, Bremen, Germany) using the Registration Manual module (Heckel et al 2009). In the first step, three-dimensional (3D) rigid transformation was used for rough registration of the whole specimen using its cortical bone. The registration transformation matrix was applied to the physical image space, which accounted for voxel size differences in different modalities. During the second step, registration results were fine-tuned by manually matching trabecular micro-structures through the MeVisLab toolkit. The resulting volumes can be seen in figure 1 and matching slices in figure 2. Registered images were cropped over a common volume of interest (VOI) of size approximately 7.8 × 8.9 × 8.8 mm3, which were used for all subsequent analysis.

Figure 2. Trabecular bone micro-structure on matching slices from post-registered images using different CT scans of a cadaveric distal radius specimen. (a, b) Raw and BVF image slice pairs from micro-CT imaging. (c)–(j) Same as (a, b) but using other CT modalities: (c, d) HR-pQCT, (e, f) dental CBCT, (g, h) whole body MDCT, and (i, j) extremity CBCT.
Download figure:
Standard image High-resolution image2.6.2. Computation of BVF maps
A truncated function is modeled to convert CT numbers to BVF values, which is characterized by a lower and upper threshold values; BVF is 0 below the lower threshold, 1 above the upper threshold, and is a linear function in between. Here, a new BVF computation algorithm is presented that optimizes the lower and upper thresholds  and
and  for each in vivo CT modality, while maximizing overlaps of both bone and non-bone micro-structures in the reference micro-CT and the matching target CT scans. The optimization method is defined in the following.
Let  denote the image space and
  denote the reference voxel-wise BVF map for a given specimen
  derived from its micro-CT scan; a quantitative BVF map was computed from micro-CT scans using manually selected soft-threshold parameters and connectivity analysis to eliminate isolated noisy components. Specifically, the lower and upper thresholds values of micro-CT images were selected by two mutually blinded observers for all micro-CT images, and the average values of lower and upper thresholds were used to compute BVF maps from micro-CT images. The lower threshold value was selected as the intensity threshold that does not miss any bone micro-structure, while the upper threshold value was selected as the intensity threshold that does not include any noise.
Let  denote the voxel-wise BVF map for the same specimen
  derived from its scan using the target CT modality and soft-threshold parameters
  . Voxel-wise agreement and disagreement functions
  and
and  , respectively, are defined as follows:


where  represents the global agreement in the volume of core bone micro-structure derived from micro-CT scans of all specimens and that derived from all specimen scans using the target modality and the soft-threshold parameters
  . Specifically,
  is computed as follows:
in the above equation, the function  returns the maximum value of '1' when the numerator and denominator are equal and lower values when they are different; in other words,
  returns the value of '1' when the total volume of core bone (summed over all specimens) in the reference data and that in the target data match, and lower values when these volumes are different. Further, it may be noted that, in equations (1) and (2),
  captures both voxel-wise true positive, i.e. the term
  , and true negative or the term
  . In other words,
  represents a weighted measure of voxel-wise accuracy of soft-thresholding, where
  and
and  represent the true and computed BVF values, respectively. Similarly,
  is formulated to capture the voxel-wise weighted disagreement of
  with
with  . An accuracy function of soft-threshold parameters
  is defined as follows:

Finally, the soft-threshold parameters ( ) are determined at the global maximum of the accuracy map. Figure 3 illustrates the optimum parameter selection method and the surface plot of the accuracy function at different soft-thresholding parameters.

Figure 3. Optimization of soft-thresholding parameters for BVF computation. (a) and (b) Down-sampled micro-CT image (a) and its BVF map (b) computed using manually selected threshold parameters. (c) and (d) Matching image slice from the HR-pQCT scan (c) of the same specimen and corresponding BVF map (d) using the optimum threshold parameters. (e) and (f) Computed BVF maps using two non-optimum threshold parameters. (g) Computed accuracy surface plot at different combinations of soft-thresholding parameters  . Note that the accuracy value is non-existent for parameters
  , which creates a sharp fall of the accuracy surface along the diagonal line
  .
.
Download figure:
Standard image High-resolution image2.6.3. Computation of bone micro-structural measures
Trabecular bone measures examined in this paper are listed in table 1. Each CT image was processed through the following image-processing steps to compute different trabecular bone measures―(1) conversion of CT numbers into BVF values using the optimum threshold parameters derived from the new threshold optimization algorithm and computation of overall BVF (Tb.BVF) measure; (2) fuzzy skeletonization (Saha et al
2018) and computation of trabecular network area density (Tb.NA) measure; (3) volumetric topological analysis (VTA) (Saha et al
2010) and computation of mean plate-width ( ) and plate BVF (Tb.pBVF) measures; (4) tensor scale analysis (Saha et al
2015) and computation of transverse BVF (Tb.tBVF) measure, (5) digital topological analysis (DTA) (Saha and Chaudhuri 1994, 1996, Saha et al
2000) of fuzzy skeleton and computation of erosion index (Tb.EI) measure; (6) star-line analysis for computation of trabecular thickness (
) and plate BVF (Tb.pBVF) measures; (4) tensor scale analysis (Saha et al
2015) and computation of transverse BVF (Tb.tBVF) measure, (5) digital topological analysis (DTA) (Saha and Chaudhuri 1994, 1996, Saha et al
2000) of fuzzy skeleton and computation of erosion index (Tb.EI) measure; (6) star-line analysis for computation of trabecular thickness ( ) and trabecular spacing (
 ) measures (Liu et al
2014). To avoid edge artifacts, image VOIs were padded with full-bone planes before applying fuzzy skeletonization, VTA, tensor scale, DTA, and star-line analysis. For computation of the three BVF measures Tb.BVF, Tb.pBVF, and Tb.tBVF, total volume (TV) was defined as the number of voxels within the VOI inside the image space
) measures (Liu et al
2014). To avoid edge artifacts, image VOIs were padded with full-bone planes before applying fuzzy skeletonization, VTA, tensor scale, DTA, and star-line analysis. For computation of the three BVF measures Tb.BVF, Tb.pBVF, and Tb.tBVF, total volume (TV) was defined as the number of voxels within the VOI inside the image space  . Note that erosion index measure was computed from binary segmentation of the trabecular bone; but for all other trabecular bone measures, fuzzy segmentation of the trabecular bone was used. Finally, the padded VOIs were eroded by 5 voxels before computing different summary measures. A global value of each measure was derived from the VOI volume of each specimen.
Table 1. List of CT-derived trabecular bone measures examined in this paper. The nomenclature of trabecular bone measures used by Bouxsein et al (2010) and Chen et al (2018) is followed here, wherever possible. Courtesy Chen et al (2018). John Wiley & Sons. © 2017 American Association of Physicists in Medicine.
| Parameter (unit) | Description |
|---|---|
| Tb.BVF (%) | Trabecular bone volume fraction |
| Tb.tBVF (%) | Trabecular bone volume fraction contributed by transverse trabeculae characterized using tensor scale analysis (Saha et al 2015) |
| Tb.pBVF (%) | Trabecular bone volume fraction contributed by trabecular plates computed using VTA (Saha et al 2010) |
| Tb.NA (mm2/mm3) | Trabecular bone network area density, i.e. the average area of the medial surface of segmented bone per unit VOI |
| Tb.PW (µm) | Mean trabecular plate-width computed using VTA (Liu et al 2014, Saha et al 2010) |
| Tb.Th (µm) | Mean trabecular thickness computed by star-line analysis (Liu et al 2014) |
| Tb.Sp (µm) | Mean trabecular spacing, i.e. the space between trabecular micro-structures computed by star-line analysis (Liu et al 2014) |
| Tb.EI (no unit) | Erosion index—a summary measure of DTA of trabecular bone aimed to represent the extent of bone erosion (Saha et al 2000) |
VOI: volume of interest, VTA: volumetric topological analysis, DTA: digital topological analysis.
2.7. Experiments and data analysis
To examine the robustness of the proposed threshold optimization algorithm, for a given in vivo CT modality, ten out of fourteen specimens were randomly selected and used for threshold optimization. This process was repeated ten times to assess the variability or errors in threshold computation. Mean and standard deviation as well as the range of both lower and upper threshold values were computed from the results of the ten randomized runs. Finally, a unitless relative variance measure was computed by dividing the root mean square of standard deviations of upper and lower threshold values with the mean difference between the two threshold values.
For each imaging modality, different trabecular bone micro-structural measures were calculated for each specimen, and summary results of these measures over the set of all specimens are presented. Summary statistics of individual trabecular bone measures for every CT modality, including the reference micro-CT imaging, were computed in terms of the mean and standard error of different measures. For each trabecular bone measure, the linear correlation of its measured values from a given in vivo CT modality with its reference values derived from micro-CT imaging was examined.
To examine the effectiveness of the calibration method of bone micro-structural measurements using different in vivo CT modalities, we performed a leave-one-out experiment. Specifically, for a given in vivo CT modality  and a given bone measure
  , we computed the calibrated value
  for the
  th specimen using the calibration equation computed from
  - and micro-CT-derived values of all 14 specimens. Also, for the
  th specimen, we computed the calibrated value using the calibration equation computed from
  - and micro-CT-derived values of the remaining 13 specimens; let
  denote the leave-one-out calibrated value. Finally, a root-mean-square error (RMSE) between
  and
and  was computed, which was normalized by the range of
  values.
3. Results and discussion
Photographic display and volume renditions of matching VOIs from different CT scans of a cadaveric distal radius bone specimen are presented in figure 1. These VOIs were used for computing different trabecular bone measures for our analysis. Matching trabecular bone micro-structures are visible in volume renditions from different modalities. However, loss of thinner trabeculae is noted at relatively lower resolution imaging, especially in volume renditions derived from whole body MDCT and extremity CBCT scans. Also, the presence of high noise in HR-pQCT scans is visible in (d), which is more apparent in the slice-display of
Figure 2(c). Results of our optimum BVF computation method are illustrated in figures 2, 3, and table 2. The [min max] (mean ± std.) of manually selected lower and upper intensity threshold values for micro-CT imaging were [14500 15000] (14750 ± 354) and [25000 26000] (25500 ± 707), respectively. Figure 3 illustrates the results of the optimization process for HR-pQCT imaging. As noted in (g), the accuracy function generates a smooth surface, and the optimum soft-threshold parameters were obtained by locating the global maximum on the accuracy surface. Optimum BVF map is shown in (d), while the BVF maps for two non-optimal parameters are presented in (e) and (f). Matching trabecular bone micro-structures between the optimum BVF map in (d) and the reference BVF map in (b) are noticeable. Results of BVF computation for different in vivo CT modalities are presented in figure 2. Different display windows were adopted for different images to generate visually similar brightness and contrast of trabecular bone micro-structures. For all BVF maps, the same display window was applied.
Table 2. Mean, standard deviation and relative variance of computed optimum threshold intensity values in a repeat experiment using ten random specimens.
| Lower threshold value | Upper threshold value | ||
|---|---|---|---|
| Modalities | [min max] (mean ± std.) | [min max] (mean ± std.) | Relative variance (%) |
| HR-pQCT (mg HA) | [2960 3040] (2995 ± 26.0) | [3960 3990] (3972 ± 12.0) | 2.07% |
| MDCT (HU) | [61 101] (82 ± 14.3) | [371 391] (384 ± 6.3) | 3.66% |
| Dental CBCT (Gray value) | [200 200] (200 ± 0.0) | [380 430] (407 ± 18.3) | 6.25% |
| Extremity CBCT (Gray value) | [−47 − 21] (−38 ± 9.6) | [141 172] (160 ± 8.4) | 4.56% |
The mean and standard deviation as well as the range ([min max]) of optimum lower and upper threshold values obtained from the ten randomized runs of threshold computation (see section 2.7) are shown in table 2. Also, the relative variance measures for individual modalities are presented. The best performance of 2.07% relative variance was observed for HR-pQCT, whereas the worst value of 6.25% was found for dental CBCT, while the relative variance for MDCT was 3.66%.
Results of trabecular plate-rod classification at individual trabeculae, as derived from different CT scans of a bone specimen, are illustrated in figure 4. As visually noted in the figure, fully computerized classification of individual trabecular plates and rods from target CT images is possible. It is, however, difficult to visually establish the correspondence of micro-structures at the level of individual trabeculae among the plate-rod classification renditions from different modalities. Still, the correspondence of regions with higher rod (or plate) densities is noticeable among the renditions from different modalities. Results of longitudinal-transverse orientation classification of individual trabeculae from different CT scans of a bone specimen are illustrated in figure 5. As noted from the renditions using different CT modalities, the results of fully automated characterization of longitudinal (green) and transverse (red) trabeculae are visually satisfactory. Like figure 4, regional agreement of longitudinal and transverse trabecular classification from different CT modalities is visible.
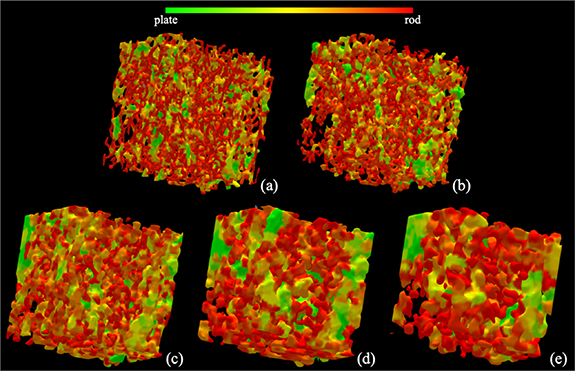
Figure 4. Illustration of trabecular plate-rod classification using different CT imaging modalities: micro-CT (a); HR-pQCT (b); dental CBCT (c); whole body MDCT (d); and extremity CBCT (e).
Download figure:
Standard image High-resolution image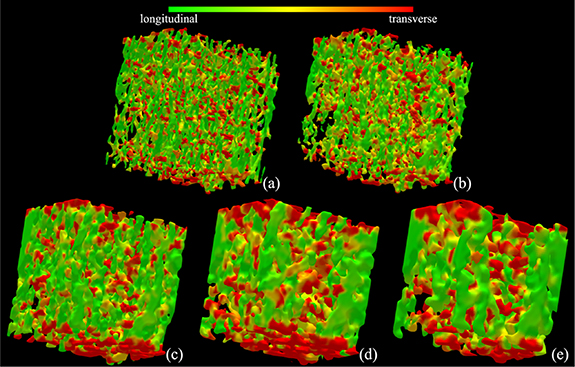
Figure 5. Illustration of trabecular bone orientation characterization using different CT imaging modalities: micro-CT (a); HR-pQCT (b); dental CBCT (c); whole body MDCT (d); and extremity CBCT (e).
Download figure:
Standard image High-resolution imageSummary statistics of different trabecular bone measures from different CT modalities in terms of their mean and standard error are illustrated in figure 6. To illustrate the relationships between spatial resolution and different measures, the imaging modalities on the horizontal axis are arranged in the descending order of spatial resolution. The observed mean of Tb.BVF, Tb.tBVF, as well as Tb.pBVF demonstrates that all in vivo CT modalities overestimate the three BVF measures compared to their reference values derived from micro-CT scans. The increase in measured mean BVF values may be explained by structure blurring at lower image resolution causing structure thickening. More importantly, the three BVF measures changes non-monotonically with spatial resolution of different CT modalities, and their highest values occur for dental CBCT imaging with intermediate image resolution. This observation suggests that, beyond the resolution regime of dental CBCT, some of the thinner trabecular micro-structures are lost, and its negative contribution to the value of mean BVF supersedes the effects of blurring. This argument is further supported by the following observation. Generally, transverse trabeculae are rod-like structures and thinner as compared to trabecular plates mostly occurring as longitudinal structures (Moon et al 2004, Sözen et al 2017).
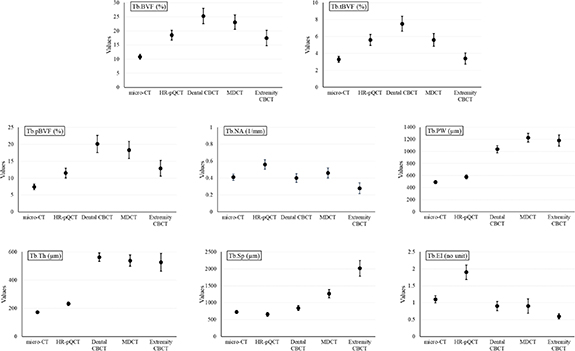
Figure 6. Mean and standard error plots for different trabecular bone measures derived from micro-CT and four in vivo CT modalities.
Download figure:
Standard image High-resolution imageFor micro-CT, HR-pQCT, as well as dental CBCT, observed mean Tb.tBVF is approximately 30% of respective mean Tb.BVF values, while mean Tb.tBVF fall to 24% and 19% of Tb.BVF for MDCT and extremity CBCT, respectively. Tb.pBVF was computed to be approximately two-third of Tb.BVF for micro-CT and HR-pQCT but much higher for other CT modalities. These observations indicate that, at low image resolution, loss of transverse trabeculae is much higher than the loss of plate-like structures. In case of Tb.NA, no significant relationship between mean network area and image resolution was observed. The value of mean Tb.NA measure from HR-pQCT scans is significantly higher than its values derived from other modalities, which is primarily contributed by noise artifactually increasing trabecular network area after skeletonization. In general, observed mean Tb.PW and Tb.Th using an in vivo imaging modality are higher than their values obtained using micro-CT imaging. Compared to other in vivo modalities, the observed mean value of Tb.PW using HR-pQCT is closer to the micro-CT-based value. Mean Tb.PW measures using dental CBCT, MDCT, and extremity CBCT imaging are more than double of its micro-CT-based value.
The observed differences in the mean values of Tb.Th measure using in vivo modalities are even greater. A probable reason behind this is the composite effect of two factors―increased blurring as well as loss of thinner trabeculae at lower resolution―both increasing the mean Tb.Th values. The mean of the trabecular spacing measure Tb.Sp derived using the HR-pQCT imaging is smaller compared to its reference value using micro-CT, which may be an attribution of noise. The observed mean values of the erosion index measure Tb.EI using in vivo imaging modalities show a similar trend as the trabecular network area measure Tb.NA. In general, the results of figure 6 show that observed values of different trabecular bone measures vary non-monotonically with changes in spatial resolution of in vivo scanners. This suggests that, besides the differences in spatial resolution of in vivo scanners, changes in observed values of different measures are contributed by various other factors including image noise, reconstruction algorithm, image interpolation etc.
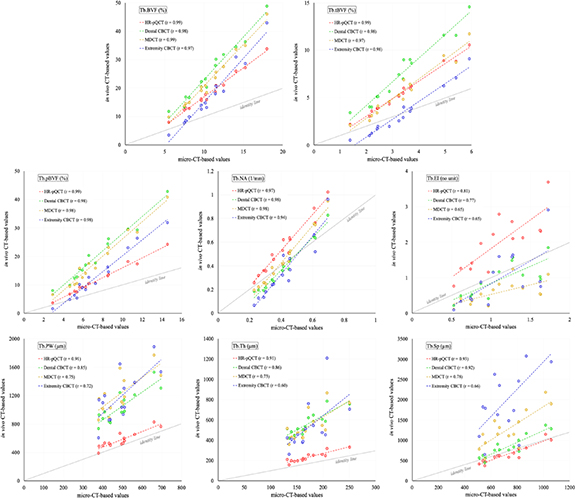
Results of linear correlation (r-value) analysis of different trabecular bone measures using different in vivo modalities relative to the reference micro-CT scans are illustrated in figure 7. As shown in the figure, the three BVF measures Tb.BVF, Tb.tBVF, and Tb.pBVF, as well as the trabecular network area measure Tb.NA, using all four in vivo modalities are highly correlated (r ε [0.94 0.99]). The plate-width measure Tb.PW using HR-pQCT scanner show high correlation (r = 0.91) with its micro-CT-based values, while the correlation for the measure using other in vivo modalities are more moderate (r ε [0.72 0.85]). Similar results of correlation analysis are observed for the thickness measure Tb.Th except for extremity CBCT imaging, where the correlation is relatively weak (r = 0.60). For all imaging modalities, the observed linear correlation (r ε [0.66 0.93]) for the spacing measure Tb.Sp is higher than their respective r values for Tb.Th. This suggests that the Tb.Sp measure is relatively more reliable than the thickness measure at lower resolution, which seems plausible because trabecular spacing is larger than thickness; see the observed mean values in figure 6 for micro-CT imaging. In general, the erosion index measure Tb.EI resulted in lower linear correlation (r ε [0.65 0.81]) for all in vivo modalities as compared to the plate-rod measures Tb.pBVF and Tb.PW. The algorithms for computing Tb.pBVF and Tb.PW account for partial voxel voluming and characterization of plates and rods on the continuum, which improves its performance at a lower resolution as compared to the algorithm for computing erosion index which needs binarization, and hard classification of plates and rods. All trabecular bone measures, except Tb.EI, using HR-pQCT show high correlation (r ε [0.91 0.99]). Also, it is notable that, although most of the trabecular bone measures show large shift in their mean values at in vivo resolution, several trabecular bone measures, namely Tb.BVF, Tb.tBVF, Tb.pBVF, and Tb.PW, are strongly to moderately correlated (r ε [0.72 0.99]) with the reference micro-CT values. It is worthy to mention that the ranges of x- and y-axes in the plots of figure 7 are different. Thus, slopes of different trend lines in these plots may not indicate the relationships of measured values using micro-CT and corresponding in vivo modalities; see figure 6 for relationships among values measured using different modalities.
Figure 7. Correlation among the values of different trabecular bone measures derived from target CT modalities and the corresponding reference values from micro-CT scans. Pearson correlation coefficient (r) values are reported. Regression as well as the identity lines for each modality is displayed. It may be noted that the ranges of x- and y-axes in these plots are not matched.
Download figure:
Standard image High-resolution image
Normalized RMSE (%) of calibrated bone measures for different in vivo CT modalities characterizing effectiveness of the calibration method is presented in table 3. For all in vivo CT modalities, the normalized error is less than 4.5% for all bone measures except Tb.Th, Tb.Sp, and Tb.EI. Tb.Th shows the worst performance in terms of calibration error. Among the CT modalities, extremity CT shows the worst calibration error, which also has the lowest spatial resolution.
Table 3. Normalized RMSE (%) of calibrated bone measures for different in vivo CT modalities computed using calibration equations from all fourteen specimens and leave-one-out experiments.
| Normalized RMSE (%) | ||||||||
|---|---|---|---|---|---|---|---|---|
| Modalities | Tb.BVF | Tb.tBVF | Tb.pBVF | Tb.NA | Tb.PW | Tb.Th | Tb.Sp | Tb.EI |
| HR-pQCT | 0.54 | 0.84 | 0.55 | 0.97 | 2.67 | 3.50 | 3.25 | 2.69 |
| MDCT | 1.27 | 1.56 | 0.74 | 1.43 | 4.42 | 7.09 | 3.54 | 7.62 |
| Dental CBCT | 1.12 | 1.18 | 0.80 | 1.66 | 2.95 | 5.45 | 2.08 | 3.11 |
| Extremity CBCT | 1.86 | 2.12 | 1.34 | 3.53 | 4.43 | 19.19 | 5.94 | 3.53 |
In our previous studies on the same specimens (Klintström et al 2016, 2017) we used Tb.BVF, Tb.Th and Tb.Sp for comparing different CT modalities using different binary segmentation methods. Instead, in this paper we used a soft segmentation strategy to create BVF maps from which we extracted the micro-structural measures described in section 2.6. Compared to these studies, the new soft segmentation method results in stronger correlations for Tb.BVF regarding all modalities, and clearly stronger correlation also for Tb.Th using MDCT and Tb.Sp using HR-pQCT. Correlations for the other parameters were almost in the same range as when using binary segmentation methods.
It may be noted that CT imaging allows measurement of bone mineral density that requires mapping CT numbers to the material density, and different commercial calibration phantoms are available for this purpose. It would be important to pursue CT-based quantitative BMD measures along with BVF as a collective metric for osteoporosis (Chen et al 2018). Also, this would allow to evaluate the relationships among bone density, BVF-based bone micro-structural measurements, and the modality-specific spatial resolution.
It may be clarified that the small excised specimens used in this study may not realistically represent the cases of intact human arm or legs though resins and immersion in water were used to simulate surrounding soft tissue and marrow. Thus, the results presented here do not account for corrections/calibrations in in vivo CT-based measures of bone micro-structural values due to differences in body size and beam hardening artifacts. However, the differences in CT values due to body size and beam hardening are limited at peripheral sites, and the overall trend of the results presented here is expected to hold in a more realistic study involving intact specimens.
Overall results of this study point to the need for proper calibration for every scanning protocol and every specific scanner model before using them in human research and clinical studies. In our case, this was done through a cadaveric specimen experiment. It may also be noted that, once a protocol on a scanner has been calibrated, it may be reliably used for studies at different other sites.
The current clinical reference method DXA has several advantages compared to the modalities studied in this paper. These include low radiation, wide availability and the ability to measure BMD in central bone locations (e.g. spine and hip). However, being a two-dimensional technique, it cannot measure volumetric BMD or bone micro-structure. Most modalities are restricted to use in the extremities, thus neglecting important anatomical regions such as the hips and spine. For MDCT, the additional radiation dose may be a smaller problem if MDCT scans that are acquired for other diagnostic purposes could also be used for bone measurements and assessment of fracture-risk. Also, studies are available in literature demonstrating that peripheral in vivo bone measures independently characterize or enhance the power to characterize osteoporotic fractures (Boutroy et al 2008, Vilayphiou et al 2010, Nishiyama et al 2013). It seems clear that further cross-sectional and longitudinal studies are needed to establish the true value of the various in vivo CT techniques in the context of trabecular bone assessment.
4. Conclusion
Using different in vivo CT modalities for quantitative trabecular bone micro-structural imaging and trabecular bone measures, this study has focused on several measures related to trabecular plate/rod and longitudinal/transverse distribution. Although the measured values of trabecular features at in vivo resolution differ greatly from their reference values from micro-CT imaging, there is, in general, a strong to moderate correlation between the measurements from in vivo CT and micro-CT imaging. The performance of different in vivo modalities, in terms of linear correlation of derived trabecular bone measures with reference measurements, is dependent on their resolution. HR-pQCT imaging has the highest true spatial resolution, and all trabecular bone measures, except Tb.EI, derived using this modality show high correlation (r ε [0.91 0.99]) with micro-CT-based reference values. Strong to moderate correlation of measures derived from in vivo CT methods suggest the great promise of in vivo CT imaging for quantitative trabecular bone micro-structural analysis. On the other hand, large shifts in observed values of trabecular bone micro-structural measures using different in vivo modalities suggest that data from different scanners may introduce modality-specific data-shift, which must be carefully considered during experimental and data analysis planning. For a study with limited statistical power, it is recommendable to use a single imaging modality throughout the study to avoid modality-specific variability. For large multi-site and longitudinal studies involving different imaging modalities due to option limitations, it is recommendable to use different modalities only with proper linear calibration. Further, the wide range of performance of individual measures at different imaging modalities suggests the need for judicious selection of target trabecular bone measures depending upon imaging modalities available to individual studies. The experimental design adopted in this study shows modality-specific influence factors, including spatial resolution, noise, and radiation exposure on different trabecular bone micro-structural measures.
Acknowledgments
The Authors would like to thank Professor Sharmila Majumdar, the University of California, San Francisco for providing the bone specimens, Britt-Marie Andersson at the University of Uppsala for the micro-CT scans, Daniel Sundh at the University of Gothenburg for the HR-pQCT scans, and Torkel Brismar at the Karolinska University Hospital, Stockholm for the Verity scans. This work was partially supported by Eurostars, grant E11626 and NIH R01 HL142042.