

Abstract
We developed multi-modality radiomic models by integrating information extracted from 18F-FDG PET and CT images using feature- and image-level fusions, toward improved prognosis for non-small cell lung carcinoma (NSCLC) patients. Two independent cohorts of NSCLC patients from two institutions (87 and 95 patients) were cycled as training and testing datasets. Fusion approaches were applied at two levels, namely feature- and image-levels. For feature-level fusion, radiomic features were extracted individually from CT and PET images and concatenated. Alternatively, radiomic features extracted separately from CT and PET images were averaged. For image-level fusion, wavelet fusion was utilized and tuned with two parameters, namely CT weight and Wavelet Band Pass Filtering Ratio. Clinical and combined clinical + radiomic models were developed. Gray level discretization was performed at 3 different levels (16, 32 and 64) and 225 radiomics features were extracted. Overall survival (OS) was considered as the endpoint. For feature reduction, correlated (redundant) features were excluded using Spearman's correlation, and best combination of top ten features with highest concordance-indices (via univariate Cox model) were selected in each model for further multivariate Cox model. Moreover, prognostic score's median, obtained from the training cohort, was used intact in the testing cohort as a threshold to classify patients into low- versus high-risk groups, and log-rank test was applied to assess differences between the Kaplan–Meier curves. Overall, while models based on feature-level fusion strategy showed limited superiority over single-modalities, image-level fusion strategy significantly outperformed both single-modality and feature-level fusion strategies. As such, the clinical model (C-index = 0.656) outperformed all models from single-modality and feature-level strategies, but was outperformed by certain models from image-level fusion strategy. Our findings indicated that image-level fusion multi-modality radiomics models outperformed single-modality, feature-level fusion, and clinical models for OS prediction of NSCLC patients.
Export citation and abstract BibTeX RIS
1. Introduction
Non-small cell lung carcinoma (NSCLC) is a highly prevalent malignancy and the leading cause of cancer death (Wang et al 2020a). NSCLC accounts for 85% of lung cancer cases and presents in miscellaneous forms, such as indolent and aggressive forms. These etiologies challenge diagnostic and treatment tasks (Wang et al 2020a). It has been observed that NSCLC patients show different therapeutic responses, and prognosis varies due to varying cellular and histological heterogeneities (Stewart et al 2020). As such, it would be critical to prognosticate NSCLC using accurate and robust approaches.
The tumor node metastasis (TNM) staging system for lung cancer staging (Goldstraw et al 2016, Amin et al 2017) is an accepted and common clinical framework; however, it suffers from a number of limitations which results in a wide range of survival times for patients with the same staging of tumors (Sculier et al 2008, Chansky et al 2009, Uramoto and Tanaka 2014). Omics approaches including genomics and proteomics provide venues for improved prognostic and predictive models (Beane et al 2009, Subramanian and Simon 2010, Network 2014). Genomics studies reveal that intra-tumor heterogeneity is a common trait in solid tumors such as NSCLC (Chen et al 2014, Meister et al 2014, McGranahan and Swanton 2017). However, since this procedure is invasive with limited sampling, it does not provide complete characterization of tumor heterogeneity (Longo 2012). Enabling robust biomarkers that provide more complete characterization of tumor heterogeneity can therefore potentially be of great value.
Recently, radiomics studies have shown promising results to decode intra-tumoral heterogeneity and predict prognosis and therapy response in cancer patients (Scrivener et al 2016, Rastegar et al 2020, Nazari et al 2020a, 2020b). The aim of such radiomics efforts is to arrive at clinical decision support systems for more effective management of NSCLC patients. The radiomic features extracted from computed tomography (CT) and positron emission tomography (PET), alone or in combination, were used as imaging surrogates to develop personalized predictive models. Quantification of intra-tumor heterogeneity in NSCLC patients have provided improved performance for recurrence, survival, and response prediction from both 18F-FDG PET (Cook et al 2013, Tixier et al 2014, Hatt et al 2015, Pyka et al 2015, Cook et al 2015) and CT (Longo 2012, Ganeshan et al 2013, Aerts et al 2014, Fried et al 2014, Dercle et al 2020, Wang et al 2020a, 2020c) images. However, different modalities reflect different aspect of tumor heterogeneity. For instance, heterogeneity in PET images reflect adversity in radiotracer uptake, which conveys metabolic or molecular signatures of disease (cellular proliferation, hypoxia, and metabolism) (O'Connor et al 2015). Conversely, heterogeneities in CT images are due to tissue density differences, which reveals additional information, such as vascularization and/or necrosis (Aerts et al 2014). These adversities in tumor microenvironment may induce metastasis and tumor invasion, edema, impairment in delivery of chemotherapeutic agents, cellular resistance to chemotherapy and radiotherapy, and blockage of immune responses, all eventually affecting patients' survival (Ganeshan and Miles 2013). In this regard, a combination of such information may provide improved prognostic information and also provide the ability to unveil therapeutic targets for diseases.
A number of studies attempted to assess the additive prognostic value of multi-modality models by integrating the information at different fusion levels (i.e. image-, matrix-, and feature-level fusions). Primary multi-modal radiomics studies investigated the potential added prognostic value by concatenating features (feature-level fusion) from different imaging modalities (Vaidya et al 2012, Lartizien et al 2013, Desseroit et al 2016, Kirienko et al 2018, Jiang et al 2019, Shiri et al 2020a). Other studies, instead, adopted the image-level fusion. For example, (Mu et al 2018) and (Riyahi et al 2018) utilized weighted integration of PET and CT images to predict immunotherapy response in NSCLC patients, and longitudinal evaluation of tumor response in esophageal cancer, respectively. Both demonstrated that features from fused images show better outcomes compared to features from separate images. Considering more advanced fusion techniques, (Vallières et al 2015) integrated PET and MRI images by implementing wavelet-based fusion to evaluate the risk of lung metastasis in soft-tissue sarcomas. Their results indicated that texture features extracted from fused images drastically improved lung metastases prediction in comparison with the separate scans. Zhou et al (2019) developed a predictive model for progression from mild cognitive impairment to Alzheimer's disease, using PET and MR imaging modalities. The highest accuracy was obtained by markers from fused images in combination with clinical variables.
Most recently, (Lv et al 2019) performed PET/CT fusion at multiple levels, for intra-tumor heterogeneity characterization in head and neck cancer. The best results were obtained from the feature-level fusion (feature averaging) model and the image-level fusion (wavelet fusion) strategy.
The multi-modality radiomics approach has great potential to cope with limitations of single-modality models, since it enables the extraction of more meaningful features and consequently results in more robust characterization of the underlying tumor. In this study, we attempted to provide a more complete view of NSCLC tissue characteristics by integrating imaging information from PET and CT scans. To this end, we first utilized image- and feature-level fusion strategies to develop multimodality radiomics models, and then investigated if these models provide improved prognostication of overall survival (OS) in NSCLC patients, compared to models based on individual modalities.
2. Materials and methods
2.1. Clinical studies
Our study was conducted on NSCLC datasets obtained from the Cancer Imaging Archive (TCIA) (Prior et al 2013, Bakr et al 2018, Shiri et al 2020b), including 211 histologically proven NSCLC patients from two independent institutions namely Palo Alto Veterans Affairs Healthcare System, and Stanford University School of Medicine (referred to as VA and Stanford in the rest of this work). Two hundred and one patients underwent 18F-FDG PET/CT scans (10 patients were excluded owing to unavailability of PET images), prior to surgical treatment between April 2008 and September 2012. Our exclusion criteria were: visual observation of images with high levels of noise and/or artifacts, miss-segmentation, and miss-registration errors. Overall, 182 patients (87 from VA and 95 from Stanford) were included. Imaging data extracted from the DICOM headers were as follow. A GE Discovery PET/CT scanner was used to acquire images in VA, while Stanford used GE Discovery D690, Philips Healthcare and Siemens Healthcare PET/CT scanners. Key acquisition parameters are reported separately for VA and Stanford datasets in supplementary table S1 (available online at stacks.iop.org/PMB/66/205017/mmedia). Imaging data were also paired with clinical information such as histopathological grade, TNM stage, age, sex, smoking status and survival time outcomes. However, TNM stage and histopathological grade were not available for 28 subjects in the Stanford dataset. Characteristics of patients categorized in VA and Stanford datasets are described in table 1.
Table 1. Characteristics of the patients categorized as VA and Stanford datasets.
| Characteristic | VA | Stanford | |
|---|---|---|---|
| Patient NO. | 87 | 95 | |
| Age (year) | 68 (43–87) | 68 (24–86) | |
| Sex (%) | Male | 97 | 39 |
| Female | 3 | 61 | |
| Smoking status | Non-smoker (%) | 7 | 35 |
| Former (%) | 69 | 56 | |
| Pack years (mean) | 46 | 31 | |
| Current (%) | 24 | 9 | |
| Pack years (mean) | 52 | 34 | |
| Histology (%) | Adenocarcinoma | 71 | 90 |
| Squamous cell carcinoma | 25 | 9 | |
| NOS (not otherwise specified) | 4 | 1 | |
| T Stage (%) | Tis/T1a/T1b/T2a/T2b/ | 3/31/15/27/5 | 2/12/16/23/6 |
| T3/T4/Not collected | 14/5/0 | 8/3/30 | |
| N Stage (%) | N0/N1/N2/Not collected | 82/8/10/0 | 53/7/10/30 |
| M stage (%) | M0/M1a/M1b/Not collected | 99/0/1/0 | 66/1/3/30 |
| Histopathological grade (%) | G1/G2/G3/Other I/Other II/ Not collected | 22/39/24/8 | 10/39/13/2 |
| 7/0 | 6/30 | ||
| Therapy (%) | Adjuvant + Chemotherapy | 21 | 15 |
| Adjuvant + Chemotherapy + Radiation | 8 | 9 | |
| surgery | 100 | 100 | |
| None (except surgery) | 71 | 76 | |
| Time to last follow up (days) | 1470(803) | 1076(773) | |
| Death (%) | 37 | 26 |
2.2. Study design
For radiomics analysis on multi-modal PET/CT imaging data, PET and CT data underwent fusion at feature- and image- levels (figure 1). For image-level fusion, features were extracted from a single image, obtained from the merging of PET and CT images via wavelet fusion strategy. For feature-level fusion, features were extracted from separate scans and then two different approaches of feature concatenation and feature averaging were pursued. Individual PET and CT models were also constructed for comparison purposes. Moreover, all models were considered with and without clinical features in order to assess the additive prognostic value of clinical parameters to each model.

Figure 1. Flowchart of multi-level multi-modality radiomics framework employed in this study.
Download figure:
Standard image High-resolution image2.3. Image segmentation
All malignant lesions in PET images were delineated and segmented manually using OSIRIX®. 3D-slicer was utilized to segment tumor volumes from CT images using automatic region growing. Both PET and CT segmentations were edited and verified by an experienced radiologist. Subsequently, CT and PET segmentations were merged into a single mask to reduce segmentation errors and ensure that the features are extracted within the same volume of interest (VOI) over all single-modality and fusion models. In the merged segmentation, we generated a binary mask, where each voxel was assigned a label of 1, if the corresponding voxels in PET or CT masks were equal to 1 (supplementary figure S1). In addition, ∼10% of the patients had more than one lesion. Supplementary figure S2 illustrates the number of lesions for each patient and the procedure of analyzing multiple lesions together.
2.4. Multi-level fusion
For image-level fusion, a wavelet-based technique was adopted. In order to integrate the spatial and frequency characteristics of CT and PET imaging modalities, the 3D discrete wavelet transform (DWT) was utilized. However, prior to image fusion, the volumes need to be registered to ensure that all voxels from one volume are mapped to their corresponding voxels in the other volume. Since PET and CT scans were captured simultaneously on a hybrid PET/CT scanner with no major motion artefacts, they were reasonably well aligned. However, in this dataset, not only PET and CT images had different in plain resolutions, but also, in many patients the size, and the position of in plain field-of-view was different (images' origins had to be matched). To address this issue, 'Image Position' in DICOM headers was utilized to crop and/or pad scans to the same size to get a registered field-of-view. Subsequently, PET and CT images were resampled to an equal resolution with isotropic voxel spacing of 2 × 2 × 2 mm3 using cubic interpolation and an antialiasing kernel. Pixel spacings of the original CT and PET images were within ranges of [0.88–1.37] mm and [3.65–5.47] mm, respectively. Hence, downsapmling CT to PET image resolution, or upsampling PET to CT image resolution would significantly affect the intensity values of PET or CT images. As such, we used 2 × 2 × 2 mm3 isotropic voxel size to keep both images as intact as possible.
Subsequently, after preparing images for fusion, PET and CT images were decomposed up to one level by applying 3D DWT using wavelet basis function symlet8. Subsequently, the spatially corresponding coefficients of the wavelet domains of images were weight averaged to obtain a single set of fused wavelet coefficients. Finally, the set of fused wavelet coefficients underwent 3D inverse DWT to obtain a fused image.
We investigated the influence of two wavelet fusion parameters on the performance of the models constructed from the consequent fused image. One adjustment modified the weights of CT and PET corresponding wavelet coefficients in the averaging procedure. CT weights (W) were set to 1/4, 1/2, and 3/4; and the corresponding PET weights were (1—CT weights). The other adjustment was applied through wavelet band-pass filtering (WBPF). This was accomplished by allocating different weights to band-pass sub-bands (HHL, HLH, LHH, HLL, LHL, LLH) of the wavelet domain, in comparison to the low- and high-frequency sub-bands (HHH, LLL). The ratio (R) of the weight assigned to band-pass sub-bands, over the weight assigned to the other sub-bands, was set to 2/3, 1, and 3/2. This band-pass filtering procedure was proposed by Carrier-Vallières (Carrier-Vallières 2013), suggesting that the spatial definition of textures in the fused images can be enhanced by modification of corresponding frequency properties of the images in the wavelet domain. Nine different fused images were constructed from all possible combinations of three CT weights and three wavelet band-pass ratios (a specific fused image with CT weight of 1/2 and band-pass ratio of 3/2 is denoted as WF_R3/2_W1/2) (figure 2). In the case of feature-level fusion, two different strategies were considered. The first method involved concatenation of features from different modalities, which is a common feature-level fusion strategy (ConFea). For the second strategy, features from the two modalities were averaged, and then the model was constructed from the above-mentioned averaged feature set (AvgFea). Thirteen different radiomic models from three different strategies, namely single-modality strategy (individual CT and PET), feature-level fusion strategy (AvgFea and ConFea), and image-level fusion strategy (nine wavelet fusion models) were analyzed in this study.
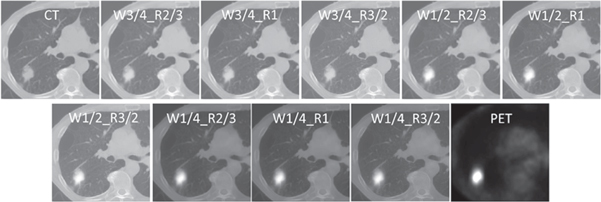
Figure 2. Representative example of CT, PET, and wavelet fused images with W = 1/4, 1/2, 3/4 and R = 2/3, 1, 3/2.
Download figure:
Standard image High-resolution imageIn addition to radiomics models, a clinical model was constructed from two clinical parameters, namely TNM staging and histopathologic grade. Other clinical parameters such as sex, age, treatment regimen and smoking status had very limited univariate performance (C-indices ∼0.5). By comparison, TNM staging and histopathological grade had higher performance in our univariate model (C-indices of 0.63 and 0.59, respectively) and were selected for clinical modeling. Moreover, all 13 radiomic models were also extended to contain both radiomics and clinical features. To ensure the presence of clinical features in all radiomics + clinical models for thorough comparisons, radiomics features first went through the feature selection procedure and then the model was constructed from concatenation of the selected radiomics features and the two clinical parameters. Altogether, we investigated 26 + 1 different models including 13 radiomics, 13 radiomics + clinical strategies, plus one clinical model based on clinical-only (TNM staging and grade) parameters.
2.5. Feature extraction
To standardize images with different voxel sizes and obtain rotationally invariant texture features, images were interpolated to isotropic voxel spacing of 2 × 2 × 2 mm3. Then, prior to computation of texture features, intensity levels inside the tumor volume were discretized into 16, 32, and 64 bins, so each radiomics model was extended to three models resulting in a total of 79 different models (3 × 13 radiomic models, and 3 × 13 radiomics + clinical models as mentioned earlier, plus one clinical-only model) to be analyzed. From each VOI, 225 radiomic features were extracted. The feature-set included 79 first-order features (statistical, histogram, intensity-histogram and morphological features), 136 three-dimensional textural features extracted from gray-level co-occurrence matrix (GLCM), gray-level run length matrix (GLRLM), gray-level size zone matrix (GLSZM), gray-level distance zone matrix (GLDZM), neighborhood gray tone difference matrix (NGTDM), and neighborhood gray-level dependence matrix (NGLDM), and finally 10 moment invariant features. All features were extracted using The Standardized Environment for Radiomics Analysis (SERA) Package 10 (Ashrafinia 2019), a Matlab®-based framework, in agreement with guidelines from the Image Biomarker Standardization Initiative (IBSI) (Zwanenburg et al 2016) and evaluated in multi-center standardization studies (McNitt-Gray et al 2020, Zwanenburg et al 2020), for improved features reproducibility.
2.6. Statistical analysis
Since two independent datasets from two different institutions were involved in this study, in order to validate our results more comprehensively, we investigated two train/test arrangements (or partitions); namely, using VA for training and Stanford for testing cohorts (referred as VAS), and alternatively switching datasets (using Stanford for training and VA as test cohort, referred to as SVA). In order to minimize redundancy within feature subsets, one of each features pair with Spearman's rank correlation coefficient higher than 0.9 were omitted. For each feature in each model, univariate Cox proportional hazard (Cox PH) regression was conducted by performing 100 repetitions, using bootstrap resampling. Then the prognostic performance of each feature was measured using Harrell's concordance index (C-index), and top 10 most relevant features with the highest C-indices were selected for each model to use in further multivariate analysis. For each strategy, we tested the performance of multivariate Cox models constructed from all possible combinations of candidate features (3 up to 10 features) in the training cohorts, and the combination with the highest C-index was selected as the optimum. The number of all possible combinations of features in this study containing 10 candidates was  Testing all possible combinations of candidate features is time-consuming, but aids in finding the optimum feature signature. For radiomics + clinical models, the two clinical parameters were added to the optimum feature set, and then fed to the multivariate Cox model. The optimum model of each strategy was applied to training and testing cohorts by 1000 repetitions using bootstrap resampling. After model was trained, in each boot, model was applied to 100 subjects selected (by replacement) from training cohort and then tested on 100 subjects selected (by replacement) from the testing dataset. The final C-index of each model was obtained by averaging 1000 C-indices captured by bootstraps. Significant difference between each pair of models was obtained by applying Student's t-test, to compare the mean values of C-indices of each model captured from bootstrapping on the testing cohort. In order to set strict acceptance, only t-test p-values lower than 0.001 were considered significant. We used the median prognostic score of each strategy achieved from the training cohorts, untouched as a threshold to classify patients into low- and high-risk groups. Then log-rank test was applied to find the difference between Kaplan–Meier curves of the subsets. In order to average and combine results from both VAS and SVA groups, C-index values were averaged, and log-rank p-values were combined using Fisher's method (Fisher 1992). P-values lower than 0.05 were considered statistically significant. All statistical analyses were performed on R (R-3.5.3).
3. Results
We used two different dataset arrangements to validate our results more comprehensively. Meanwhile, since the percentage of events (deaths) in the VA dataset was higher than Stanford's (37% versus 26%), some specific detailed results are only reported for VAS training/testing.
3.1. Features analysis
The top 10 features with the highest performance (ranked by univariate Cox regression) were collected in each radiomics model. Supplementary figure S3 demonstrates the feature popularity. Large distance high gray level emphasis from GLDZM, busyness from NGTDM, dependence count variance from NGLDM, and global intensity peak were among the top ranked features of more than 20 out of a total of 39 radiomic models (including single- and multi-modality models). Moreover, the final selected features for each model in VAS partition are listed in supplementary table S2. The number of selected features ranges from 4 to 10 (mostly within the range [6–8], where only one model was trained with 10 features).
Figure 3 depicts a visual example of textures displayed on PET, CT and fused images, as well as feature maps of one of the most repeated features, NGTDM-busyness, for both a low- and a high-risk patient.

Figure 3. Representative example of textures of tumors captured by CT, PET, and wavelet fusion, as well as feature-maps of NGTDM-busyness. (a) Illustration of the difference between CT, PET, and WF_R1_W1/2 tumor images of a low- and a high-risk patient. (b) The differences of NGTDM-busyness, feature map of CT, PET, and WF_R1_W1/2, for a low- and a high-risk patient.
Download figure:
Standard image High-resolution image3.2. Feature comparison between different strategies
The comparison of features between different image-level fusion models and PET/CT single-modalities was performed in the VAS partition for varying number of gray-level intensity discretization (16, 32, 64). However, since morphological features were constant through all models, the comparison was applied to 182 intensity and texture features. Supplementary table S3 shows the correlation between corresponding features in PET/CT single-modality models and different image-level fusion models for 16, 32, and 64 gray-level discretization, respectively.
3.3. Comparison of different models
Here we report the performance of each model for OS prediction with C-index (regression task) and log-rank p-value (classification task) in the test cohort (independent and unseen dataset for external validation). Table 2 summarizes the C-index, its standard deviation, and p-value for each radiomics, radiomics + clinical, and clinical-only model, by averaging the VAS and SVA results. Moreover, the results of all models can be found in a more detailed way, separately for VAS and SVA arrangements, in supplementary table S4. Supplementary figure S4 illustrates the box-plots of C-indices for all radiomics (supplementary figure S4(a)) and radiomics + clinical models (supplementary figure S4(b)). Figure 4 depicts Kaplan–Meier curves (for VAS training/testing arrangement) of models with the best performance in classifying patients into low- versus high-risk groups, among single-modalities, feature-level and image-level fusion strategies, as well as the clinical-only model. As shown in table 2, considering the regression task, the best performance was achieved by WF_R3/2_W1/2_16 (C-index = 0.689) in radiomics group, and WF_R2/3_W1/4_64 (C-index = 0.683) in radiomics + clinical group. The clinical model also reached a C-index of 0.656. Note that in specific partition VAS (supplementary Table S4), several image-level fusion models showed significantly higher performance. WF_R3/2_W1/2_16 (C-index = 0.735) from radiomics and WF_R1_W1/2_16 (C-index = 0.762) from radiomics + clinical groups had the best results.
Table 2. The C-index, its standard deviation, and p-value of different models in testing cohort averaged for both VAS and SVA partitions. C-indices higher than 0.65 are marked as red, and p-values lower than 0.01 are color marked as blue.
|
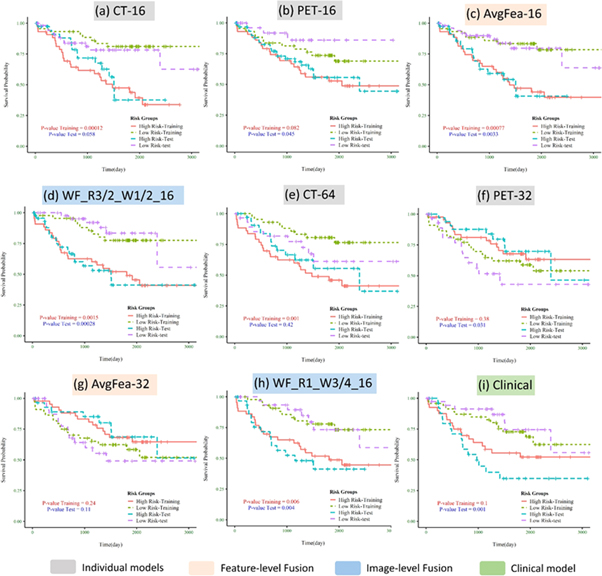
Figure 4. Kaplan–Meier curves of the best model in individual modality, feature-level fusion, and image-level fusion strategies shown only for VAS partition: (a)–(d) radiomics models; (e)–(h) radiomics + clinical models; (i) clinical model. The curves for training and testing cohorts are color coded as shown in the legend. P-values are shown for both training and testing datasets.
Download figure:
Standard image High-resolution imageIn the case of classification competency, in radiomics models, CT-16 from individual strategy, AvgFea-16 from feature-level fusion strategy and 10 models from image-level fusion strategy such as WF_R2/3_W3/4_16, WF_R1_W1/4_32 and WF_R3/2_W1/2_64 reached p-value <0.001. In radiomics + clinical group, WF_R1_W3/4_16 (p-value: 0.003) had the best performance. Moreover, clinical model was able to classify patients in low- versus high-risk groups with an acceptable p-value of 0.001. Further results are aimed to provide a deeper insight into our findings by comparing different models from different strategies (clinical, single-modality, feature- and image-level fusion) in radiomics and radiomics + clinical groups, separately. The corresponding p-values of the t-tests applied to all possible pairs of models can be found in supplementary figure S5 for radiomics versus radiomics supplementary (figure S5(a)), radiomics versus radiomics + clinical (figure S5(b)), and radiomics + clinical versus radiomics + clinical (figure S5(c)). Figure 5 compares the best models of each strategy for radiomics (figure 5(a)) and radiomics + clinical (figure 5(b)) groups. Moreover, a comparison of strategies (comparison of average c-index of models from single-modality strategy, feature-level fusion strategy, image-level fusion strategy, and clinical model) is presented in supplementary figure S6 for radiomics and radiomics + clinical, respectively.
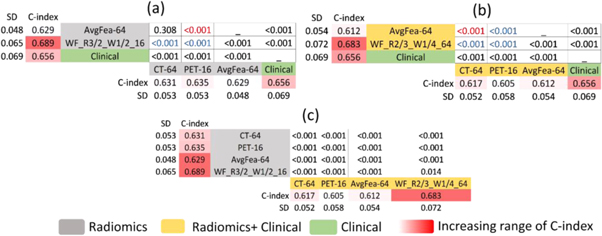
Figure 5. Statistically significant differences for C-indices between the best models of different strategies in (a) radiomics, and (b) radiomics + clinical groups. Panel (c) depicts statistically significant differences between best models of radiomics, and radiomics + clinical groups. Corresponding p-values of statistically significant differences are shown. Radiomics + clinical models are marked in yellow, radiomics models are marked in gray whereas the clinical model is marked in green. For (a), (b), if fusion models outperform individual modalities, p-values are marked in blue, and red vice versa.
Download figure:
Standard image High-resolution imageIn radiomics group (figure 5(a)), the best models in single-modality strategy were CT-64 and PET-16 (C-indices = 0.631 and 0.635, respectively). Regarding feature-level fusion strategy, the best model was AvgFea-64 (C-index = 0.629); although the difference with CT-64 was not significant (p-value = 0.308), it was predominated by PET-16 (p-value < 0.001). Regarding image-level fusion strategy, WF_R3/2_W1/2_16 (C-index = 0.689) significantly outperformed CT-64, PET-16, and AvgFea-64 (p-values <0.001).
Amongst radiomics + clinical models (figure 5(b)), the best results of single-modality strategy were again achieved by CT-64 and PET-16 (C-indices = 0.617 and 0.605, respectively). Regarding feature-level fusion strategy, the best model was AvgFea-64 (C-index: 0.612) which was outperformed by CT-64, but outperformed PET-16 (both p-values <0.001). Considering image-level fusion strategy, best model was WF_R2/3_1/4_64 (C-index = 0.683), which significantly outperformed CT-64, PET-16, and AvgFea-64 (p-values <0.001).
The clinical model (C-index = 0.656) outperformed all single-modality and feature-level fusion models but was outperformed by some image-level fusion models, such as WF_R3/2_W1/2_16 and WF_R2/3_1/4_64 from radiomics and radiomics + clinical groups, respectively.
Strategies were also evaluated and compared by applying Student's t-test on the average C-index of models in different strategies (supplementary figure S6). While the results of feature-level fusion strategy and single-modality strategy were not significantly different (p-values = 0.474, and 0.690), image-level fusion strategy significantly outperformed single-modality (p-values <0.01) and feature-level fusion strategies (p-value <0.001 and p-value <0.005) when comparing within radiomics and radiomics + clinical groups, respectively. Moreover, the result of the clinical model was significantly higher than single-modality, and feature-level fusion strategies, but was comparable with image-level fusion strategy (p-values = 0 .749 and 0.367 for radiomics and radiomics + clinical group, respectively).
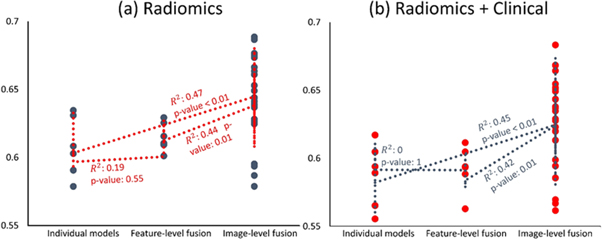
Figure 6 illustrates the scatter plots of results from radiomics (figure 6(a)) and radiomics + clinical (figure 6(b)) groups, based on their strategies (single-modality, feature- and image-level fusion), with Spearman's rank correlation coefficients and the corresponding p-values indicating statistically significant differences. Spearman's rank correlation test was performed between ranks of different strategies (single-modality, feature- and image-level fusion ranked 1, 2, and 3, respectively) versus corresponding C-indices. The correlation coefficients between single-modality and feature-level fusion ranks versus their C-indices were 0.19 and zero for radiomics and radiomics + clinical, respectively (p-values for significant correlation were 0.55 and 1.0), the correlation coefficients between individual and image-level fusion ranks versus their C-indices were 0.47 and 0.45 for radiomics and radiomics + clinical groups (p-values < 0.01 for both), and finally the correlation coefficients between feature- and image-level fusion ranks versus their C-indices were 0.44 and 0.42 for radiomics and radiomics + clinical, respectively (p-values = 0.01 for both).
Figure 6. Scatter plot of C-indices of (a) radiomics and (b) radiomics + clinical models based on their strategy (single-modality, feature- and image-level fusion). The correlation coefficients and their corresponding p-values indicating their statistical significance are also shown.
Download figure:
Standard image High-resolution image
Statistically significant differences between the performance of each radiomics model and its peer within radiomics + clinical models were determined in the VAS partition, and the corresponding p-values are presented in supplementary table S4. Out of a total of 39 radiomics models, in 14 models, the performance was significantly improved; in 13 other models, the performance was reduced, whereas the performance of the remaining 12 models did not differ significantly.
3.4. Effect of fusion parameters and number of discretized gray-levels on performance
In order to assess the effect of wavelet-fusion parameters (WBPF ratio, and CT-weight) and number of discretized gray-levels on the performance of the image-level fusion models, we performed Spearman's correlation between values of a specific parameter (for example 2/3, 1, 3/2 for WBPF ratios) and C-indices of the resulting models in order to see if there is any increasing or decreasing trend. The scatter plot of the results obtained from image-level fusion models along with trend-lines fitted on them is displayed as a function of different WBPF ratios (supplementary figure S7(a)), different CT-weights (supplementary figure S7(b)), and different number of discretized gray-levels (supplementary figure S7(c)). The correlation coefficients for C-indices versus WBPF ratios R, CT-weights W, and number of discretized gray-levels were −0.256, −0.122, and −0.099, respectively (p-values of significant difference with zero were equal to 0.197, 0.543, and 0.623, respectively).
4. Discussion
In this study, we investigated the prognostic value of multi-modality radiomics models toward overall survival prediction of NSCLC patients, by combining information obtained from PET and CT scans, at feature- and image-levels. We also assessed the additive prognostic value of these fusion models in comparison with single-modality radiomics models.
Overall, our results showed that PET/CT multi-modality radiomics models can provide enhanced prognostic performance, in comparison with models constructed with only PET or CT scans for NSCLC OS prognostication. At the same time, image-level fusion strategy was also able to generally outperform the best models from feature-level fusion strategy. Putting together the results from correlation tests of strategies presented in figure 6 and results of statistical comparison of models depicted in figure 5, and supplemental figure S6 reveals that although there are powerful feature-level fusion models such as AvgFea-64, this strategy does not generally increase the output (there is no significant overall correlation to C-indices; i.e. changing from single-modality to feature-level fusion multi-modality does not generally enhance the performance). On the contrary, for image-level fusion strategy, not only there are multiple models which significantly outperform the best of individual and feature-level fusion strategies, but there are also significant positive correlations overall, asserting that image-level fusion strategy can generally outperform other strategies (figure 6).
We assume that while a single intensity value related to a single voxel in fused scans cannot convey a clear physical or biological meaning (such as SUV in PET or HUs in CT images), their relation with the neighborhood voxels generates new patterns that are not visible in single scans, neither for human vision, nor for computerized quantitative interpretation. In the fused scans, a new texture is generated consisting of a mixture of intensity distribution of CT and PET scans. In other words, adjacency of the patterns related to the attenuation of x-rays in CT images (reflecting the anatomical information of the lesion), and the patterns regarding tracer uptake in PET images (reflecting metabolic information of the lesion) results in a synergic effect, which generates additive prognostic value in image-level fusion models. It also explains the superiority of image-level fusion toward decoding tumor characteristics over simply combining CT and PET features. The visualization of the tumor textures captured by CT, PET, and image-fusion model, as well as feature maps of NGTDM-busyness (one of the most repeated features) is depicted in figure 3 for a low- and high-risk patient. While the differences between high- and low-risk patients are not visible on PET or CT feature maps, the wavelet fusion discriminates visually between these patients.
In comparison with the clinical model, only some of the image-level fusion models had comparable and superior results. However, comparing multiple radiomics models to a single clinical model might introduce bias. In order to offset this bias, we also compared the average performance of the strategies with the clinical model (supplementary figure S6). Only image-level fusion strategy (average C-index = 0.646) had comparable results with the clinical model with C-index = 0.646 (p-value = 0.749). Moreover, our adopted strategy to avoid any probable bias in the comparisons was to validate the models on an independent test cohort with cycling train/test datasets, and reporting the average performance.
In our feature-popularity test we searched for features with the most repetitions among all models (supplementary figure S3). Some features were presented in more than 20 out of 39 radiomic models (including single- and multi-modality models). Our findings suggest that some popular features, not only are significantly prognostic, simultaneously in both single-modality PET and CT models, but also are able to unravel joint heterogeneities projected from PET and CT images into multi-modality fusion models and tailor them to the outcome of interest. These features provide prognostic information by decoding tumor heterogeneity in imaging modalities and postulating the underlying biology of tumors. For instance, the feature with the highest repetition was large distance high gray-level emphasis from GLDZM, which represents distant regions from the surface of the tumor with high intensity values (Zwanenburg et al 2016). This may be a representation of high metabolic and spatially deep regions that imply tumors, which can provide good oxygen, glucose, and nutrition supply to their deepest parts and prevent necrosis and hypoxia by neovascularization (Chicklore et al 2013, Lv et al 2019). Another popular feature, busyness from neighborhood grey tone difference matrix, represents textures with large changes in grey levels between neighboring voxels (Zwanenburg et al 2016), which might reflect the complex vascular environments within malignant neoplasms (Ganeshan and Miles 2013). Global intensity peak was another popular feature, which can be an alternative to SUVmax representing more metabolically active tumors.
We also compared features from image-level fusion models and individual PET or CT modalities, separately for images with 16, 32, and 64 quantized gray levels, and considered correlations higher than 0.8 significant. As shown in supplementary table S3, only ∼10 out of 182 features from PET and CT images were consistently correlated, suggesting that these two imaging modalities complement one another in capturing different aspects of disease. The number of significant correlations between features derived from fused images (equal weights of CT and PET) against PET features were higher compared to CT features, which means that wavelet fusion retains texture information more extensively from PET relative to CT.
We investigated the effect of adding two clinical parameters (TNM staging and histopathological grade) on the performance of different radiomic models by concatenating them to the selected radiomics signature (supplementary Table S4). The reduction of performance in some models may be due to the presence of redundancy of information and/or curse of dimensionality since we added clinical parameters to radiomics signature after feature selection. In addition, clinical parameters were not available for 28 subjects (15% of the whole dataset). Hence, the models being trained and/or tested on a reduced dataset may have resulted in reduced performance in some radiomics + clinical models. The performance of all three PET models was enhanced by adding clinical features, while the performance of 2 out of 3 CT models was reduced, whereas one CT model had no difference. We concluded that CT and clinical features may be redundant to each other, while PET features are independent from these clinical parameters. Overall, our results suggest that radiomics and clinical parameters may contribute complementary roles to one another and highlight the importance of using these different parameters along each other.
Two independent datasets were utilized in this study. As shown in table 1, these datasets are heterogeneous regarding patients' characteristics, such as sex and smoking status. Our models presented a robust behavior over these datasets despite the heterogeneities, hence demonstrating their generalizability. We also investigated the effect of cycling datasets on the performance of our models. Generally, models trained with VA dataset had better performance compared to models trained with Stanford (19 models in radiomics and 35 models in radiomics + clinical group had a better performance in VAS partition), which may be due to the fact that the percentage of events (deaths) in VA dataset was higher. Moreover, clinical parameters were not available for 28 patients in Stanford dataset which reduced the number of training subjects in SVA arrangement for radiomics + clinical models and led to low efficiency of these models in this partitioning arrangement (table S4).
We also assessed the effect of two wavelet-fusion parameters (CT weight and WBPF ratio) and the number of discretized gray-levels on the performance of image-level fusion models toward survival prediction in NSCLC patients (supplementary figure S7). None of these three parameters had significant correlations with resultant C-indices; although CT-weight of 0.5 had significantly higher results than other weights (p-values of Student's t-test for comparing average C-index of models with W = 0.5 to W = 0.25, 0.75 were 0.009 and <0.001, respectively). For other parameters there were no significant difference between average C-index of models with different values of these parameters. To sum up, diversity in the performance of models with different configurations of values of these three parameters highlights the importance of optimizing wavelet fusion parameters, in order to find the optimum model tailored to a specific purpose. Investigation of the impact of using various CT-weights in future studies is guaranteed.
To the best of our knowledge, this is first effort on extensive consideration of multi-modality future radiomics on NSCLC survival analysis study. In a study by Kirienko et al (2018), Cox proportional hazard regression model was applied to PET, CT, and PET/CT radiomics signature, with and without clinical parameters, toward disease free survival prediction in 295 NSCLC patients undergoing surgery. Since their results were reported for AUC (which requires a relative provisional time to event cut-off threshold) but not C-index (that preserves the continuous nature of time-to-event analysis), our results cannot be directly compared. However, they achieved AUC 0.75, 0.68, and 0.68 for CT, PET and PET/CT signature, while we achieved C-indices of 0.631, 0.635, and 0.625 for CT-64, PET-16, and ConFea-64, respectively. Adding clinical parameters to Cox proportional hazard model reduced their results to AUC's of 0.64, 0.61, and 0.65, for PET, CT, and PET/CT signature; our results were also reduced to 0.617, 0.605, and 0.605 for CT-64, PET-16 and ConFea-64. Moreover, the study conducted by Kirienko et al focused on single-modality and feature-level fusion, while we also studied image-level fusion strategies which resulted to significantly higher outputs (up to 0.735 in radiomics and 0.762 in radiomics + clinical groups, both in VAS partition).
In a deep learning study by Hosny et al (2018), a convolutional neural network (CNN) was applied to CT images of 1194 NSCLC patients. The prognostic signature was significantly associated with 2-year OS of patients undergoing radiotherapy (771 patients) and surgery (391 patients), with AUC values of 0.70 and 0.71, respectively. Their CNN model also significantly stratified patients into groups with low- and high-mortality risks in both surgery (p = 0.03) and radiotherapy (p < 0.001) treatment groups. In comparison, we achieved our best performance in radiomics group from an image-level fusion model, namely WF_R3/2_W1/2_16 (C-index = 0.689), which was also able to classify patients into dichotomized risk groups with log-rank p-value <0.001. The abovementioned work only focused on CT images, while our study sheds light on the additive prognostic potential of integrating information from two different modalities.
Two major limitations of this work were the limited size of the datasets and usage of non-harmonized feature-sets in spite of the involvement of two independent institutions and different vendors. However, we cycled the datasets as training and testing cohorts and reported the average results to increase the reproducibility over different centers. Further studies considering larger databases and utilizing robust harmonization methods are still required. In this study, we used image fusion based on 3D-DWT. Since the best results were achieved from image-level fusion models, more advanced techniques, such as deep learning image fusion methods, should be investigated in future studies. Moreover, matrix-level fusion for texture features which was not considered in this study should be evaluated. Although we utilized SERA package for feature extraction, which is compliant with IBSI guidelines, the repeatability and reproducibility of some features with respect to reconstruction and acquisition methods remains to be investigated (Edalat-Javid et al 2020, Shiri et al 2020a).
5. Conclusion
In this study, we proposed multi-modality radiomic models by integrating information extracted from 18F-FDG PET and CT images using feature- and image-level fusions, toward improved prognosis in NSCLC patients. Fusion radiomics efforts combining anatomical information from CT and metabolic information from PET can potentially enhance NSCLC prognostic performance. We found that while feature-level fusion may result in limited improvements, image-level fusion significantly increases performance and outperforms single-modality and feature-level fusion models. Moreover, only image-level fusion models were able to outperform the clinical model. The performance of wavelet fusion models is dependent on the specific configuration of a number of discretized gray-levels and wavelet fusion parameters.
Acknowledgments
This work was supported by the Shahid Beheshti University of Medical Sciences under Grant Number 9910076, the BC Cancer Foundation (Vancouver), and the Swiss National Science Foundation under Grant SNRF 320030_176052. The present article is financially supported by 'Research Department of the School of Medicine Shahid Beheshti University of Medical Sciences' (Grant No 9910076).