

Abstract
Objective. Laser plasma-based accelerators (LPAs) of protons can contribute to research of ultra-high dose rate radiobiology as they provide pulse dose rates unprecedented at medical proton sources. Yet, LPAs pose challenges regarding precise and accurate dosimetry due to the high pulse dose rates, but also due to the sources' lower spectral stability and pulsed operation mode. For in vivo models, further challenges arise from the necessary small field dosimetry for volumetric dose distributions. For these novel source parameters and intended applications, a dosimetric standard needs to be established. Approach. In this work, we present a dosimetry and beam monitoring framework for in vivo irradiations of small target volumes with LPA protons, solving aforementioned challenges. The volumetric dose distribution in a sample (mean dose value and lateral/depth dose inhomogeneity) is provided by combining two independent dose measurements using radiochromic films (dose rate-independent) and ionization chambers (dose rate-dependent), respectively. The unique feature of the dosimetric setup is beam monitoring with a transmission time-of-flight spectrometer to quantify spectral fluctuations of the irradiating proton pulses. The resulting changes in the depth dose profile during irradiation of an in vivo sample are hence accessible and enable pulse-resolved depth dose correction for each dose measurement. Main results. A first successful small animal pilot study using an LPA proton source serves as a testcase for the presented dosimetry approach and proves its performance in a realistic setting. Significance. With several facilities worldwide either setting up or already using LPA infrastructure for radiobiological studies with protons, the importance of LPA-adapted dosimetric frameworks as presented in this work is clearly underlined.
Export citation and abstract BibTeX RIS

Original content from this work may be used under the terms of the Creative Commons Attribution 4.0 licence. Any further distribution of this work must maintain attribution to the author(s) and the title of the work, journal citation and DOI.
1. Introduction
Small animal irradiation studies translate between fundamental research and clinical studies and hence are an important step in the development of new radiotherapy treatments (Baumann et al 2001, Butterworth 2019, Suckert et al 2021). In terms of dose application accuracy and dosimetry, the requirements for small animal irradiations are not less than those defined for patient treatment in a clinical setting. In fact, the mm to maximally cm-scales of target volumes and anatomical structures of small animal models require higher position accuracy for irradiation as well as higher spatial resolution for dosimetric devices (Ghita et al 2017).
For small animal studies with keV-photons, dedicated integrated imaging and irradiation systems enable targeted generation of small irradiation fields, high-resolution imaging, sample positioning, and conformal tumor irradiation (Clarkson et al 2011, Verhaegen et al 2011, Tillner et al 2016). For protons, irradiation studies are mainly performed at medical proton facilities where beam degrader systems and collimators reduce the beam's penetration depth and field size to the spatial scale of small animal models (Diffenderfer et al 2020, Suckert et al 2021). Lately, image-guided irradiation platforms for small animals have been integrated (Kim et al 2019, Schneider et al 2022) or are under development at proton sources (Parodi et al 2019). In addition to proton sources in clinical environments, laser plasma-based accelerators (LPAs) for protons are set up or operated for radiobiological experiments (Zhu et al 2019, Aymar et al 2020, Cirrone et al 2020, Rösch et al 2020, , Athena 2022, Bin et al 2022) and recently have been qualified for small animal irradiations in a pilot radiobiological study (Kroll et al 2022).
Medical cyclotron-based facilities provide quasi-continuous monoenergetic pencil beams with energies from 70 to 230 MeV Hueso-González 2015. In contrast, LPA proton sources provide individual proton pulses, limited by the typical maximal repetition rate of ∼1 Hz for state-of-the-art Petawatt laser systems (Wang et al 2017). The LPA proton pulses feature unique characteristics, such as broad exponentially decaying energy spectra with a maximum energy of up to ∼70 MeV (Ziegler et al 2021). Their emission pattern is conical with a ∼100 mrad half opening angle (Albert et al 2021). Additionally, LPA proton pulses have pulse durations in the order of a few picoseconds initially being accelerated at the source. After passing along a meter-scale transport distance, the pulse length is smeared out to a few tens of nanoseconds. In combination with particle numbers up to about 1012 protons per pulse, ultra-high dose rates of ∼109 Gy s−1 are achieved. This opens the path to investigate dose rate-dependent radiobiological effects such as the currently discussed FLASH effect (Esplen et al 2020, Diffenderfer et al 2022). Making use of LPA-dedicated beam selection and transport concepts (Brack et al 2020) and dedicated dose application schemes (Kroll et al 2022), the remaining challenges for small animal irradiations with LPA protons are beam monitoring and dosimetry. Characterization of mm-scale irradiation fields is challenging for all accelerator sources. Spatially-resolving dosimeters require sub-mm resolution, dosimeter alignment is critical and dose contribution from scattered radiation can play a major role. LPA proton pulses pose additional dosimetric challenges as the ultra-high dose rates lead to saturation effects in ionization chambers (Gotz et al 2017) commonly used for proton reference dosimetry (Andreo et al 2000).
In vitro cell-monolayer irradiations at proton LPAs have successfully been performed for over a decade (Yogo et al 2009, Kraft et al 2010, Yogo et al 2011, Bin et al 2012, Doria et al 2012, Zeil et al 2013, Raschke et al 2016, Bayart et al 2019, Bin et al 2022). Established dosimetric methods are calibrated radiochromic films (RCF) placed in most of the studies in front of or behind the sample during irradiation to provide information on dose and lateral dose distribution retrospectively (Chaudhary et al 2021). Occasionally, transmission ionization chambers (TIC) cross-calibrated against dose rate-independent detectors such as RCF and Faraday cups at the irradiation site have been applied for online dose monitoring (Richter et al 2011).
For in vivo irradiations of small animals at LPA sources, the dosimetric framework needs to be extended by the capability to characterize volumetric dose distributions, which can generally be decomposed into a mean dose in the target volume, a lateral component (lateral dose inhomogeneity) and a depth dose profile. The depth dose profile is determined by the spectral components contained in the proton pulse depositing its energy in the sample. For current LPA sources, pulse-to-pulse fluctuations of the spectral distribution are inherently present, leading to slightly different depth dose profiles for each dose application at the sample position. A beam monitoring system for volumetric irradiations consequently needs to provide spectral information of the proton pulses in transmission (i.e. with minimal interference to the pulse), with single pulse detection in addition to dose monitoring with TICs.
The first in vivo irradiations at an LPA source were performed with electrons where particle spectra allowing for the penetration depths required for in vivo models were available earlier on. In the respective experiment (Oppelt et al 2015), spectral characterization pre- and post-irradiation was performed with non-transmission measurement devices (volumetric scintillator, magnetic spectrometer). For protons compared to electrons, however, the depth dose profile is considerably more sensitive to spectral changes. Hence, the dosimetric setup presented here uses a scintillator-based transmission time-of-flight (ToF) spectrometer to monitor the proton spectrum during the in vivo sample irradiation. This technique allows to quantify spectral fluctuations and provides, assisted by Monte Carlo simulations, the resulting changes in the depth dose profile at the irradiation site on a pulse-to-pulse basis.
The following section lays out the individual parts and the workflow of our dosimetric framework for in vivo irradiations with LPA protons. In section 3, the setup's capabilities are demonstrated in a specific case, i.e. the first mouse irradiation pilot study at a proton LPA source (Kroll et al 2022). In this way, we showcase our framework as viable for precise dose delivery monitoring and dosimetric characterization, successfully tackling one of the main challenges of using LPA sources for radiobiology.
2. Dosimetric framework
The presented dosimetric framework for in vivo irradiation experiments at proton LPA sources is applicable to a broad range of scenarios from single pulse to multi-pulse dose application schemes with single pulse dose ranging from sub-Gy to multi-10 Gy (Kroll et al 2022). It is optimized for dosimetry of mm-scale volumetric dose distributions and intercepts the specific challenges of dosimetry for such dose distributions at LPA sources, i.e. ultra-high pulse dose rates and pulse-to-pulse spectral as well as intensity fluctuations.
Goal of the framework is to measure the mean dose applied to the target volume (TV), DTV, with the uncertainty ΔDTV, together with the lateral and depth dose inhomogeneity,  and
and  . The latter quantify the deviation from a spatially homogeneous dose distribution with a percent-value of the mean dose. The dose information can hence be summarized as:

The dosimetric framework is illustrated in figure 1. Figure 1(a) shows the workflow, i.e. the sequence of four steps taken to arrive at the mean dose applied to the TV with according uncertainties (equation (1)). Figure 1(b) illustrates the flow of dosimetric information and interplay of dosimetric devices to yield the mean dose applied to the TV. Figure 1(b) furthermore indicates the classification of the dosimetric devices according to whether they are operated in transmission along the incoming proton beam path (dashed boxes) or whether they are non-transmission detectors applied at the irradiation site (full-line boxes). The classification according to single pulse resolution (green boxes) versus pulse accumulation (orange boxes) for the applied detectors is also encoded.

Figure 1. The dosimetric framework for performing radiobiological in vivo studies at laser plasma-based accelerators (LPAs) for protons. It provides the applied dose distribution in the target volume (TV) in terms of the mean dose value and its corresponding lateral and depth inhomogeneity. (a) The workflow within the dosimetric framework. (b) A schematic sketch of the dosimetric framework with the detectors applied: time-of-flight spectrometer (ToF), transmission ionization chamber (TIC), radiochromic films (RCFs) and advanced Markus chamber (AMC). Arrows indicate the interplay of the data taken from the detectors for cross-calibration (black arrows) or to generate the final TV dose information (colored arrows).
Download figure:
Standard image High-resolution imageThe rationale for the applied detector classes is derived from the requirement to tackle the LPA source challenges. Pulse-to-pulse spectral and intensity fluctuations are monitored with single pulse-resolving transmission detectors. A transmission ionization chamber (TIC) monitors the single pulse intensity and a time-of-flight spectrometer (ToF) provides the proton pulse spectrum. The TIC is cross-calibrated against a saturation-corrected advanced Markus chamber (AMC) to measure the dose applied to the TV. The single pulse-resolving but dose rate-dependent detectors (TIC, AMC) are complemented with dose rate-independent but accumulative radiochromic film (RCF) measurements. A single RCF (sRCF) placed in front of the TV serves as a transmission detector during a sample irradiation and provides the lateral dose distribution accumulated over all irradiating pulses. For the final TV mean dose information, dose rate-dependent measurements (TIC) are combined with dose rate-independent measurements (single RCF), in this way minimizing potential saturation effects from ultra-high dose rate pulses.
The detailed description of the dosimetric framework following the workflow steps (i) to (iv) listed below is given in the next sections.
- (i)Verification of the volumetric dose distribution
- (ii)Cross-calibration of the transmission detectors and quality assurance of the dose measurements
- (iii)Sample irradiation with synchronous beam and dose monitoring
- (iv)Evaluation of the applied volumetric dose distribution
For better readability, table 1 summarizes all acronyms and formula symbols used in the text.
Table 1. Summary of all dosimetric devices applied within the dosimetric framework, the according acronyms, and the derived dosimetric quantities including a short definition.
| Device (acronym) | Dosimetric quantity | Definition |
|---|---|---|
| radiochromic film stack (RCF) | DRCF TV | measured mean target volume (TV) dose |

| measured lateral dose inhomogeneity of TV | |

| measured lateral dose inhomogeneity of ith film of stack | |

| measured depth dose inhomogeneity of TV | |
| single radiochromic film (sRCF) | DsRCF | measured dose at reference depth position |
| DsRCF TV | mean TV dose depth-corrected with ToF from single RCF measurement at reference depth position | |
| ΔDsRCF,lat | measured lateral dose inhomogeneity at reference depth position | |
| advanced Markus chamber (AMC) | DAMC | measured dose at reference depth position laterally averaged over the TV |
| transmission ionization chamber (TIC) | DTIC | measured dose at reference depth position from cross-calibration to AMC |
| DTIC TV | mean TV dose depth-corrected with ToF from TIC measurement at reference depth position | |
| time-of-flight spectrometer (ToF) | DToF TV | predicted mean TV dose from spectral measurement with ToF |
| DToF,i | predicted dose of ith layer of virtual RCF stack laterally averaged over the TV | |
2.1. Verification
The spatially-resolved characterization of the volumetric dose distribution in the TV in terms of mean dose as well as lateral and depth dose inhomogeneity is performed to verify compliance with the radiobiological model's requirements. Therefore, calibrated RCFs in a stacked configuration placed at the irradiation site are used, with each single RCF measuring the lateral dose distribution at its corresponding depth position. For each RCF, the dose is averaged over a region of interest (ROI) fitting the lateral size of the TV. Averaging over the mean dose values of all RCFs within the TV yields the mean dose in the TV as DRCF
TV. The dose inhomogeneity of a lateral dose distribution is defined as the 2σ standard deviation of the dose values inside the lateral ROI. To obtain the lateral dose inhomogeneity in the TV,  , the obtained lateral 2σ standard deviations from all RCFs inside the TV are averaged. The depth dose inhomogeneity
  is given by the 2σ standard deviation of the mean dose values averaged over the lateral ROI for each RCF within the TV. Note that if not mentioned differently, all uncertainties are given as 2σ values, to ensure that the measured value lies within the uncertainty interval with a 95% probability. The retrospective measurement of the accumulated dose using RCF stacks is complemented by a dose measurement with a saturation-corrected AMC placed at the irradiation site. It provides online single pulse dose values at a reference depth position averaging over its sensitive volume dimension.
2.2. Cross-calibration and quality assurance
During sample irradiations, direct dosimetry of the irradiated volume with the detectors placed at the irradiation site is impossible. Therefore, the dose application is simultaneously monitored online with single pulse resolution using two transmission detectors placed one after another along the beamline (ToF, TIC). Both are cross-calibrated against the non-transmission detectors placed at the irradiation site (RCF stack, AMC).
A scintillator-based transmission ToF spectrometer measures the proton energy spectrum. Using this spectral information as input, Monte Carlo simulations are performed to predict the depth dose profile at the irradiation site (in arbitrary units). To gain quantitative dose data, the simulated depth dose profile is calibrated against the measured depth dose profile provided by the RCF stack measurements at the irradiation site.
For single pulse online dose monitoring, a TIC is cross-calibrated against a saturation-corrected AMC at the irradiation site.
For dosimetric quality assurance during in vivo sample irradiations, the verification and cross-calibration measurements are repeated prior to each irradiation, ensuring a consistent dose distribution and confirming the cross-calibration of the transmission detectors.
2.3. Mouse irradiation and evaluation of the applied dose
The in vivo sample irradiation is performed with a single or multiple proton pulses. In the latter case, the irradiation is terminated when the accumulated dose fits the prescribed dose within the accuracy requirement of the radiobiological model. This information is obtained online by the TIC. The single pulse dose values DTIC monitored by the TIC also represent one of the two independent dose measurements performed during the in vivo sample irradiation. The potentially dose rate-dependent online TIC measurements are complemented by a dose rate-independent measurement of the accumulated dose, DsRCF, using a single RCF in front of the TV.
Both dose values do not represent the volume dose (i.e. mean dose in the TV), but the dose at specific reference depth positions of the depth dose profile. To obtain the mean dose in the TV, a depth correction with the depth dose profile predicted by the ToF spectrometer is performed.
The dose evaluation step is illustrated in figure 1(b) by arrows indicating how each dosimetric device applied within the framework contributes to the final dose information (equation (1)) for a sample irradiation. It works as follows: the mean dose applied to the TV, DTV, is calculated with the depth-corrected dose values obtained by the TIC, DTIC
TV, and the single RCF, DsRCF
TV, weighted by their uncertainty values  and
and  . The combination of the two independent dose values DTIC
TV and DsRCF
TV reduces the uncertainty of the TV dose value DTV and minimizes remaining dose rate-dependent influences from the saturation-corrected AMC used for cross-calibration of the TIC.
. The combination of the two independent dose values DTIC
TV and DsRCF
TV reduces the uncertainty of the TV dose value DTV and minimizes remaining dose rate-dependent influences from the saturation-corrected AMC used for cross-calibration of the TIC.
The lateral dose inhomogeneity is derived from the single RCF irradiated in front of the TV and the RCF stack irradiated for quality assurance. The 2σ standard deviation of the dose distribution obtained with the single RCF inside the lateral ROI yields the lateral dose inhomogeneity ΔDsRCF,lat. To calculate the lateral dose inhomogeneity inside the TV,  , the following relation is used:

Here, ΔDRCF,1,lat and  represent the lateral dose inhomogeneity within the first film position and in the TV measured by the quality assurance RCF stack. This step accounts for the fact that the first RCF layer might be subjected to a lower lateral dose homogeneity due to scattering effects of protons at the aperture defining the lateral TV size. The depth dose inhomogeneity,
  , is calculated as the 2σ standard deviation of the depth dose profile predicted by the ToF spectrometer.
3. Mouse irradiation study
3.1. Radiobiological model and dose application scheme
The dosimetric framework was applied to a small animal model which uses a spherical tumor with a diameter of ∼3 mm superficially grown on a mouse ear (Brüchner et al
2014, Beyreuther et al
2017). The target volume TV is defined as a cylinder with 5 mm diameter and 4 mm water-equivalent depth to ensure the irradiation of the complete tumor. The prescribed homogeneous dose to the TV is 4 Gy, to be applied with a maximum deviation of ±10% and at a dose rate of at least  with a maximum lateral and depth dose inhomogeneity of ±10%. To achieve the required accuracy for dose application and to cope with the LPA proton pulse intensity fluctuations, the prescribed dose is applied via an accumulative multi-pulse scheme (Kroll et al
2022). Single pulse doses are tuned to 330–800 mGy, so that the full accumulated irradiation dose is achieved within 6–9 pulses. The irradiation of a mouse is terminated when the desired target dose is reached within the required accuracy. The dosimetric characterization of the 7 mice forming the irradiation group within the LPA proton cohort of the pilot study will be detailed in the following (Kroll et al
2022).
with a maximum lateral and depth dose inhomogeneity of ±10%. To achieve the required accuracy for dose application and to cope with the LPA proton pulse intensity fluctuations, the prescribed dose is applied via an accumulative multi-pulse scheme (Kroll et al
2022). Single pulse doses are tuned to 330–800 mGy, so that the full accumulated irradiation dose is achieved within 6–9 pulses. The irradiation of a mouse is terminated when the desired target dose is reached within the required accuracy. The dosimetric characterization of the 7 mice forming the irradiation group within the LPA proton cohort of the pilot study will be detailed in the following (Kroll et al
2022).
3.2. Laser-plasma acceleration source and beamline
The experiment was performed at the LPA proton beamline ALBUS-2S (Brack et al 2020), which is installed at the DRACO Petawatt laser system at Helmholtz-Zentrum Dresden-Rossendorf (HZDR) (Schramm et al 2017, Ziegler et al 2021). ALBUS-2S consists of an LPA proton source, a beam selection and transport system and an in-air irradiation site with beam monitoring and dosimetry setup (figure 2(a)). The beamline is operated in a pulsed mode, which is well-suited to the pulsed nature of the LPA source. In standard performance, the LPA source can be operated at 3 proton pulses per minute (Kroll et al 2022).

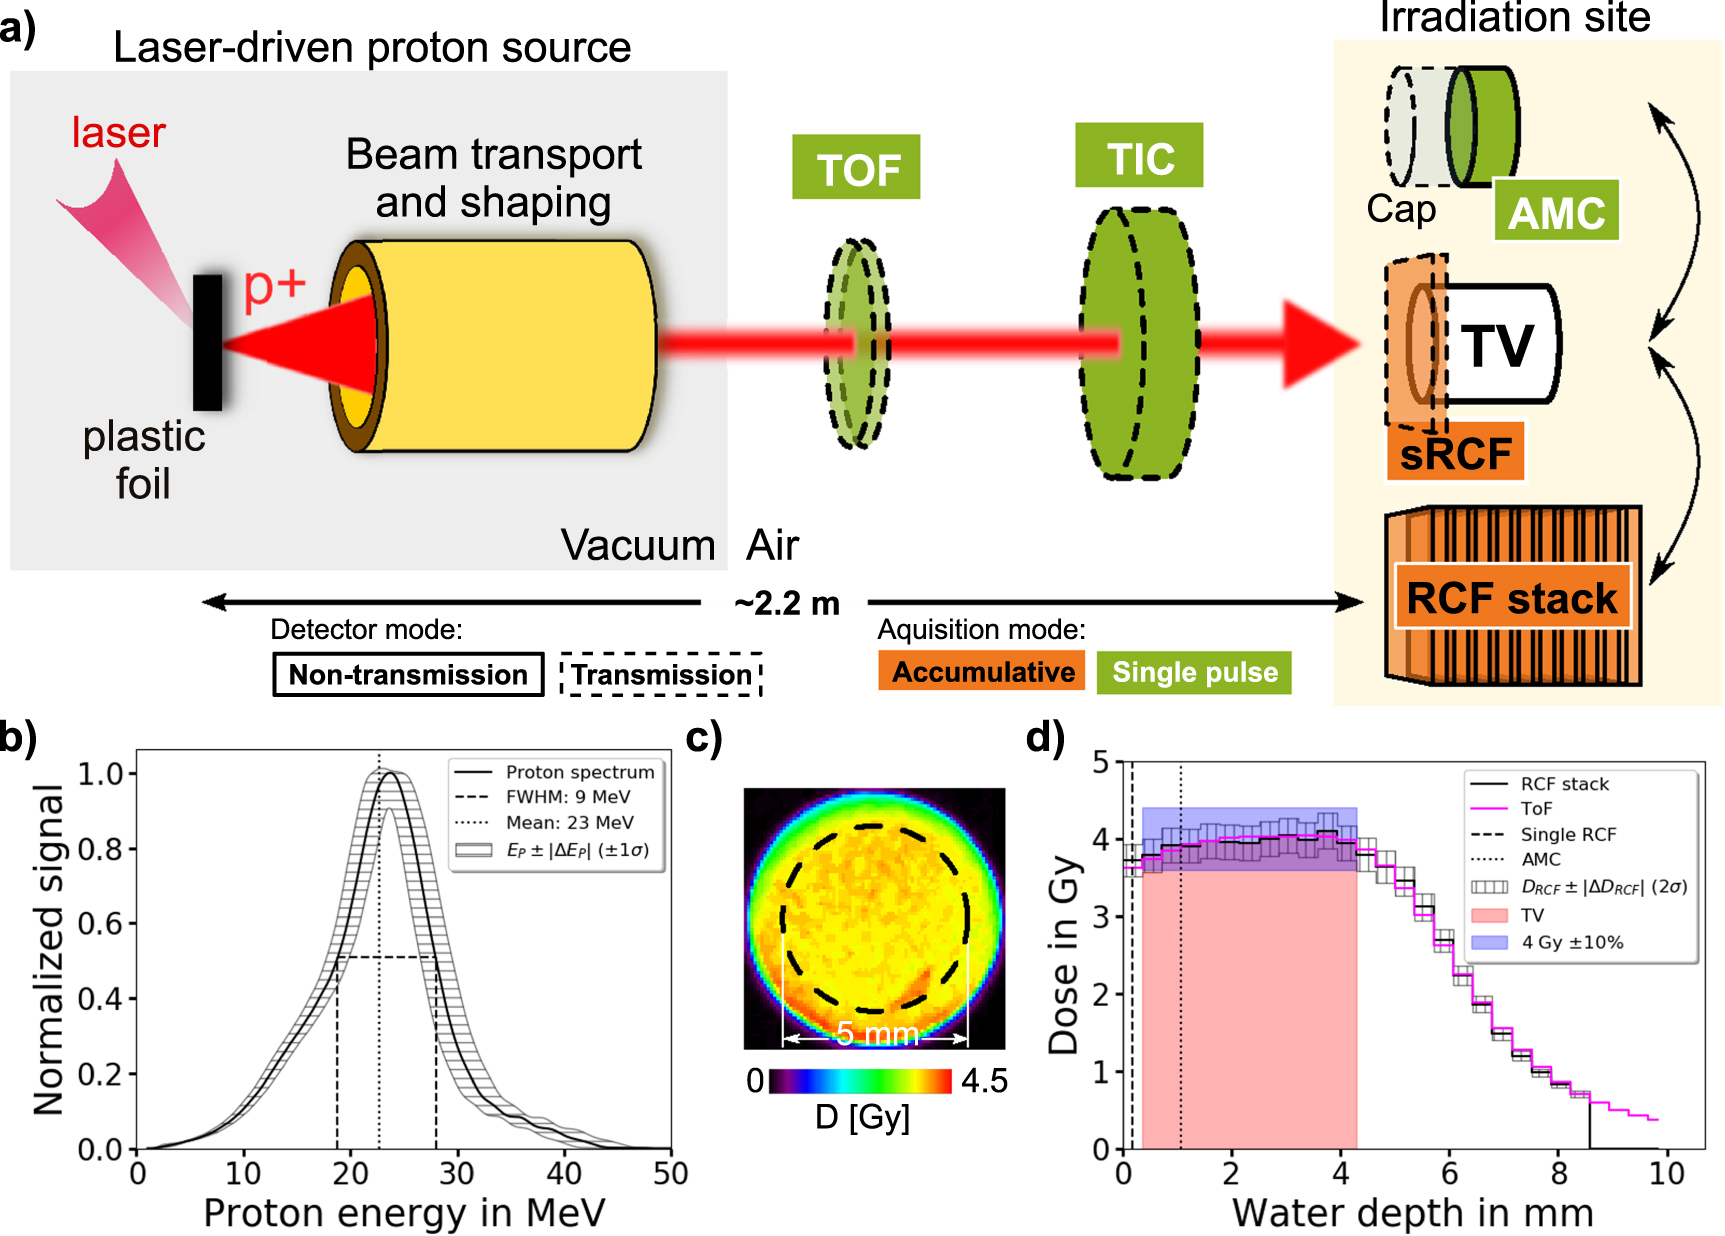
Figure 2. Setup and operation of the dosimetric system installed at the ALBUS-2S beamline to monitor the dose applied to the in vivo sample located at the irradiation site. (a) The proton beamline ALBUS-2S consists of the LPA proton source (DRACO PW laser is focused on a sub-micrometer thick plastic foil), a proton beam transport and shaping system and the detectors for dosimetry and beam monitoring. The monitoring detectors include a ToF spectrometer, a TIC and a single RCF, all located in front of the irradiation site. The AMC and RCF stacks are located at the irradiation site for cross-calibration of the transmission detectors before the in vivo sample irradiation. (b) The accumulated and transported normalized proton energy spectrum with its mean energy (black dotted line) and full width at half maximum (black dashed line) measured with the ToF spectrometer during an RCF stack irradiation. (c) The accumulated lateral dose distribution measured by the first RCF of the stack. The dashed line shows the 5 mm ROI covering the lateral dimension of the TV. (d) The accumulated water depth dose profile inside the lateral 5 mm ROI measured with an RCF stack (black solid line). The uncertainty of ±5.6% (±2σ) of the dose is resulting from the RCF calibration uncertainty. The prediction of the accumulated depth dose profile with the ToF spectrometer (magenta solid line) is overlayed on the depth dose profile measured by the RCF stack. The TV region (red area), the dose accuracy requirement of the tumor model (blue area) and reference depth of the dose measurements from the single RCF (black dashed line) and the AMC (black dotted line) are marked.
Download figure:
Standard image High-resolution imageThe volumetric cylindrical dose distributions at the irradiation site - as defined above - is formed by actively selecting and transporting all spectral components required for dose coverage of the TV. This is achieved by tuning the chromatic focussing properties of the two pulsed solenoid magnets in the proton beamline. Further passive spectral filtering with apertures and scattering foils finetunes the transported spectrum to an asymmetric shape with a mean energy of 23 MeV and a full width at half maximum of 9 MeV (figure 2(b)). The total proton pulse duration amounts to 20 ns at the irradiation site. The scattering foils additionally enhance the lateral dose homogeneity. A final aperture of 2 mm thick aluminium and 12 mm thick lead is placed directly in front of the TV and restricts the irradiated area to a circle with 7 mm diameter.
3.3. Dosimetric setup
The dosimetric setup and workflow follows the proton pulse along its path to the TV. After being emitted, transported and shaped, the proton pulse is transmitted through the beam monitoring system, consisting of a ToF spectrometer (Reimold et al 2022) and a TIC. Thereby, the detectors introduce an energy loss of less than 1 MeV to protons of >24 MeV kinetic energy. At the irradiation site, the accumulated volumetric dose distribution is detected with stacks of calibrated RCFs. Alternatively, an AMC provides the single pulse dose at a reference depth position. For a sample irradiation, when no detector can be in place at the TV, the accumulated dose applied to a mouse is additionally retrospectively derived from a calibrated single RCF placed in front of the mouse.
The accumulated spectral proton distribution of an RCF stack irradiation is shown in figure 2(b) and the resulting lateral dose distribution and depth dose profile are shown in figures 2(c)/(d). The dashed ring in the lateral beam profile in figure 2(c) marks the 5 mm diameter lateral ROI of the TV. The 4 mm depth of the TV (red region in figure 2(d)) is restricted to the homogeneous part of the depth dose profile. The dose accuracy requirement range of ±10% is marked in blue. In the utilized small animal model, the shallow dose fall-off behind the TV lies in air behind the mouse ear tumor and is thus not relevant for the mouse irradiation. The distal edge fall-off is here defined by the applied LPA beamline but can be steepeend to resemble clinically-applied distal dose distributions by using more complex beam filtering setups (Masood et al 2014).
3.3.1. Dose measurement with radiochromic films
RCFs, as self-developing, highly spatially resolving and thin stackable detectors, were used for the retrospective characterization of volumetric dose distributions. For the applied RCF type (EBT-3, GAFchromic, USA), the water-equivalent thickness per film layer and hence depth resolution in a stack is 364 μm, originating from the material thickness of 280 μm and a relative water-equivalent path length factor/stopping power ratio of 1.3 for the material (Beyreuther et al 2019). Our reached lateral spatial resolution is 85 μm, which originates from the 300 dpi scanning resolution of the dose readout process.
To reach an uncertainty below 10% for proton dose measurements, a reference calibration for the specific RCF batch used in the experiment was performed at the experimental proton beamline at the medical cyclotron of the University Proton Therapy Dresden facility (Helmbrecht et al 2016). For the calibration, the RCFs were located in the middle of a spread-out Bragg peak generated with 150 MeV protons, scatterers, a ripple filter and apertures. The dose range from 0.5 to 15 Gy was calibrated against the dose-dependent optical density increase of the RCFs, which was evaluated with a scanner (Epson Expression 11000XL, Epson, Germany) for the red color channel (Micke et al 2011). To remove the random noise from the scanning process, a median filter with a kernel size of 3 pixels was applied to the obtained lateral dose distributions. The resulting relative RCF dose calibration uncertainty at 4 Gy is 5.6%. This value takes into account all sources of uncertainty arising in the calibration process, i.e. the uncertainty of the AMC applied for dosimetry, variations within the RCF signal due to irradiation field, scanner and RCF material inhomogeneities as well as the uncertainty of the final fitted calibration curve.
3.3.2. Dose measurement with an advanced Markus chamber
The air-filled AMC (type 34045, PTW, Germany) has a cylindrical sensitive volume of 5 mm diameter and 1 mm depth and covers the lateral dimension of the TV. It is read out with an electrometer (UNIDOS webline, PTW, Germany). The AMC has a protection cap of 1.06 mm water-equivalent thickness, resulting in a dose measurement at this depth (figure 2(d)). The measured dose DAMC is calculated from the following relation:

Here, QAMC is the measured ionization charge,  is the instrument calibration factor for absorbed dose to water for 60Co photon irradiation, kQ,prot = 0.997 ± 0.042 is the radiation quality correction factor for protons (Gomà et al
2015) and kD the density correction factor as calculated from the air temperature and pressure in the room during the irradiation. The average air density correction factor is given by
is the instrument calibration factor for absorbed dose to water for 60Co photon irradiation, kQ,prot = 0.997 ± 0.042 is the radiation quality correction factor for protons (Gomà et al
2015) and kD the density correction factor as calculated from the air temperature and pressure in the room during the irradiation. The average air density correction factor is given by  and it varies by less than 1% over all 7 mouse irradiations in our pilot study.
Due to the ultra-high dose rate of the utilized LPA pulses of  , a saturation correction factor kS is required to account for charge recombination in the sensitive volume of the AMC. Experimental values that were acquired for ultra-high dose rate irradiation with electrons indicate that charge recombination becomes non-negligible for dose rates ≳104 Gy s−1 (Gotz et al
2017). Here, the value of kS is derived from a linear fit to the data published by Gotz et al (2017), which is valid for a single pulse ionization charge QAMC between 0.2 and 0.6 nC:
, a saturation correction factor kS is required to account for charge recombination in the sensitive volume of the AMC. Experimental values that were acquired for ultra-high dose rate irradiation with electrons indicate that charge recombination becomes non-negligible for dose rates ≳104 Gy s−1 (Gotz et al
2017). Here, the value of kS is derived from a linear fit to the data published by Gotz et al (2017), which is valid for a single pulse ionization charge QAMC between 0.2 and 0.6 nC:

The fit parameters are  and
and  . With the corrections applied, the AMC provides the dose value DAMC at 1.06 mm water-depth in the TV for single proton pulses. The resulting relative uncertainty of the measured dose value DAMC is 5.7%, which considers the uncertainty of the AMC calibration and correction factors NW,0, kQ,prot, kD and kS.
3.3.3. Online dose monitoring with a transmission ionization chamber
The TIC (type 7862, PTW, Germany) is optimized for operation in transmission and measures the ionization charge QTIC that is produced in its sensitive volume by the traversing proton pulse. The uncertainty of the QTIC measurement is < ±0.5% ±1 digit, originating from the UNIDOS electrometer. The digit uncertainty translates into a relative uncertainty of 0.2–0.6% for the considered QTIC values. Figure 3(a) shows the cross-calibration of the TIC to the AMC. The ionization charge QTIC and the measured dose DAMC show a linear relation, which is consistent over consecutive experimental days. For the linear model

a least square fit to the measured data yields  and bIC = (−0.239 ± 0.012) Gy. Here, DTIC is the dose applied at the irradiation site in 1.06 mm water depth, that is obtained by QTIC. The resulting relative uncertainty of DTIC is calculated to 8.2%. The uncertainty includes the fit parameter uncertainty as well as the relative uncertainty of the measured dose value DAMC of 5.7%. The applied single pulse dose is monitored by DTIC. As shown in figure 3(b), during mouse irradiation the single pulse dose values are accumulated and the irradiation is terminated when the accumulated dose reaches a value of 4 Gy within the ±10% accuracy window (green area). Note that the depth-corrected dose DTIC
TV for mouse 1 is slightly outside the prescribed dose window but the final dose value DTV also taking into account the dose measurements with the single RCF (DsRCF
TV) was consistent with the model-required dose (figure 5(a)).
and bIC = (−0.239 ± 0.012) Gy. Here, DTIC is the dose applied at the irradiation site in 1.06 mm water depth, that is obtained by QTIC. The resulting relative uncertainty of DTIC is calculated to 8.2%. The uncertainty includes the fit parameter uncertainty as well as the relative uncertainty of the measured dose value DAMC of 5.7%. The applied single pulse dose is monitored by DTIC. As shown in figure 3(b), during mouse irradiation the single pulse dose values are accumulated and the irradiation is terminated when the accumulated dose reaches a value of 4 Gy within the ±10% accuracy window (green area). Note that the depth-corrected dose DTIC
TV for mouse 1 is slightly outside the prescribed dose window but the final dose value DTV also taking into account the dose measurements with the single RCF (DsRCF
TV) was consistent with the model-required dose (figure 5(a)).

Figure 3. The pulse dose monitoring with the TIC provides the TV dose and the information when to terminate the mouse irradiations, online. (a) The dose calibration curve of the TIC as calculated with the measured dose values DAMC at the irradiation site by the AMC and the corresponding ionization charge values QTIC from the TIC. The ±2σ uncertainty band is resulting from the least square fit uncertainty. (b) Accumulation of the single pulse dose values that are monitored by the TIC. Each mouse irradiation is represented by a bar. The colored boxes represent each single pulse dose applied to the mouse. When the accumulated dose reached the targeted dose range (marked in green), the irradiation was terminated.
Download figure:
Standard image High-resolution image3.3.4. Depth correction with a time-of-flight spectrometer
The signal-generating part of the ToF spectrometer is a 200 μm thin plastic scintillator plate (BC-422, Saint-Gobain, France). The scintillation light is induced by the traversing protons and collected via an optical fiber (FP1000URT, Thorlabs, USA), which points onto the center of the 1.4 cm diameter sensitive area under a 45° degree angle. The 15 m long fiber is connected to a photodiode detector (FDP 310-FC-VIS, Menlo-Systems, Germany, with S5973-01 photodiode, Hamamatsu, Japan) that converts the scintillator light signal into a voltage signal, which is readout by a fast oscilloscope (MSO64, Tektronix, USA). The obtained proton flight time signal is used to calculate the proton energy spectrum with a relative energy uncertainty of 5.5% (1σ), as shown in figure 2(b). Monitoring the proton spectrum of each single proton pulse enables the quantification of pulse-to-pulse fluctuations, inherent to all LPA sources. Additionally, potential beamline malfunctions can be identified immediately. This novel development for LPA proton beam monitoring represents an important step towards enabling the first in vivo LPA irradiation study, the interested reader can find more details on the ToF spectrometer in Reimold et al (2022). Since irradiation studies ultimately require information about the depth dose profile, the depth dose profile is calculated in a virtual RCF stack at the irradiation site via FLUKA Monte Carlo simulations (Battistoni et al 2016) based on the measured proton energy spectrum together with the proton beam diameter and divergence. Table 2 and figure 4 summarize the simulation input parameters and the simulation output. The obtained depth dose profile is validated by calibration against the measured depth dose profile from a simultaneously irradiated reference RCF stack at the irradiation site (figure 2(d)).
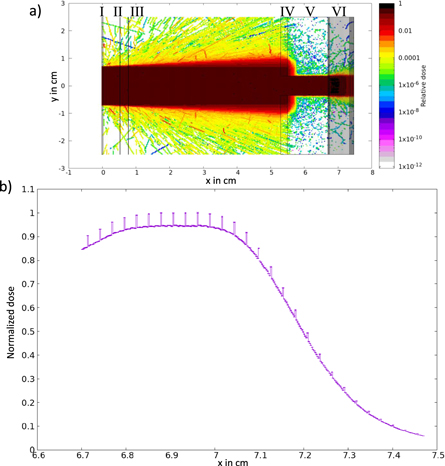
Figure 4. FLUKA Monte Carlo simulations. (a) Two-dimensional cutplane of the implemented geometry. I is the 200 μm thick plastic scintillator of the ToF spectrometer, II and III are two 100 μm thick Kapton slices representing the TIC, IV is a 2 mm thick aluminum aperture with a 7 mm diameter opening, V is a 12 mm thick lead aperture with a 7 mm diameter opening and VI is a stack of 28 RCFs. The complete geometry is surrounded by air. Except for the RCFs, all used materials are predefined in FLUKA (Ferrari et al 2005). The RCF consists of a 25 μm thick active layer protected by two 125 μm polyester layers. The materials are defined in Palmer et al (2015). (b) The simulated depth dose profile inside the lateral 5 mm diameter ROI of the RCF stack for a proton spectrum measured with the ToF spectrometer. The dose spikes originate from the material of the active layer of the RCFs. They represent the effective measurement positions of the RCF stack. The uncertainty bars show the statistical uncertainty of the simulated normalized dose values which is ±0.16% (±1σstat).
Download figure:
Standard image High-resolution imageTable 2. Summary of parameters used in the Monte Carlo simulations, based on the recommendation of the AAPM Research Committee Task Group 268 (Sechopoulos et al 2018).
| Item | Description | References |
|---|---|---|
| code, version/release date | FLUKA, 4.0.0/June 2020 | |
| validation | medical applications of FLUKA | Battistoni et al (2016) |
| timing | 1.5 CPU h (1.6 · 107 protons) i5-8350U CPU @ 1.70 GHz | |
| source | homogeneous circle with 1.4 cm diameter (ToF aperture) | |
| half beam divergence angle of 3 ◦ | ||
| uniform energy sampling from 1 to 50 MeV | ||
| energy-dependent particle weight using measured spectrum | ||
| physics and transport | defaults: HADRONTHE | Ferrari et al (2005) |
| scored quantities | deposited dose using USRBIN (1D binning) | Ferrari et al (2005) |
| lateral: 5 mm circle | ||
| depth: 25 μm bins | ||
| primaries/ stat. uncertainty | 1.6 · 107 protons/0.16% (1σstat) | |
| statistical method | default cycle-by-cycle method of FLUKA/FLAIR | |
| post processing | multiplication of RCF depth with 1.3 (RCF water-equivalent path length) | Beyreuther et al (2019) |
| result | water depth dose profile for measured spectrum |
Based on the accumulated depth dose profile from the ToF spectrometer, the depth dose inhomogeneity in the TV is predicted non-invasively. Moreover, the data is used to perform a depth correction on the dose measurements that are acquired at different reference depth positions by the TIC and single RCF, respectively, to obtain the mean dose in the TV (figure 2(d)).
The principle is explained in the following. DTIC represents the dose that approximately corresponds to the water-equivalent depth of the film at position 4 in an RCF stack. To obtain the dose in the TV, DTIC TV, a depth correction factor kTIC is calculated via the depth dose profile predicted by the ToF spectrometer:

DToF TV is the mean predicted dose value from film position 2 to 12, which represents the TV. DToF,4 is the predicted dose value at film position 4. The relative uncertainty of the correction factor is 7.9%, which results from the uncertainty of the dose values DToF TV and DToF,4 of 5.6%, each. With the correction factor kTIC, the applied actual dose to the TV DTIC TV is:

The relative uncertainty for DTIC TV is 11.4%.
Analogously, ksRCF, the depth correction factor of the dose measured by the single film in front of the TV (DsRCF) is determined via:

DToF,1 is the predicted dose value at the RCF stack film position 1. The relative uncertainty of the correction factor is again 7.9%. The dose value applied to the TV of the single RCF in front of the mouse ear tumor, DsRCF TV, is

with a relative uncertainty of 9.7%. It results from the dose uncertainty of DsRCF of 5.6% and the uncertainty of the scaling factor of ksRCF of 7.9%. The calculated correction factors kTIC and ksRCF average to 1.01 and 1.10 (see table 3).
Table 3. The depth correction factors kTIC and ksRCF are required to calculate the mean dose in the TV from the dose values which are measured by the TIC and the single RCF (sRCF) in front of the sample. They are calculated from the depth dose profile in a virtual RCF stack that is obtained with accumulated ToF spectrometer data and Monte Carlo simulations.
| Mouse number | 1 | 2 | 3 | 4 | 5 | 6 | 7 | Mean |
|---|---|---|---|---|---|---|---|---|
| kTIC | 1.00 | 1.01 | 1.01 | 1.02 | 1.00 | 1.03 | 1.01 | 1.01 |
| ksRCF | 1.09 | 1.09 | 1.08 | 1.11 | 1.08 | 1.13 | 1.11 | 1.10 |
4. Results and discussion
Based on the presented dosimetric framework, the dose application to 7 mice and the corresponding dosimetry was performed, with the dosimetric results summarized in figure 5. The mouse-specific dose values as obtained with the single RCFs and the TIC, together with the uncertainty-weighted mean dose value, are shown in figure 5(a). On average, a dose of  was applied to the entire LPA cohort of the study. The mean absolute difference of the individual TV dose values to the mean dose value
  is determined to 0.17 Gy, i.e. 4.3% of
  . The lateral and depth dose inhomogeneity
  and
and  are averaged to 7.3% laterally and 5.4% in depth for all mice. All volumetric dose distributions that were applied to the TVs of the mice fulfill the accuracy requirements of the tumor model (green area figures 5(a)/(b)).

Figure 5. Dosimetric results for the mouse irradiations. (a) The dose values of each TV irradiation are calculated as the uncertainty-weighted means of the dose values of the TIC and the single RCF after the ToF spectrometer-based depth correction. The ±2σ uncertainty of the dose values of the TIC, the single RCFs and the uncertainty weighted means is ±9.7%, ±11.4% and ±7.4%, respectively. (b) The relative lateral and depth dose inhomogeneity values inside the TV of each mouse. (c) Left y-axis: the single pulse dose values in the TVs (blue dots) as obtained by the TIC and the corresponding mean pulse dose values (black squares) with the statistical ±2σ standard deviation depending on the total pulse number. Right y-axis: the differences between the accumulated dose values that are obtained by single RCF and TIC as shown in (a) are plotted in red to illustrate the dependency on the mean pulse dose and total pulse number. (d) Gaussian fit to the frequency distribution of the pixel dose values in the lateral ROI of the TV as measured with the single RCFs in front of each mouse. The histogram representing the frequency distribution of the pixel dose values for mouse 7 is plotted in grey. (e) Normalized depth dose profiles for each mouse are obtained by the ToF spectrometer on the basis of accumulated ToF proton spectra in the form of a virtual RCF stack. The TV is marked by the red area.
Download figure:
Standard image High-resolution image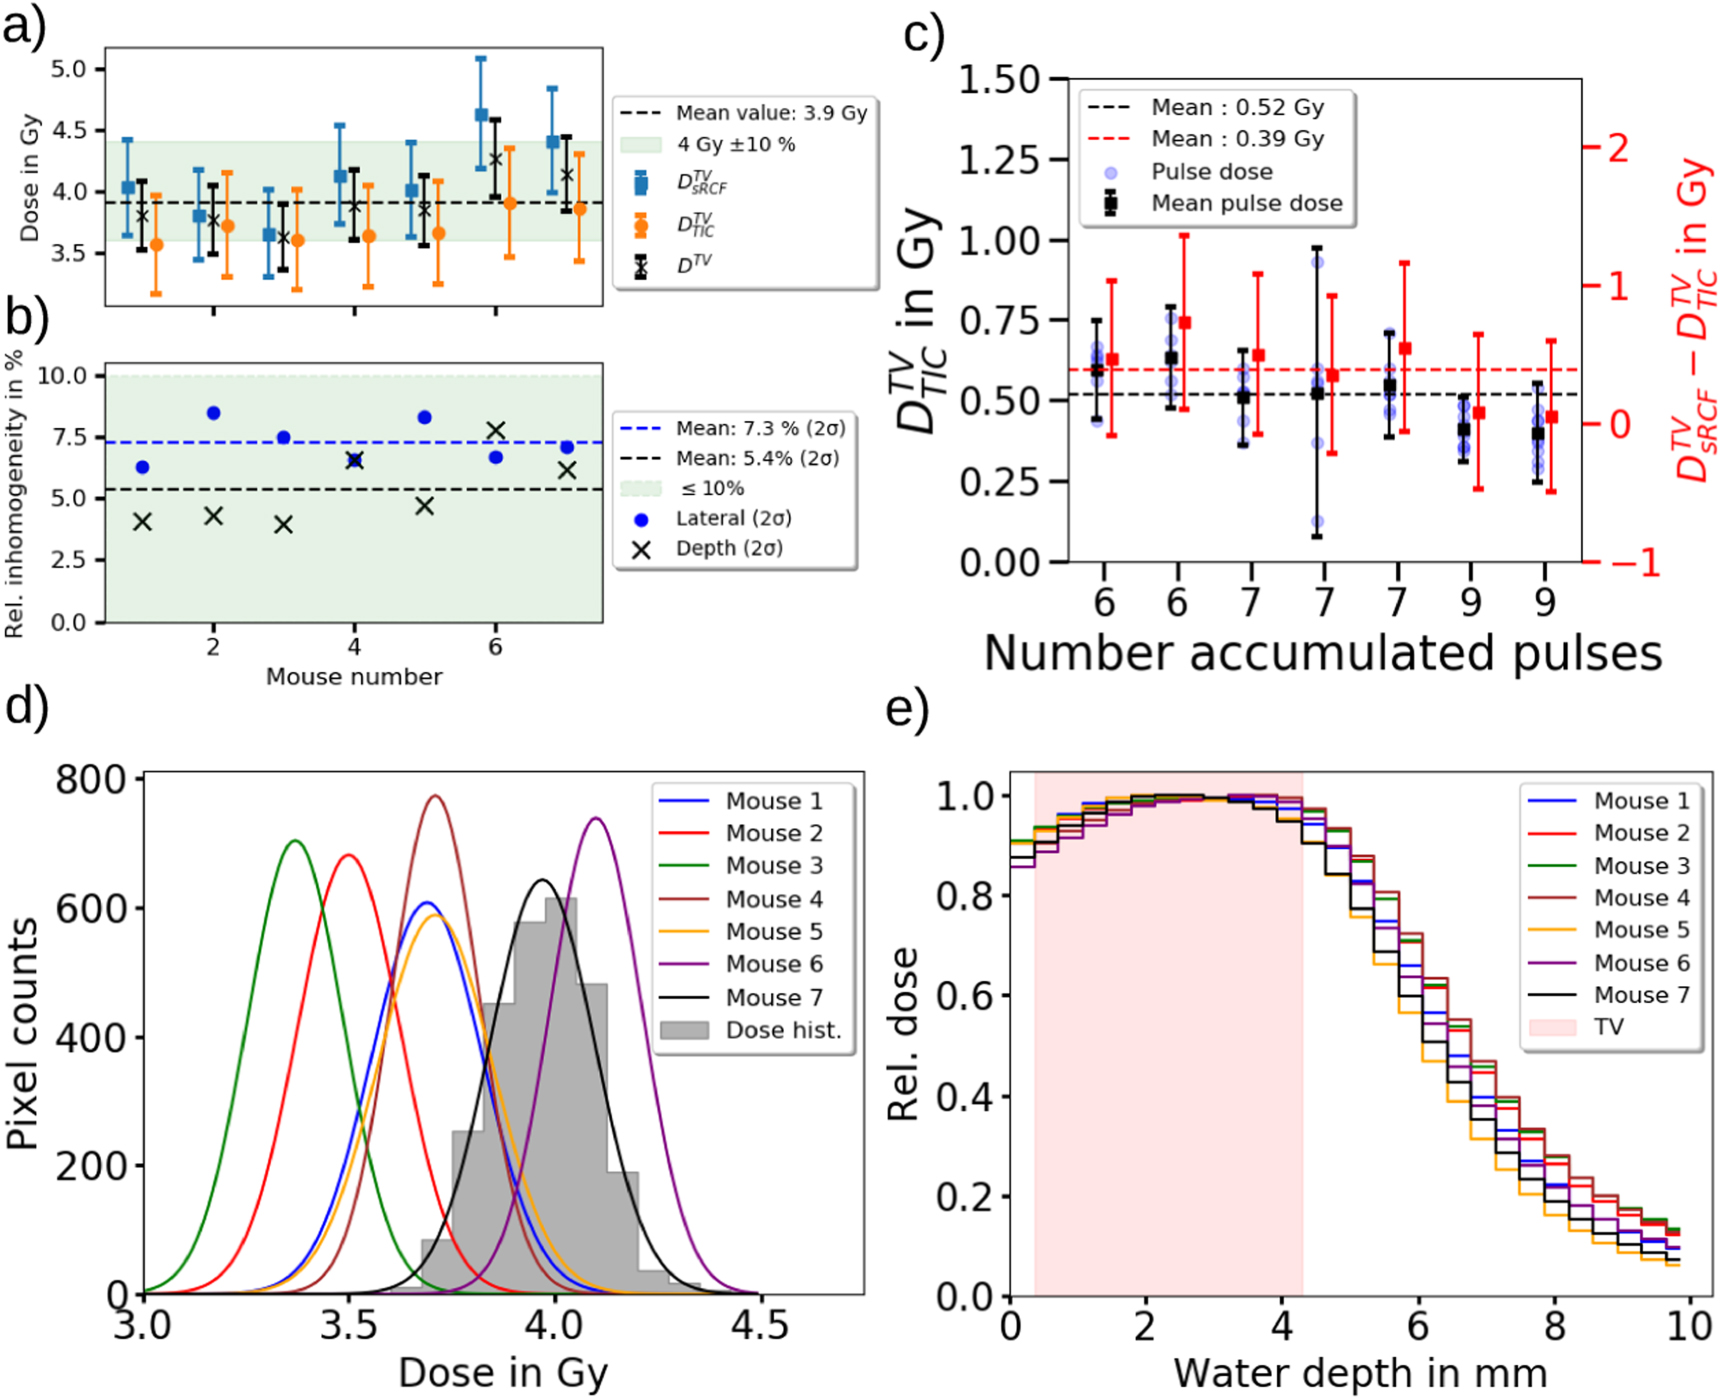
Regarding the dosimetric framework, the central result of the study is the agreement of both dosimeters (RCFs and TIC). The dose measurements from RCF and TIC deviate on average over all 7 mice by only 0.39 Gy, i.e. 10% of  . (figure 5(c), red data points). By uncertainty-weighted averaging of both independent results, the dose uncertainty of DTV is reduced to 7.4% from
  of 9.7% (single RCF) and
  of 11.4% (TIC). The dosimetric framework hence allows to verify the delivery of a prescribed dose to the TV within the model-required accuracy margins of 10%.
The Gaussian distributions of the lateral pixel dose values measured by the single RCFs are shown for each mouse in figure 5(d). Since the pixel number in the lateral ROI of the TV is constant, fluctuations of the lateral dose inhomogeneity can be seen in the height of the Gaussian distributions.
The depth correction values are summarized in table 3. kTIC averages to 1.01 whereas ksRCF averages to 1.10 and hence constitutes a significant correction. This is illustrated in the accumulated depth dose profiles that are predicted by the ToF spectrometer for each mouse irradiation (figure 5(e)). Ultimately limited by the spectral shaping capabilities of the ALBUS-2S beamline, the depth dose profile features a reduced entrance dose, yet in agreement with the depth dose homogeneity requirements of the radiobiological model. LPA source-inherent spectral pulse-to-pulse fluctuations translate into minimal variations of the depth dose profiles (figure 5(e)), also visible in the ksRCF values (table 3). The high spectral stability is indirectly monitored with the depth dose profiles. It results from the fact that the transported spectral components only represent a small bandwidth from the broad LPA source spectrum (Kroll et al 2022).
The agreement of DsRCF TV and DTIC TV validates that the saturation correction for charge recombination of AMCs, which is experimentally determined from electron pulses at dose rates up to ∼105 Gy s−1 by Gotz et al (2017), can be applied for LPA proton pulses of dose rates up to ∼108 Gy s−1 and single pulse doses of ∼500 mGy. Nonetheless, the presented study indicates the onset of diverging values for DRCF TV and DTIC TV as the single pulse dose increases to the 600 mGy-level. In figure 5(c), the single pulse dose increase is represented by decreased total number of proton pulses that are applied to the mouse (figure 3(b)).
As proton LPA sources might unfold their full potential in FLASH-relevant irradiation scenarios with high doses of multi-10 Gy in a single pulse by simultaneously preserving ultra-high dose rates of 109 Gy s−1 (Kroll et al 2022), new saturation correction models and according experimental measurements are required. Alternatively, dose-rate independent dosimeters can be applied (Togno et al 2022). Moreover, novel beam monitoring systems such as the presented ToF spectrometer, which can be calibrated for proton numbers, might open new paths for multi-10Gy, ultra-high dose rate pulse characterization (Reimold et al 2022).
5. Conclusion
In this work, a robust dosimetric framework for protons from LPAs is developed. It allows for the characterization and monitoring of mm-sized volumetric dose distributions at ultra-high dose rates. The dosimetric framework combines two independent dose monitoring methods that are simultaneously obtained by single RCFs and a TIC, which is cross-calibrated to an AMC. Challenging LPA proton characteristics such as pulse-to-pulse spectral fluctuations in combination with the active beam shaping require online monitoring to detect deviations from the prescribed depth dose distribution. The developed transmission ToF spectrometer has proven to be an ideal tool, especially as it is suitable for the LPA-inherent ultra-high proton dose rates. Moreover, a saturation correction model for AMCs was applied. As shown in this work, the model allows for the operation of AMCs as reference dosimeters at an LPA proton pulse-dose level of ∼500 mGy and a dose rate of 108 Gy s−1.
The applicability and performance of the dosimetric framework is showcased in the very first in vivo irradiation experiment with LPA protons. With a relative dose uncertainty of 7.4% for the 7 mouse irraditions in the pilot study, the framework enables the verification of volumetric dose delivery to the mm-scale TVs within the accuracy margins of <10% as defined by the radiobiological model.
Acknowledgments
We gratefully acknowledge the DRACO laser team for excellent experiment support. The work was partially supported by H2020 Laserlab Europe V (PRISES, Contract No. 871124) and by the European Unions Horizon 2020 Research and Innovation Programme Impulse (Grant agreement No. 871161). We recognize the support of the Weizmann-Helmholtz Laboratory for Laser Matter Interaction (WHELMI).
Data availability statement
The data that support the findings of this study are available upon reasonable request from the authors.
Ethical statement
The animal facilities and the experiments were approved according to the European Parliament and Council Directive 2010/63/EU on the protection of animals used for scientific purposes, German animal welfare regulations and local ethics committee (approval DD24-5131/338/35, Saxony State Directorate, Dresden, Germany).