

Abstract
Objective: The simple observation of breathing rate (BR) remains the first and often the most sensitive marker of acute respiratory dysfunction. In fact, there is evidence that drastic changes in BR are a predictive indicator of adverse events (i.e. cardiac arrest). The aim of this study is to develop a camera-based technology that may provide near-continuous estimation of BR considering the effect of respiration on video-PPG (vPPG). Approach: The technology has been tested in two different experimental settings, including controlled BR and more challenging scenarios with spontaneous breathing patterns. Video data were processed offline to derive the vPPG signal. The method derives respiration from beat-to-beat PPG rate and morphology changes in amplitude and width driven by the physiological relationships between vPPG and respiration. Moreover, respiratory-induced head movements were used as an additional source of information for the vPPG system. A combination of these methods has been exploited to estimate the respiratory rate every 10 seconds. Main results: According to the results, respiratory frequencies in the central range (0.2–0.4 Hz) may be estimated using the vPPG system with a low relative error,  and interquartile range of the order
  . However, the vPPG system showed a drop in performance at respiratory range boundaries, around 0.1 Hz and 0.5 Hz. Significance: This camera-based technology can be used as an ubiquitous BR monitoring system. However, vPPG-based systems should consider the effect of the BR in the estimation, mainly in applications where the respiratory rate is out of the 0.2–0.4 Hz range.
Export citation and abstract BibTeX RIS
1. Introduction
Monitoring breathing rate (BR) is a strong and specific predictor of serious adverse events such as cardiac arrest and unplanned intensive care unit admission (Fieselmann et al 1993, Cretikos et al 2008). Fieselmann showed that a BR greater than 27 breaths per minute is a predictor of cardiac arrest, and is even more informative compared to cardiac pulse and blood pressure changes. Moreover, Gravelyn and Weg (1980) demonstrated that BR is a specific marker of acute respiratory dysfunction such as hypoxemia (abnormally low level of O2 in the blood) and hypercapnia (abnormal CO2 in the blood).
Different methods have been exploited to monitor respiratory activity: airflow sensing technology uses a nasal sensor installed on a mouthpiece of a face mask to measure the volume of air exhaled; microphones recording respiratory sounds (Corbishley and Rodriguez-Villegas 2007); airflow can be detected because expiratory air is warmer, has higher humidity, and contains more CO2 than inspiratory air (Folke et al 2003); impedance plethysmography measures variations in transthoracic electrical impedance to derive ventilation (Cohen et al 1997); respiratory inductance plethysmography, which includes an elastic respiratory band made of strain gauge that, by the respiratory-induced motion, changes the resistance of the conductor according to the respiration or based on the modulation of the cardiac activity (Charlton et al 2017). Each method has its own disadvantages, e.g. cumbersome for the patient, time consuming, or does not allow for long-term monitoring (Al-Khalidi et al 2011, Massaroni et al 2019). Nowadays there is still a lack of low-cost home care solutions that can be ubiquitous and allow for daily monitoring of respiratory activity.
In state-of-the-art methods, a step forward in the improvement of patient compliance has been obtained by the introduction of noncontact devices. There are clear advantages to noncontact respiration monitoring methods. These include improved patient comfort (especially for long-term monitoring) as the subject is not tied to an instrument, and improved accuracy as distress caused by a contact device may alter the respiration rate (Al-Khalidi et al 2011). Three main camera-based approaches have been proposed to monitor respiratory information based on movement, thermal, and photoplethysmography principles. Movement-based methods exploit image processing techniques for the detection of shifting associated with respiration, basically chest and/or abdomen movement (Nakajima et al 2001, Bartula et al 2013, Zhao et al 2013, Al-Naji and Chahl 2016, Janssen et al 2016, Nam et al 2016, Regev and Wulich 2017, Rehoumaa et al 2018) or even shoulder movement (Shao et al 2014). In absence of other movement artefacts, these systems estimate the respiratory rate, and many of them have been validated while subjects are lying in bed; these subjects include neonates (Janssen et al 2016, Rehoumaa et al 2018), babies (Al-Naji and Chahl 2016, Regev and Wulich 2017), and adults (Nakajima et al 2001, Bartula et al 2013). Thermal cameras allow for respiratory rate estimation by monitoring dynamic thermal activity emitted from specific areas (usually nostrils) since the temperature of exhaled air is higher than that of inhaled air (Abbas et al 2011, Lewis et al 2011, Pereira et al 2017, Hochhausen et al 2018). In addition, some authors have combined both methods in order to increase the accuracy of respiratory rate estimation (Pereira et al 2016, Bennett et al 2017, Procházka et al 2017).
A contactless alternative is represented by the video-photoplethysmographic (vPPG) system. In the literature, the vPPG-based method has been widely used to monitor cardiac parameters such as heart rate and pulse rate variability (PRV). However, it has been poorly studied as a method to derive respiratory features as BR. In Poh et al (2011), the BR was extracted as a component of the power spectrum of PRV derived from the vPPG signal. In Villarroel et al (2014) and Tarassenko et al (2014), a band pass filter tuned to the expected BR has been applied to the vPPG signal. Hence, the peak in the spectrum has been considered as the BR. Similarly, Al-Naji et al (2017) combined information of head movement and the vPPG signal for respiratory rate estimation based on spectral analysis and filtering. The first pioneering work aimed at deriving a breathing signal from vPPG was performed by Gastel et al (2016). The method firstly proposed to divide the face into different subregions. For each region, a set of weights was calculated using the chrominance method (already implemented in de Haan and Jeanne (2013)), which allows us to enhance the respiratory information and suppress motion distortions. Then the best set of weights was selected by the signal to noise ratio (SNR) quality parameter and used to exploit the breathing signal.
As shown in the literature, the contact PPG signal has been used to derive breathing information based on the physiological effects of respiration over it. It is known that respiration modulates pulse beat occurrence and the PPG waveform (Garde et al 2013, Lázaro et al 2015). Indeed, during inspiration pulse-to-pulse interval shortens while during expiration it is prolonged. The following phenomenon, called respiratory sinus arrhythmia (RSA), plays an important role in respiratory–circulatory interaction, improving the efficiency of pulmonary gas exchange (Yasuma and Hayano 2004). During the mechanism of alveolar ventilation/perfusion matching, RSA allows the body to save energy by suppressing unnecessary heartbeats and increasing the efficiency of ventilation during the end of perfusion. Therefore, the respiratory component can be extracted from the PRV.
The mechanics of respiration, in particular inspiration, can lead to a reduction in tissue blood volume (reflected in a reduction of vPPG amplitude) mainly by two distinct mechanisms (Meredith et al 2012): reduction in cardiac output, and a reduction in venous pressure. As second effect, the negative intrathoracic pressure during inspiration produces a reduction in venous pressure, which pools the blood from the vascular bed within the tissue. Therefore, the pulse amplitude variability (PAV) can be an indirect measure of BR.
Finally, as shown by Lázaro et al (2013), the sympathetic nervous system regulates the vascular resistance by means of vein constriction, venous compliance, and blood volume. During expiration the blood vessels are more flexible than during inspiration. This mechanism affects the pulse wave propagation velocity that is reflected in the pulse width of the PPG signal. Therefore, the pulse width variability (PWV) is affected by respiratory modulation.
Focusing on noncontact respiration methods based on photoplethysmography, there is a need to characterize the physiological effects that affect the estimation. Most of the studies in the field have been performed during spontaneous breathing at resting conditions without considering different BRs (Verkruysse et al 2008, Poh et al 2011, Villarroel et al 2014, Tarassenko et al 2014, Al-Naji et al 2017). Our hypothesis is that these methods could be affected by the respiratory rate since the physiological modulation of PPG by respiration depends on it. For instance, it is well known that RSA decreases at high respiratory rates (Sin et al 2010). Moreover, in the case of vPPG, this decrease comes with a low-passed shape in comparison to finger-PPG (fPPG), which increases the uncertainty in locating the pulse and therefore reduces the RSA estimation. These effects should be carefully considered in BR estimation applications based on vPPG depending on the expected respiratory pattern. Mainly, when BR is out of its typical values at rest, e.g. during physical exercise, relax conditions or some clinical applications, among others. The aim of the present work is to test the feasibility of a contactless, camera-based method that estimates BR values based on vPPG signals while considering the effect of respiration on these vPPG signals. In addition, the added value of using movement information for the estimation will be evaluated. Compared to existing state-of-the-art methods, the proposed method's novelty lies in several aspects: providing an exhaustive analysis of the effect of respiratory rate in the estimation; implementation of a data fusion technique that combines breathing information derived from PPG waveform changes, PRV, PAV, PWV, and vertical head movements; assessment of PPG-derived respiratory (DR) modulation measured at two different body sites (finger versus head) using fPPG and vPPG technology, respectively; use of two different technological cameras in order to test the robustness of the implemented BR estimation. A preliminary version of this work has been reported (Iozzia et al 2017).
2. Materials
2.1. Experimental protocols
Two experiments were conducted involving 20 healthy subjects. In both experiments the subject was sitting on a chair, facing the camera device at a distance of approximately 0.5–1 m. To reduce motion artefacts, participants were instructed to move their head as little as possible. In both experiments the PPG signal was recorded from the index finger whereas the respiratory signal was recorded by a respiratory belt fixed to the subject's chest. Both signals were sampled at 256 Hz using the FlexComp Infiniti TM biofeedback system (Thought Technology Ltd., Montreal, Canada). The study was conducted in accordance with the ethical principles of the Declaration of Helsinki.
- Experiment I:Video recordings were performed by the Logitech C922 Pro Stream Webcam. The resolution was set to
 with a frame rate of 60 fps. The subject was informed to breathe at a constant rate, by using a set of breathing guidance videos showing a bar moving from 0.1 to 0.5 Hz at increments of 0.1 Hz. A 2 minute recording was made for each respiratory frequency.
 - Experiment II:In the second protocol a GigE Sony XCG-C30C camera was selected with a spatial resolution of pixels and 60 fps. The camera was equipped with a 15 mm fixed focal length lens (Tamron 25 HB), which was used to magnify the region occupied by the participant's face. The protocol was the following: 2 min of spontaneous breathing, a period of apnea (whose duration depended on the subject's capacity), and 2 min of recovery.


The data in the second database were divided into two stages: spontaneous breath lasted for 110 s of the recordings and recovery breath lasted for 110 s after the apnea phase. Each stage was treated as independent, and the estimation of respiratory rate was conducted for each stage except for the apnea stage.
3. Methods
3.1. Signal preprocessing
Videos were saved in H.264 format, with a compression rate factor close to 0 (so no effect related to data compression is expected) and were processed offline to derive the vPPG signal according to the algorithm presented in Iozzia et al (2016). Three regions of interest (ROI) were considered: forehead (ROI1), nose (ROI2), and cheek (ROI3). ROI detection and tracking were developed in OpenCV: detections were performed by the Viola–Jones face detection algorithm (Viola and Jones 2001) while ROI tracking along the X–Y axis (horizontal and vertical movements, respectively) was obtained by the Lucas–Kanade–Tomasi (LKT) motion flow tracking algorithm (Lucas and Kanade 1991). A modification of LKT was presented in this work: a Kalman filter was implemented to smooth movements of the face tracked with the LKT feature tracker using a linear model for the prediction and the Y axis coordinate as observations of the LKT centroid tracker output.
Within each ROI a spatial average of pixel intensities of each channel (red, green, and blue) was calculated for each frame to generate N raw signals (where N is the number of color channels). Considering M as the number of ROI, a total of  raw traces was obtained. The time series were first detrended (Tarvainen et al 2002) and band-pass filtered (finite impulse response filter using the Hamming window) with cut-off frequencies of f c1 = 0.1 Hz and f c2 = 5 Hz. To enhance the pulsatile component of the reflected light and reduce the motion noise, zero-phase component analysis (Bell and Sejnowski 1997) was applied to each ROI. As a result, M vPPG signals were obtained. Selection of the target vPPG signal was achieved by calculating the power spectral density (PSD) on the entire signal and by measuring the SNR using the following formula:
where  with
with  is the PSD of ith vPPG signals,
  Hz,
Hz,  Hz, and f p is the highest peak assumed to be the pulse frequency (measured in Hz). The signal with the highest SNR was selected as the target vPPG signal. Subsequently, the motion artefacts were automatically detected using the X–Y coordinates of facial movement (as shown in figure 1). Within a sliding window 1 s long, the first derivatives of X and Y coordinates (defined as
  and
and  ) were calculated. If the mean of
  or
or  calculated inside the interval time was higher than a threshold (manually selected as 14 pixels s−1), the corresponding vPPG segment was labeled as artefactual and discarded from further analysis (see figure 2). Less than
  of the total number of segments were excluded from the successive procedure.
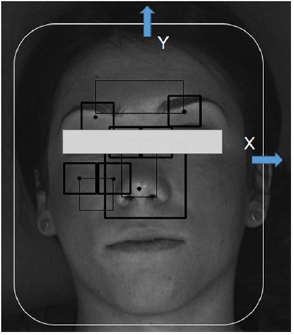
Figure 1. Tracking of the face according to horizontal (X axis) and vertical (Y axis) movement.
Download figure:
Standard image High-resolution image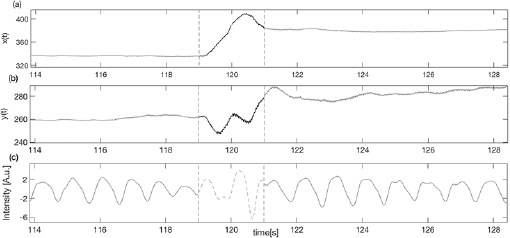
Figure 2. Example of artefact movement removal on vPPG signal (c) using the X–Y tracking signals (a) and (b) as references of noise.
Download figure:
Standard image High-resolution image3.2. Detection of fiducial points
To derive the PWV, PRV, and PAV signals from both fPPG and vPPG, the method implemented by Lázaro et al (2013) was applied. Briefly, the systolic peaks  were identified by an automatic PPG pulse detector based on a low-pass filter differentiator and an adaptive time-varying threshold (Lázaro et al 2014). Next, the diastolic points
  were identified inside a temporal window prior to
  :
:

where  is the PPG signal, and f s the sampling frequency of the signal. Finally,
  was detected as the half of the pulse amplitude of the cardiac pulse:

The width of each pulse wave was measured by considering the onset nOi and the end of the wave  . Meanwhile, the distances between
  and
and  were used to estimate the pulse rate (see figure 3). More details are shown in the original work Lázaro et al (2013). Although PWV and PRV seem similar in this figure, both DR signals are considered since their physiological origins are completely different. PRV reflects the RSA, i.e. it reflects the effect of respiration in the generation of beats at the sinoatrial node, while PWV reflects the effect of pulse wave propagation, which is also affected by the respiratory modulation (Lázaro et al 2013).

Figure 3. DR signals defined by a set of fiducial points.
Download figure:
Standard image High-resolution image3.3. DR signals
3.3.1. From PPG signals
Three DR signals were calculated using pulse-to-pulse methods based on PRV, PAV, and PWV. The DR signal based on PRV was obtained as a pulse-to-pulse series:

where u indicates that the signal is unevenly sampled, and  represents the arrival of the pulse after removing the ectopic and miss-detected pulses from
  by using the method proposed in Mateo and Laguna (2003). The other two derived signals, i.e. those based on PAV and PWV, were obtained as follows:


An outlier rejection rule based on median absolute deviation was applied (Bailón et al 2006), and the signals were resampled at 4 Hz using the cubic spline interpolation. Nonrespiratory frequencies should be removed from respiratory signals to avoid erroneously identifying spurious frequency content as the BR. There is no consensus on the optimal range of plausible respiratory frequencies. Furthermore, the optimal range may need to be adjusted according to the patient population or the specific application (Charlton et al 2017). A band-pass filter was applied with the low and high cutoff frequencies 0.075 Hz and 1 Hz, respectively.
3.3.2. From tracking signals
A fourth DR signal was obtained by the Y coordinate of the face movement returned from the LKT algorithm. Since respiration affects the vertical movement of the face, the  signal derived from the Y-axis movement over time was used as a source to detect breath. The signal was first resampled at 4 Hz and then a high-pass filter with a cutoff frequency of 0.075 Hz was applied to remove the signal trend. However, the subject may show various involuntarily head movements not correlated with the breath, such as yaw movement (turning the head), rolling movement (tilting the head), and pitching movement (looking up and down).
To detect possible abrupt changes in the signal due to these movements, the speeds of the two motion signals  and
and  were used. Defining a sliding temporal window of 2 s, if both speeds along
  and
and  signals are above the threshold T1 = 14 pixels s−1 (empirically chosen), then the corresponding segment of the signal is excluded. Since the pitching movement will be the most disturbing source of noise, a second threshold of T2 = 30 pixels s−1 was set to reject episodes with high vertical head movements by controlling the speed
  . Finally, the motion signal
  was obtained as the band pass-filtered version of
  with the cutoff frequencies of f c1 = 0.075 Hz and f c2 = 1 Hz.
3.4. Respiratory frequency estimation
The respiratory rate has been estimated from DR signals on a time interval of 30 s shifted every 10 s by adapting Lázaro's method (Lázaro et al 2015).
Briefly, the method uses a combination of PWV, PAV, and PRV (denoted as combined vPPG derived respiration (CvPDR)). The effect of including the tracking signal to increase the accuracy of the estimation is also considered (CvPDR+TR). Let us denote Sj (k,f ) as the power spectral densities for the j th DR signal at every time instant k. From these spectra, an average is computed as follows:

where  and
and  are two weighting factors used to restrict the inclusion in the average
  to (a) peaked spectra; and (b) spectra whose peak is not much lower than the peak of the other spectra at that time instant. For this reason, the following quantity Pj (k) has been calculated:
where Pj (k) is the percentage of Sj (k,f ) related to the j th DR signal and contained in the interval centered around the highest peak f p (k,j ). Peaked spectra are defined as those that have a Pj (k) greater than a threshold defined by  . Thus,
The condition  selects the Sj (k,f ) whose Pj (k) is not less than
  of the maximum Pj (k):
The respiratory frequency  is calculated as the frequency that corresponds to the maximum of
  in the frequency band
 ![$[0.15{{\rm \mbox{--}}}0.5]$](https://content.cld.iop.org/journals/0967-3334/40/9/094002/revision2/pmeaab4102ieqn041.gif) Hz:
Hz:

If in the spectrum of each DR signal no peak has enough energy in the considered frequency band, the range is enlarged to ![$[0.08{{\rm \mbox{--}}}0.5]$](https://content.cld.iop.org/journals/0967-3334/40/9/094002/revision2/pmeaab4102ieqn042.gif) Hz and a new search is started.
Hz and a new search is started.
After initialization of  , the frequency band for the searching of
  was defined as
 ![$[\hat{f}(k-1)-0.075; \hat{f}(k-1)+0.15]$](https://content.cld.iop.org/journals/0967-3334/40/9/094002/revision2/pmeaab4102ieqn045.gif) Hz, where
Hz, where  is the previous estimated value. As can be imagined, the phase of initialization of the algorithm is decisive since subsequent respiratory rate estimations will be based on a window defined by the previous value
  . Due to the morphology of the vPPG signal, for higher respiratory frequencies (e.g.
  Hz) the modulation of the breath is less evident compared to the modulation presented on fPPG. To account for this, a modification of Lázaro's algorithm is proposed when the tracking signal is considered. Since the tracking DR signal is uncorrelated with the breath modulation on the vPPG signal, it could be possible to increase the robustness of the respiratory rate estimation even for high respiratory rates. Therefore, during the initialization, the procedure described to estimate the respiratory rate was repeated separately for
  ,
,  ,
,  , and
, and  signals. Two
  values were estimated:
  and
and  . Lastly, the initial respiratory frequency was established as follows:
where  . If the tracking signal was detecting a higher respiratory frequency compared to the one measured by pulse-to-pulse methods,
  was forced to start at
  .
.
Finally, the results are expressed as relative error, calculated according to the following equation:
where f R is the respiratory frequency obtained from the respiratory belt used as a reference for the analysis of fPPG and vPPG.
4. Results
4.1. Camera comparisons
To evaluate the performance of the two cameras on the extraction of the vPPG signal, the SNR of the vPPG signal of each subject was calculated according to the equation (1) and averaged for the whole population (as mean  standard deviation). The vPPG quality signal obtained from the commercial camera was significantly lower (
 dB) compared to the one obtained from the industrial camera (
 dB).
dB).
4.2. ROI selection
As stated before, the ROI used for breath extraction was selected according to the highest SNR. In table 1, it is worth noticing that the forehead was the most selected region no matter the proposed experimental setting.
Table 1. Percentage of use of each ROI according to the selected database.
| ROI | Database I (%) | Database II (%) |
|---|---|---|
| Forehead | 60 | 61.11 |
| Nose | 30 | 11.11 |
| Cheek | 10 | 27.78 |
4.3. Database I
Results are shown in table 2, figures 4 and 5 for fPPG (a), CvPDR (b), and CvPDR+TR (c). Comparison of the methods shows different behaviors for different ranges:
- (i)The best results are obtained if the BR is in the range of Hz. The median and interquartile ranges (IQRs) of are below for fPPG and CvPDR+TR, but are higher for CvPDR. In particular, for the fPPG there is only one estimation with a relative error higher than (defined as ) among all records within this range (0.2–0.4 Hz) for all subjects. For CvPDR, corresponds to 43.1% of the estimations (13 at f R = 0.4 Hz) while for CvPDR+TR (11.7%).
- (ii)In the boundary of the respiratory frequency range (f R = 0.1 Hz to f R = 0.5 Hz) there is a drastic drop in performances of vPPG-based systems compared to the fPPG system. At f R = 0.1 Hz, the decreased accuracy has a methodological reason. According to the developed method, the initialization should enlarge the respiratory frequency range to Hz. However this condition is not always satisfied, leading to an overestimation of f R.
![$[0.2{{\rm \mbox{--}}}0.4]$](https://content.cld.iop.org/journals/0967-3334/40/9/094002/revision2/pmeaab4102ieqn069.gif)


![$[0.08{{\rm \mbox{--}}}0.5]$](https://content.cld.iop.org/journals/0967-3334/40/9/094002/revision2/pmeaab4102ieqn076.gif)
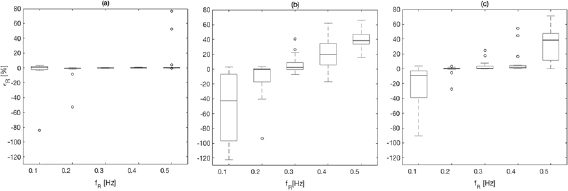
Figure 4. Boxplot of the respiratory rate relative error, calculated for dataset I, obtained with fPPG (a), CvPDR (b), and CvPDR+TR (c).
Download figure:
Standard image High-resolution image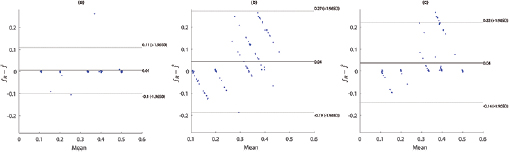
Figure 5. Bland–Altman plots for fPPG (a), CvPDR (b), and CvPDR+TR (c).
Download figure:
Standard image High-resolution imageTable 2. Relative error  in database I, expressed as median and interquartile ranges (IQRs).
| f R (Hz) | fPPG | CvPDR | CvPDR+TR | ||||||
|---|---|---|---|---|---|---|---|---|---|
 (%) (%) |
IQR (%) |  |
 (%) (%) |
IQR (%) |  |
 (%) (%) |
IQR (%) |  |
|
| 0.1 | 0.89 | 4.56 | 1 | −37.78 | 89.30 | 11 | −8.80 | 35.69 | 6 |
| 0.2 | −0.59 | 0.75 | 1 | −0.56 | 17.70 | 5 | 0.26 | 1.11 | 1 |
| 0.3 | −0.14 | 0.51 | 0 | 2.43 | 9.41 | 4 | 0.49 | 3.62 | 2 |
| 0.4 | 0.12 | 0.63 | 0 | 19.93 | 28.82 | 13 | 1.94 | 3.88 | 3 |
| 0.5 | 0.28 | 0.47 | 2 | 38.73 | 13.23 | 17 | 38.65 | 36.55 | 13 |
Note the increase in performance in all respiratory frequencies for CvPDR when the  signal is taken into account. The large benefits of using the
  signal are shown for f R = 0.2 and mainly f R = 0.4 Hz, where the median/IQR is clearly reduced.
4.4. Database II
The validation of the method for spontaneous breathing was carried out on the second database. As before, the results on respiratory rate obtained by vPPG-based systems were compared to the results obtained by the fPPG system. It is worth noting (see table 3) that the results are comparable looking at the median/IQR between fPPG and vPPG when tracking information is considered. Although results based only on vPPG (CvPDR) are worse than fPPG, its median relative error is around 1%. The slight decrease in performance for the vPPG system during the recovery stage (median/IQR at  , see table 3) is due to the re-establishment of spontaneous respiratory rate after a period of stress caused by apnea. Despite this, the fPPG system maintains a low median/IQR value (
 , see table 3).
Table 3. Relative error  in database II, expressed as median and IQRs.
| Phase | fPPG | CvPDR | CvPDR+TR | ||||||
|---|---|---|---|---|---|---|---|---|---|
 (%) (%) |
IQR (%) |  |
 (%) (%) |
IQR (%) |  |
 (%) (%) |
IQR (%) |  |
|
| Spont. | 0.07 | 1.46 | 2 | 1.10 | 6.36 | 5 | 0.43 | 2.11 | 2 |
| Recov. | 0.27 | 1.63 | 1 | 1.01 | 10.12 | 4 | 0.46 | 4.81 | 1 |
Moreover, as confirmed by database I, both systems (vPPG and fPPG) failed to detect the respiratory rate of subject 01 whose frequency was up to 0.4 Hz in both the spontaneous and recovery phases.
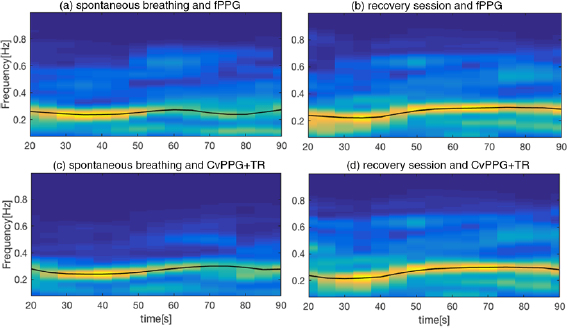
An example of time frequency analysis is shown in figure 6, where the stages of spontaneous and recovery breath are shown for the fPPG (figure 6(a) and figure 6(b) respectively) and vPPG (figure 6(c) and figure 6(d), respectively). As can be seen, the two methods show similar behavior in the respiratory rate tracking over the time.
Figure 6. ((a), (c)) Time–frequency analysis,  , of DR signals during the spontaneous breathing session for fPPG and CvPPG+TR respectively; ((b), (d)) time–frequency analysis of recovery session of fPPG and CvPPG+TR, respectively. The black line represents the estimated BR evaluated on a 10 s running window.
Download figure:
Standard image High-resolution image
5. Discussion
The present work demonstrated the feasibility of a camera-based contactless system to estimate instantaneous BR on a group of healthy subjects in two experimental settings: controlled BR and spontaneous breathing.
The first step for vPPG extraction is face detection. The classical Viola–Jones face detector (Viola and Jones 2001), which uses cascaded classifiers on Haar-like features, was used. This method provides real-time face detection, but works best for full, frontal, and well-lit faces. It has been shown that in unconstrained face detection, features like Haar wavelets do not capture the discriminative facial information at different illumination variations or poses (Liao et al 2016, Ranjan et al 2017). Therefore, this face detection method has some limitations when dealing with faces in a crowd, face rotation, inclined or angled faces, expression variations, and low image resolution. These should be considered in BR estimation.
According to our results, the accuracy of respiratory frequency estimation is almost comparable between vPPG-based methods and fPPG systems. However, when concentrating on respiratory frequencies at the boundaries of the typical respiratory frequency ranges, the fPPG presents generally better results compared to the vPPG in terms of extraction of breath information from the variability in PPG amplitude, width, and pulse occurrence. A possible explanation for the drastically reduced performances at very high respiratory frequencies can be given by the physiological nature of the two signals. The vPPG signal is a low-pass-filtered version of the fPPG signal. Therefore, RSA's impact on the face is attenuated more rapidly compared to the respiratory modulation found in peripheral zones such as the finger. Moreover, since the vPPG system works without contact between the sensor and the skin, it is more sensitive to artefact motion. Therefore, the presence of a high energy peak in the power spectrum not related to the respiration may confound the method that selects an erroneous respiratory frequency.
Bland–Altman plots show a positive bias in all considered methods, indicating an underestimation of the respiratory rate. However, a detailed analysis of figure 5 indicates an overestimation at low respiratory rates. Additionally, fPPG presents a lower standard deviation (SD) than vPPG-based methods, and the inclusion of the tracking signal reduces the SD of the error.
A review of methods for BR estimation based on electrocardiogram (ECG) and fPPG is presented in Charlton et al (2016). The performance of the 314 algorithms evaluated was assessed based on 2SD; the results ranged from 4.7 breaths per minute (bpm) at best to 50.1 bpm at worst. Our fPPG method obtained a 2SD of 6.38 bpm, being outperformed only by the best fPPG method whose 2SD was 6.2 bpm. Focusing on vPPG-based methods, a mean absolute error (MAE) of 0.541 bpm for vPPG was reported in Al-Naji et al (2017) using a protocol with respiratory rate ranging from 0.2 to 0.3 Hz. Constraining the analysis to this respiratory rate, our results are similar (MAE = 0.537 bpm) for CvPPG +TR. However, when all respiratory rates in our study are considered (0.1 to 0.6 Hz), the MAE increases up to 2.98 bpm; this points out the relevance of considering the effect of respiratory rate in the modulation of the vPPG signal. The approach presented in Poh et al (2011) does not derive any DR signal, although BR is estimated from the heart rate variability spectrum with BRs in the range of 0.16–0.35 Hz. Their results showed a mean error and SD of 0.12 and 1.33 bpm, respectively. Using the same BR range, our results had a higher mean error (0.29 bpm) but lower SD (1.27 bpm). Again, the performance decreases (mean error and SD of 2.25 and 5.55 bpm, respectively) when the entire BR range in our study is considered. To the best of our knowledge, only the work of Gastel et al (2016) exploited the different ways respiration modulates vPPG to track instantaneous respiratory rate covering a huge range of breathing frequencies. Despite their innovative work, the main limitation is concerned with the limited number of recruited subjects, which prevents us from extrapolating their conclusions. Beside this, their method presents superior performances in higher respiratory frequencies estimation (f R > 0.5) compared to the present work.
The second experimental setup tested the system with an industrial camera and a phase of spontaneous breathing and another of irregular breathing provoked by recovery after apnea. The proposed method is able to estimate the respiratory rate with an IQR relative error lower than  for both fPPG and vPPG, corroborating the good performances obtained in the estimation of respiratory frequencies in the central respiratory range during the first protocol. Interestingly, although the commercial camera produces a signal quality lower than the industrial one, the accuracy of respiratory rate estimation is still comparable to that of the fPPG system.
In terms of selected ROIs, the forehead appears to be the region with the highest SNR. A possible reason may be the region size: compared to the nose and cheek, the forehead is the largest area, and it allows us to reduce the camera noise level by averaging a greater number of pixels (Verkruysse et al 2008). Another explanation related to physiology could be the higher skin pulsatility of the forehead. In the future, it would be desirable to develop a fusion technique including signals from different ROIs and adding a weighting factor depending on the SNR. Another possibility may be the use of skin segmentation techniques that avoid the selection of the best ROI and perform vPPG signal extraction on the whole available face.
The performance of the vPPG system improves if the tracking signal is used in combination with pulse-to-pulse methods (see figures 4(b) and (c)). Note that a motion-based system is sensitive to subject motion while vPPG-based systems promises motion robustness. Thus, factors concerning expected BRs and movement should be considered in the vPPG system design depending on the final application. We should look for other sources of respiratory information to improve the BR estimation made by the algorithm. Therefore, as shown in Nam et al (2016), in future works the optical reflectance induced by respiratory abdominal motion could be be taken under consideration.
Finally, the proposed data fusion technique has shown some limitations in the estimation of BR with the vPPG system. Indeed, the method was tuned to present a higher accuracy estimation with respiratory frequencies in the center of the respiratory range; as a drawback, the relative error increases considerably at the boundary of the respiratory frequency range. Therefore, another aspect to consider is the use of machine learning tools, such as neural networks, which could result in a more robust combination of input information.
6. Conclusion
The present work has shown the possibility to estimate instantaneous BR from vPPG. The method derives respiration from the beat-to-beat PPG rate and morphology changes in amplitude and width driven by the physiological relationships between vPPG and respiration. Moreover, respiratory-induced head movements were used as an additional source of information for the vPPG system. Results of a combination of these methods show that respiratory frequencies in the central range (0.2–0.4 Hz) may be estimated using the vPPG system with a low relative error,  and IQR of the order IQR
  . However, the vPPG system showed a drop in performance at respiratory range boundaries, around 0.1 Hz and 0.5 Hz, which shows that respiratory modulation of the vPPG signal is affected by BR. Therefore, vPPG-based systems should consider the effect of the BR in the estimation, mainly in applications where the respiratory rate is out of the 0.2–0.4 Hz range.
Acknowledgment
This work has been partially financed by Ministerio de Economía, Industria y Competitividad (MINECO) and by fondos FEDER through projects RTI2018-097723-B-I00 and DPI2016-75458-R, and by CIBER in Bioengineering, Biomaterials & Nanomedicine (CIBER-BBN) through Instituto de Salud Carlos III. This work has received funding from the European Unions Framework Programme for Research and Innovation Horizon 2020 (2014–2020) under the Marie Skodowska-Curie Grant Agreement No. 745755.