

Abstract
Integrated modeling for core plasma is performed to increase confidence in the proposed baseline scenario in the 0D analysis for the China Fusion Engineering Test Reactor (CFETR). The steady-state scenarios are obtained through the consistent iterative calculation of equilibrium, transport, auxiliary heating and current drives (H&CD). Three combinations of H&CD schemes (NB + EC, NB + EC + LH, and EC + LH) are used to sustain the scenarios with qmin > 2 and fusion power of ∼70–150 MW. The predicted power is within the target range for CFETR Phase I, although the confinement based on physics models is lower than that assumed in 0D analysis. Ideal MHD stability analysis shows that the scenarios are stable against n = 1–10 ideal modes, where n is the toroidal mode number. Optimization of RF current drive for the RF-only scenario is also presented. The simulation workflow for core plasma in this work provides a solid basis for a more extensive research and development effort for the physics design of CFETR.
Export citation and abstract BibTeX RIS
1. Introduction
Conceptual designs for the first fusion demonstration reactor (DEMO) after ITER have been conjectured for a long time and extensive initial researches have been conducted [1–8]. ITER aims at demonstrating a high fusion gain and self-heated burning plasma. There are still critical R&D gaps from ITER to DEMO including capturing neutrons from fusion in blankets to breed tritium from lithium, and operating at steady state with a high duty factor [9].
The China Fusion Engineering Test Reactor (CFETR) is proposed as a nuclear facility in China running in parallel with ITER to bridge the R&D gaps between ITER and DEMO [5]. CFETR is designed to complement ITER by aiming at a much higher neutron fluence to develop the technology knowledge base required to proceed to DEMO. The concept design adopts a multi-phase approach, based on a strategy of starting with conservative ITER-like physics (i.e., during phase I) and then reaching full goal in subsequent (or upgraded) phases with more advanced physics and higher fusion neutron yields [5]. Since CFETR does not aim at high fusion gain initially, it could, in principle, start with a smaller size and less heating and current drive (H&CD) power than that for ITER [10].
The initial assessment from 0D analysis for the CFETR plasma provided several scenarios for the first phase and the upgraded phase [10] and is confirmed well by independent studies with other system codes [9]. Further studies are being performed to explore possible operation at higher B field and larger major radius [5, 11].
In a steady state with fully non-inductive current, density and temperature profiles are strongly correlated with the current profile. To optimize confinement and stability, transport and current profiles have to be controlled by auxiliary heating and current drive in the presence of significant alpha heating. To demonstrate the existence and accessibility of such a steady state, it is necessary to compute the profiles from 1.5D integrated modeling (IM) with the consistent simulation of equilibrium, transport, heating and current drive. In particular, the confinement enhancement factor H98Y2 and the auxiliary power requirement for external heating and current drive (H&CD) should be evaluated with physics-based models that have been validated against experiments. These parameters could be used for benchmarking 0D analyses and updating the calculation of system code in an extensive simulation workflow [12]. Furthermore, quantitative projections of heating and current drive power could serve as input for engineering design of auxiliary heating systems.
In the previous systemic 0D assessment [10], the main heating and current drive approach is a combination of neutral beam (NB) and electron cyclotron (EC) wave (ECW). The neutral beam can drive current with a broad profile and heat the ions directly. But the NB system would occupy a large space through the blanket especially when the tangential radius is very large to make the NBCD far off-axis. Other approaches have also been proposed. A lower hybrid (LH) wave (LHW) launched from the high field side (HFS) is proposed to take advantage of the more quiescent scrape-off layer (SOL) at the HFS, milder parametric decay and deeper penetration of the LHW [13]. Previous optimization of electron cyclotron current drive (ECCD) suggested that the ECW with high frequency launched from the top at the HFS of the magnetic axis could improve CD efficiency by ∼50% compared to that launched from the conventional LFS location above the outboard midplane [14, 15]. In this work we explore several scenarios using a combination of these methods by self-consistent 1.5D IM.
The main challenge in the baseline scenario development is to obtain profiles with good confinement while avoiding drastic magnetohydrodynamics (MHD) instability. Initial simulations for the baseline scenario suggested that a reversed magnetic shear (RS) with shear reversal at a large radius is beneficial to improve the plasma performance and is compatible with a high bootstrap fraction for the high performance phase of CFETR. Since the bootstrap fraction is not very high in the baseline scenario with a moderate βN [9], the RS setup requires a large off-axis current to be driven by external sources, which in turn limits the option of the current drive methods. The minimum of the safety factor q (qmin) is designed to be larger than 2 in order to avoid the m = 1 and 2 modes, which are related to the disruptions near the low-q limit. These targets guide the search for steady-state scenarios by 1.5D IM and current drive optimization in the rest of the paper.
The rest of the paper is organized as follows. Section 2 introduces the iterative workflow and the physics modules for IM. Three scenarios are presented with the H&CD composition of NB + EC, NB + EC + LH, and EC + LH, respectively, in section 3, together with the optimization of the RF methods. The last section summarizes the process in the scenario development for CFETR core plasma by IM and briefly introduces future work.
2. Modeling method
2.1. Workflow
Figure 1 displays the 1.5D IM workflow (inside the dashed rectangle) as well as the associated codes/modules for analyses of MHD stability (ideal MHD code GATO being equipped so far) and RF optimization. In order to have the steady-state solution, the integrated simulation loop is composed of the transport solver, equilibrium solver and source/sink solver, which runs iteratively to get a converged result. The transport solver TGYRO [16] as a parallel transport manager calls multiple instances of the transport model TGLF [17] and NEO [18] to obtain the transport fluxes of energy, particle and toroidal angular momentum. TGYRO then calculates steady-state profiles of temperature, density and toroidal rotation (related to the mean radial electric field) by iterating the gradients of profiles to make the transport fluxes match the target fluxes evaluated by integrating the sources and sinks. The TGYRO approach has obtained success in the prediction of the kinetic profile for the core plasma [16, 19]. The free-boundary equilibrium solver EFIT [20] with 129 × 129 grids evolves magnetic equilibrium with a prescribed boundary. The ONETWO [21, 22] transport code handles the evolution of the current profile and calls subroutines or independent codes to gather the sources and sinks of energy and particle. The power of the pre-specified main current drive (RF or NB) is tuned automatically to minimize the ohmic current between successive runs of ONETWO. This feature enables the loop to automatically yield a fully non-inductive steady state scenario.
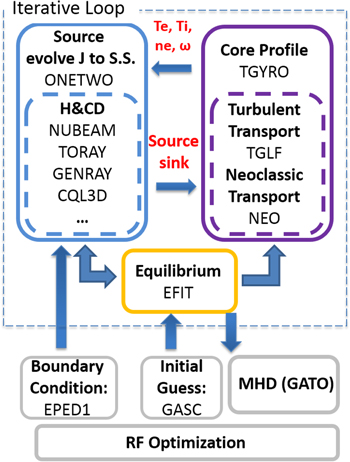
Figure 1. Illustration for the simulation workflow for the core plasma. The iterative loop is circled in the dashed frame. It requires 0D system code GASC to initialize global performance parameters and help to build initial equilibrium and pedestal code EPED1 to provide the pedestal profile outside the pivot point used in TGYRO. GATO is used to analyze ideal MHD instability. RF optimization module in OMFIT is used to optimize RF CD for any given steady-state plasma profile and equilibrium.
Download figure:
Standard image High-resolution imageThe workflow is implemented in the OMFIT framework [23], which allows data to be easily exchanged among different codes by providing a unifying data structure—OMFIT tree. Similar workflows have been successively used to improve modeling for DIII-D discharges with self-consistent equilibrium-transport iteration [24], and to robustly predict the kinetic profiles even including coupling of pedestal (using EPED1) and core plasma [25].
2.2. Transport model and H&CD model
The main advantage in this IM is in using the most advanced transport model that includes comprehensive physics. The drift-kinetic solver NEO is used to calculate neoclassical transport which is more accurate than other widely used analytical models [26]. The core turbulent transport model TGLF is a trapped-gyro-Landau-fluid model that improves the accuracy of the trapped particle response and the finite Larmor radius effects [17] compared to its well-known predecessor, GLF23 [27]. There are no adjustable parameters in the TGLF model used to fit experimental data. Instead, the TGLF model is designed for approximate validation of turbulent transport from first-principle gyrokinetic simulation. The TGLF model has been shown to reproduce core profiles of an extensive database of DIII-D [28] and AUG H-mode discharges [29] satisfactorily and has also been adopted in modeling for the European DEMO design [1, 30]. We should note that the TGLF model itself is also being improved in order to handle broader regimes, relevant to fusion plasma reliablility. The latest saturation rule [31] still requires more calibration with multi-scale gyrokinetic simulations and validation with experiments to be applied in predictive simulation. We refer readers interested in the recent validation work for that saturation rule to [32]. The version of TGLF in the simulations of this work is denoted as 'APS09' in the TGYRO setup, uses the saturation rule in [28] and the collision model in [33], and has been used to predict the four primary ITER scenarios [19].
Using these models TGYRO searches for steady-state profiles of electron and ion temperature, electron density and toroidal rotation [16]. The particle source from ONETWO is composed of that due to the neutral gas injected from the wall and that due to the NB. The latter becomes the dominant source in the whole simulated range of core plasma (ρ < 0.9 in present work) when high power NB is injected. In this paper ρ represents the radial coordinate (the square root of normalized toroidal flux). The ratios of helium and impurity over electron are fixed in the workflow as those assumed in the previous 0D analysis but the high-Z impurity is assumed to be argon since ONETWO cannot yet be used to treat neon. For energy sources and sinks, ONETWO calculates alpha heating (according to slowing down due to collisions), electron and impurity radiation, and collects the auxiliary heating from the following RF and NB codes.
The selection of codes calculating auxiliary heating and current drive is made with the trade-off between accuracy and expense of calculation resource. Electron cyclotron H&CD and lower hybrid H&CD are mainly evaluated by ray tracing code TORAY [34] and GENRAY [35], respectively. These codes calculate power deposition due to linear damping but can calculate driven current according to well-verified approximate formulas for CD efficiency including the 2D effect in velocity space (formulas for EC in [34] and for LH in [36]). For the large size and high temperature plasma in next generation tokamaks (like ITER) there is an argument that rays are mainly absorbed thermally and quasilinear effects could be neglected [2]. This approach was validated in a benchmark work for ECCD on ITER [37]. However, the quasilinear effect on the power deposition by LHW depends on the parallel refractive index (N∣∣) spectrum. Narrower spectrum can induce deeper power deposition even in high temperature plasmas [38]. For convenience, the relativistic quasilinear Fokker-Planck code CQL3D [39] has been incorporated into this workflow in validating activity on present machines, and periodically applied to check the linear results in the prediction. Neutral beam H&CD is evaluated by the MPI version of the Monte Carlo code NUBEAM [40]. It has been routinely used in the analysis of experiments [41]. During each call of ONETWO to calculate source, sink and the steady-state current profile, NUBEAM/TORAY/GENRAY are called only once. The computing time of each call of ONETWO takes only about 1 min, occupying a single parallel node (16 or 24 cores) on the SHENMA Cluster or CFETR Cluster.
The optimization of H&CD depends on the self-consistent profiles and equilibrium (quite sensitively in some situations). Modules for quick optimization of H&CD are also developed in the same framework for convenient use of most updated profiles and equilibrium. Optimization can be done by running independent loops with scanning over some specific parameters in the setup of H&CD for self-consistent steady-state plasma (e.g., a recent work on NB optimization [42]). For a more extensive scanning job over a wide range of injection parameters (e.g., for ECCD and LHCD), RF CD optimization modules have been developed in the OMFIT framework to call multiple independent instances without the necessity to parallelize the original RF codes. RF CD optimization is only performed after a self-consistent steady-state is obtained and the optimized parameters are fed back to the IM loop to update the steady-state plasma.
2.3. Initial condition and boundary condition
The IM simulation becomes a search process for a steady-state solution by means of the iterative loop. The initial equilibrium is constructed using Corsica-TEQ [43] with information from the engineering concept design. The initial profile is assumed according to the 0D parameters in the previous 0D analysis, e.g., line-averaged density, beta, etc.
The plasma performance is very sensitive to the pedestal structure [44]. Since simulation with interactive coupling of the core, pedestal and edge plasma for CFETR is still being developed, the pressure profile at the pedestal for this study is taken from the standalone simulation of EPED1. EPED1 is a model based on coupled consideration of the stability of the peeling-ballooning (PB) mode and the kinetic ballooning mode (KBM) to determine the height and width of the pedestal. It has been extensively validated against a large experimental database from DIII-D, JET and AUG et al over a broad parameters range and operation regimes with reliable accuracy [45]. It should be noted that EPED1 provides robust pressure profiles (rather than density and temperature profiles) in pedestal with parameters of baseline scenarios from previous 0D analysis. Further optimization with different density profiles at pedestal has been performed, which shows that fusion gain increases with the density at the top of the pedestal for the baseline scenario [42]. Since EPED1 do not provide the rotation profile, the toroidal rotation in pedestal is assumed to be extrapolated (with the same gradient at ρ = 0.9) from ρ = 0.9 to the separatrix where the rotation is fixed to zero.
2.4. Steady-state
We use 'loop iteration' to represent the whole iteration over ONETWO, EFIT and TGYRO in order to avoid possible confusion with the internal iteration in TGYRO. In each loop iteration, TGYRO performs less than 20 internal iterations to obtain stable density and temperature profiles. It might take tens of loop iterations to have steady state with consistent equilibrium, H&CD, density, temperature and toroidal rotation profiles. For example, figure 2 shows that the temperature and density profiles converge well in the last seven loop iterations for the case with NB + EC. As a check, figure 3 shows the comparison of transport fluxes and target fluxes in all channels for the result profiles from TGYRO in the last loop iteration in figure 2. Rotation profiles driven by NBI are evolved through the momentum transport equation in a separate process of TGYRO every ten loop iterations, since it is difficult to converge well if all the kinetic profiles are evolved at the same time for the present version of TGYRO. Notwithstanding, the transport momentum flux matches the target flux well enough (see figure 3(d)). Since a reliable validated model does not exist for intrinsic rotation without an external momentum source, the rotation profile for the case EC + LH is assumed to be zero.

Figure 2. The profiles from the last seven loop iterations for the scenario with NB + EC. The numbers in the legend in (a) represent indexes for the iterations. The rotation profile (d) is obtained in previous loop iterations (not shown here) and is kept the same in these steps. The profiles of density and temperature converge well, which indicates the variation of equilibrium, energy/particle source and sink are very small. It should be noted that the effect of the rotation, possibly driven by the steep profiles in the pedestal, has not been considered in this simulation.
Download figure:
Standard image High-resolution image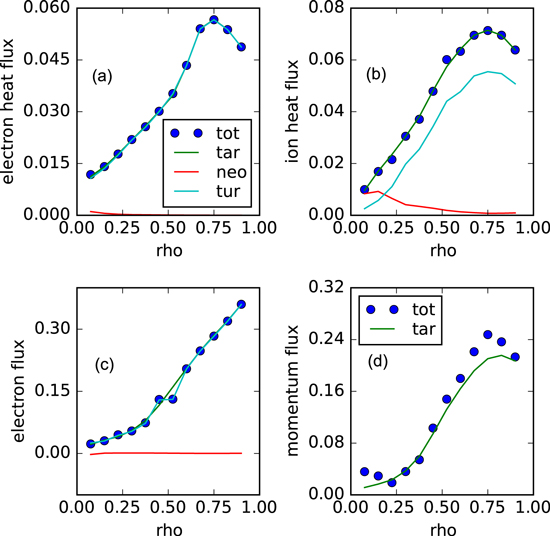
Figure 3. The transport flux compared with target flux computed from source and sink by TGYRO during the last loop iteration for the scenario with NB + EC. The 'neo' and 'tur' represent neoclassical transport fluxes from NEO and turbulent transport fluxes from the TGLF model, respectively. The 'tot' fluxes, the sum of 'neo' and 'tur', match well with the 'tar' fluxes, i.e., the target fluxes calculated from the output of ONETWO. The momentum flux converges well, even when the momentum profile is not updated in the last seven loop iterations. The units in (a)–(d) are MW m-2, MW m-2, e19 s−1 m−2 and J m-2, respectively. The mismatch around ρ = 0.5 in (c) is only due to a numerical convergence problem in TGYRO.
Download figure:
Standard image High-resolution image3. Baseline scenarios
3.1. Steady-state scenarios
The published 0D analysis does not provide detailed descriptions for CFETR operating scenarios and schemes of H&CD [10]. The goal of the present study is to explore different schemes of H&CD and estimate their potential to achieve the fusion power target [46] (∼50–200 MW) for the CFETR baseline. For simplicity, all the scenarios have a lower single-null divertor configuration from the previous engineering concept [47] (see figure 6(a) as an example). The typical parameters of the plasma shape are given in table 1. Possible improvement of confinement by plasma shape is not considered in the present 1.5D study.
Table 1. Parameters about plasma shape, current and magnetic field in CFETR phase I.
| 0D SS baseline | |
|---|---|
| R0 (m) | 5.7 |
| a (m) | 1.6 |
| Elongation κ | 2.0 |
| Triangularity δ | 0.4 |
| Ip (MA) | 10 |
| Magnetic field B0 (T) | 5.0 |
| Greenwald ne(1019 m−3) | 12.5 |
The baseline steady-state scenario proposed in a previous 0D analysis [10] is considered as the target plasma in this work. That scenario was proposed based on a conservative physical assumption and is envisioned to provide 200 MW fusion power for phase I. In particular, the Greenwald fraction was only 42% and the bootstrap fraction was less than 40%, which in turn required about 7MA current driven by external power. Three combinations of H&CD (NB + EC, NB + EC + LH, and EC + LH), respectively, are used to sustain the scenarios.
The global parameters of the steady-state plasma calculated from the IM are summarized in table 2, together with that from the 0D analysis for comparison. The profiles of temperature, density, current and safety factor for the steady-state using these schemes are plotted together in figure 4. The current compositions are plotted in figures 5(a)–(c), respectively, and the detailed setup of H&CD is given in section 3.2.
Table 2. Parameters for the three steady-state operating scenarios with different compositions of auxiliary heating and current drive. The baseline steady-state operating scenario from the 0D system code is also tabulated. The two scenarios containing neutral beam almost recover the betas from 0D system code.
| 0D SS baseline [10] | NB + EC | NB + EC + LH | EC + LH | |
|---|---|---|---|---|
| PNB + PEC + PLHa(MW) | 65(total) | 65 + 11 + 0 | 16 + 31 + 32 | 0 + 41 + 33 |
| Pfus(MW) | 200 | 134 | 148 | 76 |
| Fusion gain (abs) | 3.1 | 2.1 | 1.9 | 1.0 |
| Fusion gain (inj) | — | 1.8 | 1.9 | 1.0 |
| βT (%) | 2.1 | 2.3 | 2.0 | 1.6 |
| βP | — | 0.9 | 0.8 | 0.6 |
| βN | 1.8 | 1.9 | 1.6 | 1.3 |
| H98y2 | 1.3 | 1.1 | 0.9 | 0.8 |
| neline(1019 m−3) | 5.2 | 5.2 | 6.7 | 5.7 |
| Density peakedness | — | 1.4 | 1.5 | 1.4 |
| Ti(0)/Te(0) (keV) | 29.4/29.4 | 28/28. | 20/21 | 15/18 |
| fbs (%) | 36 | 40 | 45 | 36 |
| qmin/ρqmin(outside) | −/− | 2.1/0.6 | 2.1/0.7 | 2.1/0.7 |
| ζNB/ζEC/ζLHb | 0.36(avg) | 0.58/0.32/− | 0.23/0.39/1.27 | −/0.37/1.27 |
| li | — | 0.65 | 0.64 | 0.64 |
| fHe | 0.1 | 0.1 | 0.1 | 0.1 |
| Zeff(0) | 2.1 | 2.1 | 2.0 | 2.0 |
| Main impurity | Ne | Ar | Ar | Ar |
aPNB in IM is injected power but that in 0D analysis is absorbed power by plasmas. bNormalized CD efficiency is defined in [52].
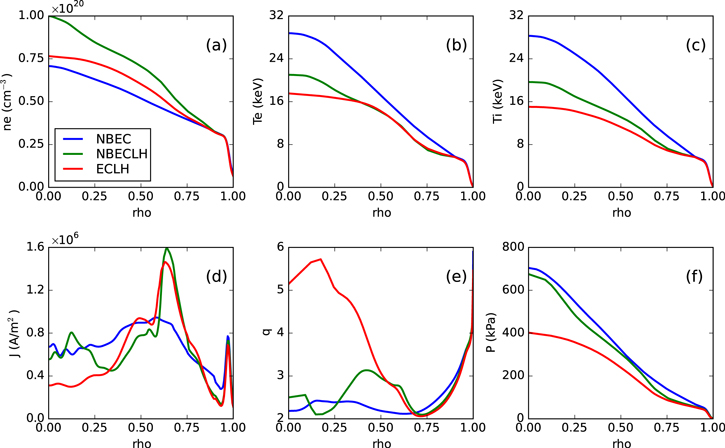
Figure 4. Steady-state profiles from IM for the three H&CD schemes: (a) electron density, (b) electron temperature, (c) ion temperature, (d) equilibrium current, (e) safety factor, and (f) pressure. The 'NB' represents neutral beam, 'EC' represents electron cyclotron wave and 'LH' represents lower hybrid wave. There is reversed magnetic shear in all the scenarios.
Download figure:
Standard image High-resolution image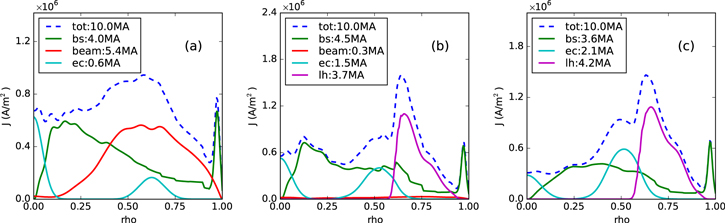
Figure 5. Current compositions for the steady-state plasma in figure 4: (a) NB + EC, (b) NB + EC + LH, and (c) EC + LH. The 'tot' and 'bs' represent total plasma current and bootstrap current, respectively; 'beam', 'ec' and 'lh' represent current driven by neutral beam, electron cyclotron wave, and lower hybrid wave, respectively. Ohmic currents are less than 1% and not shown here. The broad current profile could be constructed either by the coupling of the bootstrap current and broad NBCD or the composition of ECCD and LHCD.
Download figure:
Standard image High-resolution image3.2. Heating and current drives
Negative central magnetic shear (NCS) is maintained by applying off-axis H&CD schemes in order to produce a q-profile that is expected to have improved confinement and MHD properties [48, 49].
The scenario with NB + EC uses 65 MW neutral beams, which help to yield the best confinement and the highest electron and ion temperature among the three scenarios. In order to reduce the power of NB or eliminate the use of NB, LHCD is introduced in the other scenarios. The temperature decreases greatly with the diminishment of NB power. In the latter two scenarios the modeled neutral particle flux from the wall in ONETWO is increased in these two schemes as an attempt to maintain the fusion power. The LHW drives current at large radius and then produces a local minimum of safety factor there, which helps to make the electron temperature profile steeper than other regions in the core. The overall performance of the NB-dominated scenario is better than the RF-dominated scenarios, as shown by the pressure profiles in figure 4(f).
In the NB + EC scheme there are two tangential neutral beams. One beam with higher beam energy (∼300 keV) has a large tangency radius (Rtang = 6.5 m) to sustain a broad off-axis current (see figure 5(a)). The power of this beam is automatically tuned per loop iteration to maintain the fully non-inductive current profile. Top-launched ECW (10 MW) is used to tailor off-axis current profile so that the safety factor q is maintained over 2.0 (see figure 2(e)). An additional 10 MW NB with lower beam energy (100 keV) is used to drive plasma rotation and directly heat ions at the center with the tangency radius Rtang = 5.3 m. These effects improve the fusion gains by 25% and make the fusion power larger than the median (125 MW) of the phase I target while keeping the total heating power close to the 0D analysis. The composition of NBs is based on the optimization work [42] with the trade-off between the loss of beam power at the edge and the improvement of global fusion gain. Since negative NB with high energy (e.g., 1 MeV for ITER) would inject weaker torque and induce less rotation to enhance confinement, this scenario uses low energy NB instead.
Scenarios with RF-dominated current drive are explored in order to reduce the power requirement for NB. The off-axis NBCD is replaced by LHCD and more ECCD. The normalized CD efficiency for LHCD is higher than that for NBCD but we find that LH has difficulty in penetrating into the plasma core where ρ ≤ 0.5. The LHCD in figures 5(b) and (c) is driven by LHW launched from HFS which penetrates a little deeper than that regularly launched from LFS. So the LHCD peaks at the outside region and it relies on the contribution of bootstrap current and more ECCD to broaden the profile at the mediate radius. The power of LHW is automatically tuned per loop iteration to maintain the fully non-inductive current in both the NB + EC + LH and EC + LH schemes. The replacement of large power NB by LH significantly reduces ion and electron heating in the plasma core, which leads to lower temperature in the core. In the NB + EC + LH scheme the lower energy NB (100 keV, 16 MW) is used to further improve the fusion gain by driving rotation and direct ion heating. In contrast, the EC + LH scheme has no beam and the rotation is assumed to be zero, so the confinement deteriorates and consequently the fusion gain drops to about 1.0.
Low power (less than 1 MW) ECCD with fixed profile on axis is assumed to avoid the current hole there. This assumption improves the converge speed in simulation and is a good approximation to a more accurate simulation (see the end of section 3 (4)).
3.3. Comparison with 0D analysis
Table 2 lists the global parameters of the three scenarios and that of the baseline scenario by using 0D system codes [10]. The confinement enhancement factor H98y2 from the IM cannot reach the assumption in 0D analysis even with large-radius NCS. It should be noted that confinement time in 0D analysis was back calculated from the stored energy and the power for current drive [50], whereas the IM uses physics-based transport modeling. Furthermore, the additional auxiliary power, i.e. the lower energy NB for rotation drive that drives little current, was not included in that analysis. In present simulations the NCS does not strongly reduce the turbulent transport to a level below the neoclassical transport. For example, energy and particle transport for the NB + EC scheme is still dominated by turbulent transport for almost the whole core region, as shown in figures 3(a)–(c). There is no very strong internal transport barrier produced in this case. A possible explanation is that the poloidal beta of this baseline scenario is too low to support the turbulence suppression due to α stabilization and the transition to the improved confinement [51]. The CD powers are far off-axis and cannot deposit much power in the core. These results suggest that the H-factor in the 0D analysis should be tuned lower, for example, by adding auxiliary power only for heating.
The bootstrap fraction depends on the profiles of density, temperature and safety factor so that it varies among these scenarios. Since NCS could induce larger bootstrap current than normal magnetic shear for similar kinetic parameters, the scenario with NB + EC has larger bootstrap current than that from 0D analysis. For 0D analysis the proportionality of the bootstrap fraction to poloidal beta should be modified to account for profile effects corresponding to RS in order to improve the consistency between the 0D analysis and the IM.
For the scenario with LH + EC, all of the auxiliary power contributes significant driven current in contrast to other scenarios with additional lower energy NB. The normalized efficiency is higher than that in the 0D analysis but the required CD power is higher, mostly due to the lower temperature and the higher density. Generally, the prediction on the required auxiliary power from the IM for phase I is only ∼13–21% larger than that by the 0D analysis.
In conclusion, all the fusion powers for the steady-state plasmas with these three H&CD schemes reach the target of CFETR in phase I, although the performances are not as good as that projected in previous 0D analysis. The total power of auxiliary H&CD is about 20% larger than that projected from 0D analysis.
3.4. RF optimization
An RF optimization module is imported into OMFIT, which enables scanning over injection angles (for TORAY), N∣∣ peaks in the launched spectrum (for GENRAY), poloidal position of launcher and frequency. The plasma profiles and equilibrium are imported from intermediate results by the IM loop for steady-state plasma.
The optimized frequency of the top-launched ECW is robust with moderate variation of profiles and equilibrium if the toroidal magnetic field remains the same. The optimized frequency for fundamental O-mode ECW is about 190 GHz when B0 = 5.0 T. The resonance layer in cold plasma limit for 190 GHz is close to the plasma edge at HFS, as indicated by the dashed line in figure 6(a). Since the applied ECCD power is the largest in the scenario with EC + LH, parametric scanning of ECCD is presented here for that scenario. Figure 6 compares the off-axis ECCD profile centered at ρ = 0.5 driven by ECW launched from top of plasma at HFS and from the position above midplane at LFS. The traces of top-launched ECW are nearly tangential to the large-Doppler-shifted resonance layer and their power is deposited at HFS of flux surfaces so that the top-launched ECW induces larger driven current and much broader profile.

Figure 6. ECCD by 190 GHz electron cyclotron wave calculated by TORAY with plasma profiles of the scenario EC + LH. (a) Traces projected on the poloidal plane where the red dashed represents the fundamental cyclotron resonance layer in cold plasma limit. (b) Traces projected on the toroidal plane. (c) Driven current profile. (d) Power deposition profile. The normalized CD efficiency of top-launched ECW and LFS-launched ECW for off-axis CD is 0.38 and 0.29, respectively. The current density and power density for ECCD on-axis (red) are resized by a factor of 0.1 to be captured by the same ordinate range.
Download figure:
Standard image High-resolution imageFigure 7 compares the contours of driven current for ECW launched from these two positions by scanning over the launched angles. The contours of normalized radial position of the peak of current profile are over-plotted by dashed line. While ECW launched from LFS has good CD efficiency and broad optional range of launched angles for CD for ρ ≤ 0.5, ECW launched from top has better CD efficiency for ρ ≥ 0.5. Thus, a single frequency source with two launch positions is an attractive option for ECCD to tailor current profile of CFETR plasma across the whole radial regime.
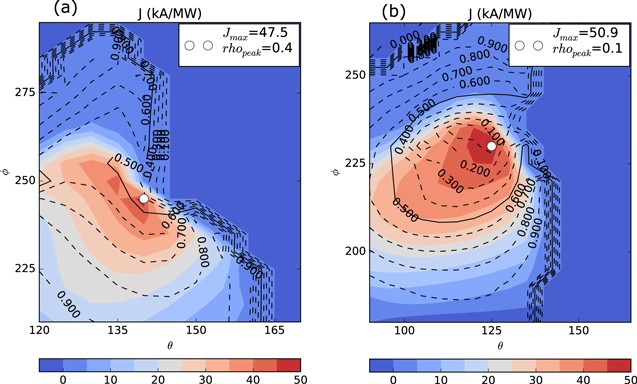
Figure 7. Filled contour of driven current by 190 GHz ECW launched from top (a) and LFS above midplane (b) into plasma with EC + LH. The abscissa and ordinate represent the launched poloidal and toroidal angle, respectively. The dashed lines are contour lines of the normalized radial position ρ of the peak of driven current. The contour line ρ = 0.5 is drawn with a solid line along which the parameters of the off-axis CD in figure 6 are selected. The top-launched ECW has high efficiency at the outside region and the LFS-launched ECW has high efficiency at the core region.
Download figure:
Standard image High-resolution imageFinally, the ECCD on axis by ECW launched from LFS is also plotted in figure 6, which can be used to fill the current hole there. It should be noted that the second harmonic cyclotron resonance by X mode launched from the top of plasma at HFS could be another option to drive current in the inner core of plasma. However, the CD efficiency of the latter setup is lower than one half of the efficiency of the former option.
For LHCD in the present simulation the frequency is assumed to be 5 GHz, as that projected for ITER. The purpose of optimization is to improve the penetration of LHW in fusion plasma. The launched N∣∣ spectrum is selected to make the wave power absorbed before being reflected near edge where the WKB approximation for ray tracing theory fails. As an example, the launched N∣∣ spectrum in the scenarios with EC + LH is modeled approximately as a Gaussian spectrum with the peak at 1.70. The width at half maximum is 0.13, which is close to the width of the main lobe in the common used spectrum for 4.6 GHz LHW on EAST [53].
The ray tracing code GENRAY neglecting quasilinear physics is applied to calculate LHCD in the IM loop. As a benchmark, the coupling of ray tracing code GENRAY and Fokker-Planck solver CQL3D is performed for LHW launched from HFS. The power deposition from CQL3D is weaker along the ray trace due to quasilinear plateau formation and relativistic effect so that the launched N∣∣ spectrum is increased to retain strong single-pass damping. The difference of total driven current is less than 1% and the difference of the radial location of peak value is less than 0.05 between the LHCD calculated from GENRAY in the IM loop and that from CQL3D (see figure 8(b)). This verification supports the scenarios using LHW and indicates the necessity to use a Fokker-Planck solver for the design of the wave spectrum even in the situation with strong single-pass damping.

Figure 8. (a) Ray traces of LHW from GENRAY. The solid contour lines represent the flux surfaces with strong Landau damping and the dashed lines represent the contour surfaces defined by the accessibility condition. Three parallel refractive indexes of these surfaces are 1.8, 1.7 and 1.6, respectively. The simulated traces verify the analysis with the Landau damping surface and the accessibility surface. (b) Profiles of LHCD calculated from GENRAY with 〈N∣∣〉 = 1.7 LHWs launched from HFS and LFS and CQL3D with 〈N∣∣〉 = 1.85 LHW launched from HFS. The CQL3D result supports that the off-axis LHCD could be obtained with an appropriate N∣∣ spectrum. The current profile driven by LHW launched from HFS is broader and peaks at a deeper region, which is consistent with the better penetration of ray traces.
Download figure:
Standard image High-resolution imageLHW launching from HFS was proposed by the MIT teams [13, 54] and has been an attractive option for CFETR in recent years. Most of the advantages of launching from HFS are related with either nonlinear physics or edge physics (e.g., milder parametric decay and more quiescent SOL at HFS compared to that at LHS). The only advantage shown by ray tracing simulation is that the wave penetrates deeper than that launched from LFS if both of the waves damp their power in a single pass. There have been a few ray tracing simulations for LHW launched from HFS in three device designs in Bonoli's talk [54].
In principle, LHW deposits most power by electron Landau damping at the flux surface (denoted as damping surface) with vp∣∣ ∼ 2.5vTe, where vp∣∣ = c/N∣∣ is the parallel phase velocity and  is the electron thermal velocity. The accessibility condition,
prevents LHW penetrating inside if N∣∣ at launch point is small and rays have insufficient N∣∣ up-shift in their previous propagation. Figure 8(a) compares the traces of LHW launched from HFS (lake blue line) and LFS (purple line). The rays launched from HFS can reach the damping surface (solid line) but those from LFS are deflected when they get close to the accessibility surface (dashed line) where N∣∣ = Nacc and slow-fast mode conversion happens. The current profile driven by the HFS-launched LHW is a little more inside and wider than that by LFS-launched LHW with the same N∣∣ spectrum (see figure 8(b)).
It should be noted that the rays launched from HFS can reach the damping surface before deflection only if they propagate upward away from the launcher at the bottom (see figure 8(a)). Generally, the direction of a ray trace depends on the directions of the toroidal component of its wave vector, plasma current and toroidal magnetic field. Since the wave vector should be in the direction opposite to plasma current in order to sustain the plasma current, the direction of rays for LHCD depends only on the toroidal magnetic field. Ray tracing simulations show that the toroidal magnetic field should be along the clockwise direction as viewed from the top, which is a restriction for using HFS-launched LHW. Figure 9 shows that the rays bend towards LFS when the toroidal magnetic field is reversed.

Figure 9. Ray traces of LHW from GENRAY with the toroidal magnetic field along the counter-clockwise direction. The other parameters are the same as that for LHW launched from HFS in figure 8. The rays bend towards the accessibility surface and cannot penetrate deeper than that launched from LFS side. If the plasma current and the N∣∣ spectrum are reversed at the same time, the wave propagates along the same direction.
Download figure:
Standard image High-resolution image
The advantage in penetration for the HFS-launched LHW could be more significant [13] than what we have shown here. For example, if the density is higher, the accessibility surface will be closer to the edge and will then shield the rays from LFS more strongly; the rays from HFS would be less affected. The comparison of penetration should be routinely performed for updated scenarios to evaluate the advantage.
4. Discussion and summary
The impurity profile is assumed to be a fixed fraction of the electron density profile. In another work about the CFETR scenario, an independent simulation loop for evolution of impurity profile has been coupled to the present loop [55]. The optimization over Zeff for fusion gain is explored on the trade-off between the radiation and the dilution effect on reducing turbulent transport. Although argon is again taken as the only impurity, the research will be extended to other species including nitrogen, neon, and krypton. The first wall in the present engineering design is coated by 2 mm tungsten. It may contaminate the core plasma and influence plasma performance. The research of this effect requires simulations for edge plasma and the interaction between plasma and wall, which are out of the scope of this paper.
In the present simulation loop for the core region of fusion plasma there is still no routine code for analysis of energetic particles (EPs). The EP-induced instabilities are to be analyzed by Nova-K in the coming upgraded version of the simulation loop.
Ideal stability analysis, based on energy principle, is performed by using GATO [56]. All the equilibriums of these scenarios in table 2 are upgraded based on MHD analysis on some preliminary IM cases [57] and become stable in the no-wall limit for toroidal numbers n = 1–10. The analysis of resistive MHD modes is not covered in the ideal MHD code GATO, which may play a role in limiting the performance of NCS plasma with hollow current density profiles. Previous simulation and experiments on Tore Supra [58] show that off-axis and global crashes in large NCS shots are mainly related to the low qmin profiles, i.e., qmin ∼ 2, 3/2, 1. However, this kind of instability has been removed from present scenarios by raising qmin over 2. Further improvement on scenarios, together with a robust severe-MHD-free operational window, is being explored in collaboration with the MHD and disruption team for CFETR physics design using nonlinear MHD codes.
In this work, the self-consistent 1.5D modeling confirms that the fusion power target for the steady-state scenario of CFETR in phase I (50 –200 MW) can be achieved with the previously reported R = 5.7 m CFETR optimized design using 0D system codes [9]. The target plasma is free from ideal MHD mode with n = 1–10 and can be sustained by three schemes of H&CD with and without neutral beams. But the confinement factors from 1.5D modeling decreases with the reduction of neutral beam power, and are all lower than that assumed in 0D analysis. The normalized efficiency for current-drive is a bit higher than that assumed in 0D analysis but the global efficiency in theRF-dominated scheme is lower even when using the most efficient LHCD. Optimization of ECCD consistent with profiles and equilibrium suggests the composition of top launch at HFS and conventional launch at LFS with a single frequency will achieve best efficiency over the whole plasma. Comparison of LHCD confirms a small advantage in penetration with HFS launch below midplane if the spectrum is designed to make LHW damped strongly in a single pass regime and if the magnetic field is along the clockwise direction as viewed from top, regardless of the direction of plasma current.
A key product in this work is the fast simulation workflow to assess the target plasma in steady state. It is one part of the physics design platform for CFETR and has been routinely used in the development of scenario for the subsequent phase and larger-size design. The physics simulation using the platform will couple this workflow with that for edge plasma to produce more consistent results with the edge and boundary performance. Specifically, it could include more consistent interchange of energy and particles between core and boundary (e.g., by using SOLPS [50] code extending from pedestal to SOL, and DIVIMP [51] code for impurities in SOL, etc.), and accounting for the transport of helium in the core and impurity at the plasma edge, which are influenced by boundary physics.
The next step in the near future with this workflow is composed of three parts: (i) integration of code to quickly estimate energetic particle effects and the threshold of resistive modes as discussed above; (ii) validation of the workflow, the transport codes and RF CD codes with long pulse shots on EAST; (iii) exploring H&CD schemes including high-harmonic fast waves in collaboration with innovative antenna development.
Acknowledgments
We would like to express our thanks to all the members of CFETR physics group, and we appreciate the General Atomic theory group for permission to use the OMFIT framework and GA code suite, and for their valuable technical support. J Chen thanks Dr Ronald Prater and Dr Alan Turnbull for their great help. Numerical computations were performed on the ShenMa High Performance Computing Cluster in Institute of Plasma Physics, Chinese Academy of Sciences. This work is mainly supported by National Natural Science Foundation of China Nos. 11405218 and by National Magnetic Confinement Fusion Research Program of China (Grant Nos. 2014GB110001, 2014GB110002, 2014GB110003) and supported in part by the ITER Special Fund of China under Grant 2013GB106001, 2013GB111002, 2015GB110001 and the Fundamental Research Funds for the Central Universities, HUST: cx-16-007.