
Abstract
A new model of the stationary electrostatic plasma sheath in front of divertor plates is developed, which takes into account strong inelastic processes. Using particle-in-cell simulations and analytic estimates it is demonstrated, that the properties of the tokamak divertor plasma sheath can significantly deviate from the properties of the classical sheath model. The most significant deviations are the increased energy flux to the plates and non-monotonic potential and ion velocity profiles in the presheath. Two main reasons for these deviations are identified: strong inelastic collisionality of the plasma presheath and the presence of super-thermal plasma particles originating from the upstream scrape-off layer.
Export citation and abstract BibTeX RIS

Original content from this work may be used under the terms of the Creative Commons Attribution 3.0 licence. Any further distribution of this work must maintain attribution to the author(s) and the title of the work, journal citation and DOI.
1. Introduction
Plasma sheath, a tiny plasma layer, which formed in front of the conductive wall, has three universal features: it exists practically in any plasma device; it influences particle and energy fluxes to the wall and thus can affect overall discharge; and includes strong gradients of plasma parameters. While the first two features define its importance for fusion [1] and processing [2] plasmas, the third one 'guarantees' the complexity of its study. Starting from first plasma sheath models for unmagnetized [3] and magnetized [4] plasmas, large number of analytic and numerical studies have been devoted to the plasma sheath. The classical model of the one-dimensional magnetized multi-positive ion sheath can be summarized as follows [5]:
1. The plasma in vicinity of the wall consists of the three layers: the collisional presheath, the collisionless magnetic presheath and the Debye sheath. In the collisional presheath, where collisional processes are dominating, ions are accelerated to the sound speed [2]. In the magnetic presheath Lorentz forces start to dominate, but plasma is still quasineutral. In the Debye sheath the electric field is so strong that plasma becomes non-neutral. In the present work we unify two adjacent to the wall layers, the Debye sheath and magnetic presheath, and call it the plasma sheath [6].
2. At some distance from the wall, typically of the order of few ion gyro-radius, ρi, there exists a point called sheath entrance (SE), where the following condition is satisfied:
Here mi, V∣∣,i, Zi, si, Ti and χi are the mass, the parallel velocity, the charge state, the concentration, the temperature and the polytrophic coefficient [7] of the ion species 'i'; Te is the electron temperature and N is the number of positive ion species. This point defines the boundary between the collisional presheath and the sheath.
3. At the SE, labeled by the upper index 'SE', the following boundary conditions are satisfied:
Here, Γ∣∣ and Θ∣∣ denote the particle and the energy fluxes parallel to the magnetic field; n is the particle density; Δφ is the potential drop across the plasma sheath; ϑ is the angle between the magnetic field and the wall surface, Ge is the secondary electron emission coefficient [8]; e is the unit charge and γ is the sheath heat transmission coefficient (SHTC) [1].
3. Particle and energy fluxes, labeled by the upper index 'w', are
Note that for simplicity in (3) we do not include electron and ion recombination energies at the wall surface, as well as have neglected the energy flux of a recycled plasma [1].
The set of equations (1)–(3) represents a closed system, which is used for boundary conditions in different numerical codes and for estimation of particle and energy fluxes to the plasma facing components (PFCs). Frequently a single ion plasma sheath is considered, when the velocity boundary condition reduces to the well-known Bohm–Codura condition [4]

One has to note, that the system (1)–(3) does not represent a full set of parameters characterizing the one-dimensional plasma sheath, namely it does not include any information about the energy and the angular distribution functions of particles absorbed at the wall. Knowledge of these distribution functions is essential for estimation of PSI processes. Therefore, the above given system is completed by different analytical and numerical studies of the particle distribution functions absorbed at the wall [9–12]. Moreover, the resent numerical simulations indicate that for quantitative estimation of the effective sputtering rates of heavy impurities, the knowledge of plasma profiles in the sheath is required [13, 14].
For derivation of the classical plasma sheath model the following conditions are used:
- i.Plasma sheath is a stationary object;
- ii.2D effects are negligibly small;
- iii.Wall surface is smooth;
- iv.The plasma potential and the ion velocity profiles in the collisional presheath are monotonic;
- v.Plasma sheath is collisionless;
- vi.Particle distribution functions at the SE are near to cut-off Maxwellian;
The aim of the present work is to identify which of the conditions of the classical sheath are not satisfied under the realistic conditions of the divertor plasma sheath, and to study the properties of such sheath.
The paper is organized as follows. In the section 2 we estimate qualitatively the applicability conditions of the classical sheath in the diveror plasmas; in the section 3 we describe the kinetic model used in our study; in the section 4 we present simulation results and at the end discuss the obtained results.
2. Conditions for existence of the classical one-dimensional sheath: qualitative estimates
2.1. Stationarity
The plasma sheath, as plasma in general, exhibits different oscillation modes [15, 16] as well as can be influenced by the cross-field turbulence [17–20]. Plasma sheath oscillations are observed also in present simulations, so that all results presented below correspond to the time averaged values. Below we assume that the turbulent fluxes are negligibly small compare to the convective particle flux in the sheath: Γturb ≪ nCssin(ϑ).
2.2. 2D effects
The presence of strong gradients of plasma parameters along the wall surface can lead to different cross-field drifts, which significantly affect the properties of the plasma sheath [21–29]. In the present work we neglect these effects by assuming the sheath width to be much smaller than the characteristic length of plasma gradients parallel to the wall, λ ≫ ρi. On the figure 1 are plotted ion gyroradii for D and T plasmas edge for different temperatures and magnetic field strengths.

Figure 1. D and T ion gyro-radius versus ion temperature for the different magnetic field strengths (in Tesla).
Download figure:
Standard image High-resolution image2.3. Surface roughness
If the characteristic height of the wall surface roughness is of the order of Debye sheath, i.e. ∼LD (LD is the Debye radius), then plasma sheath becomes non-uniform along the surface [30–32]. Therefore, the classical 1D sheath model is not applicable any more. On the figure 2 are plotted LD for different plasma densities and electron temperatures. Assuming that typical characteristic height of the divertor surface roughness is of the order, or smaller than 1 μm [33], for the temperatures Te > 1 eV and densities n < 1020 m−3 in the sheath, we can neglect the roughness effects.
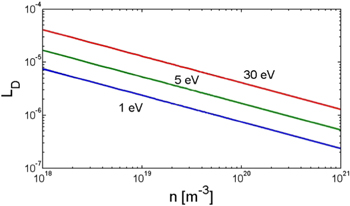
Figure 2. Debye radius versus plasma sheath density for different electron temperatures.
Download figure:
Standard image High-resolution image2.4. Monotonic profiles in the collisional presheath
Existing sheath models assume that the potential and the ion parallel velocity are monotonic in the presheath (e.g. see [1, 34, 35]). These conditions are required for plasma acceleration towards the SE, where the ion flow becomes sonic. But what will happen if inelastic collisions are too strong? E.g. it is known that for high recycling divertor plasma, which is a common regime in tokamaks with divertors, the plasma density is peaking in the presheath [1] (also see the figures 9 and 10). This is a consequence of local ionization of the neutrals recycled from the divertors plates. Using a typical assumption for the quasineutral collisionless presheath, stating that electrons are Boltzmann-distributed, ne ∼ exp(−eϕ/Te), we obtain that at the density peak the potential has to peak too, i.e. it is non-monotonic. Here we exclude the unphysical case when Te has a well. Moreover, the newly ionized ions move in both directions, upstream and downstream SOL, so that the total ion parallel velocity might decrease at the density peak, i.e. it also becomes non-monotonic.
The non-monotonic profiles might have two consequences. (i) The existence of the potential peak leads to trapping of the low energetic electrons in the corresponding (electron) potential well. The de-trapping mechanism represents the Coulomb collisions with energetic electrons, when the energy transfer from the free energetic electrons to the low energy trapped electrons is sufficient to overcome the potential well. Therefore, for very large colisionality one can even expect that the potential peak disappear at all; (ii) it is unclear can the ions be accelerated in the presheath enough, to reach the sound speed at the SE. As it will be described below, there really exists a collisionality window were the potential in the presheath has a peak, and the ions still reach the sound speed at the SE.
2.5. Collisionality of the sheath
There are two characteristics of the classical sheath requiring absence of collisions: (i) the cut off velocity distribution function of the electrons at the SE defining electron flux to the wall and the potential across the sheath (e.g. see [34, 36]),  where
where  and
and  are the cut-off velocity and the pitch angle; and ii. the energy and the angular distribution functions of the plasma particles absorbed at the wall [9–12].
In the figures 3 and 4 are plotted The Coulomb,  and the charge-exchange,
  collisionalities of the (deuterium) plasma sheath for different temperatures, densities and magnetic field impinging angles to the divertor surface. Here

 and
and  are the Coulomb logarithm and the charge-exchange collision frequency [37]. We assume that the strongest inelastic collisions in the sheath are the charge-exchange collisions [38] and the concentration of D atoms to be 10%: na = 0.1n. As we can see, already at moderate magnetic fields, B = 2 T, the plasma sheath is Coulomb collisional for TSE < 10 eV and nSE ≥ 1019 m−3. For these parameters one can expect some deviation of the sheath potential drop from the classical one and the smoothing of the energy and the angular distribution functions of the absorbed particles. Contrary to this, the plasma sheath is weakly inelastic-collisional at least for given neutral particle concentration.

Figure 3. Coulomb collisionality of the plasma sheath versus temperature for different plasma densities at the sheath entrance and impinging angles of the magnetic field (B = 2 T).
Download figure:
Standard image High-resolution image
Figure 4. D + D+ charge-exchange collisionality of the deuterium plasma sheath versus temperature for different plasma densities at the sheath entrance and impinging angles of the magnetic field (B = 2 T). Neutral particle concentration assumed to be 10%.
Download figure:
Standard image High-resolution image2.6. Particle distribution functions at the sheath edge
It has to be noted that different models of the plasma sheath result at different ion velocity/energy distribution functions at the SE, e.g. see [1, 39–45]. The shifted Maxwellian ion velocity distribution function, used for obtaining the system (1)–(3), represents one of the simplest cases, which still well reproduces the common features of most of these models. The Maxwellian velocity distribution function, with rare exceptions (e.g. see [46]), is frequently used in plasma sheath modeling as a boundary condition at the SE [47].
All these 'classical' sheath models do not account for the contribution of super-thermal plasma particles. It is known, that even a small concentration of a non-Maxwellian super-thermal plasma particle population can strongly modify the stationary sheath properties [36, 48–52] and lead to misinterpretation of plasma probe measurements [53–55]. Effects of super-thermal particles on the divertor sheath have been reported from different kinetic SOL models [38, 56–59] and observed experimentally too [60]. E.g. an increased potential drop in the divertor sheath has been explained by the presence of the super-thermal electrons [58] and ions [59]; although in [59] this increased potential drop probably was a consequence of the fact that the plasma sheath was not resolved in the simulation and the ion flow stay sub-sonic at the simulation boundary.
Interesting to note that already in one of the first kinetic simulations of the SOL quite non-classical sheath parameters have been obtained [56], namely the peaking divertor plasma density, the non-monotonic potential profile and the electron SHTC exceeding by the factor 6 the classical values. But due to number of heavy simplifications used in this work: the reduced mass ratio mi/me = 200, not self-consistent model of the sheath, a very limited number of inelastic processes included in the model, a relatively low accuracy of the simulations (still the highest possible ones for available computing power at that time); as well as the fact that no proper explanation has been given for these observations, these results have been never used. More refined simulations of the SOL with the recombining divertor plasmas confirm these 'strange' results [38].
The explanation of 'non-classical' properties of the divertor sheath can be explained by extremely strong temperature gradients in the upstream SOL and the SE. In contemporary middle and large size tokamaks the upstream temperature at the outer midplain (OMP) is of the order of 100 eV, while the temperature at the divertor SE is about 5 eV and even lower in detached and near detached regimes [1]. Due to the finite collisionality in the SOL, some small fraction of the high temperature plasma particles from the OMP region propagates downstream to the divertor plates without collisions and contributes to the formation of the divertor plasma sheath.
In the figures 5 and 6 are plotted the electron energy and the ion velocity distribution functions at different distances from the inner divertor plate. These plots clearly demonstrate the difference between the fluid and the kinetic pictures of the plasma parallel transport in the SOL. In the fluid picture the plasma temperature is decreasing downstream to the divertor plates, but the energy and the velocity distribution functions are kept near to the corresponding Maxwellian. Contrary to this, in the kinetic picture the distribution functions downstream to the diveretor plates significantly deviate from the Maxwellian. The high energy particle tails in the figures 5 and 6 correspond to the hot particles originated from the OMP region.
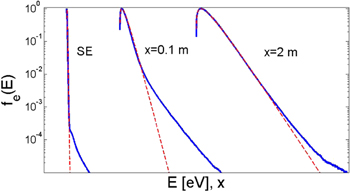
Figure 5. Electron energy distribution function at different poloidal distances from the high recycling inner divertor plate. Dashed red lines represent the corresponding Maxwellian distribution functions. The case ϑ = 6°, γc = 0.08 (see the description of simulations).
Download figure:
Standard image High-resolution image
Figure 6. Ion parallel velocity distribution function at different poloidal distances from the high recycling inner divertor plate. Dashed red lines represent the corresponding Maxwellian distribution functions. The same case as in the figure 5.
Download figure:
Standard image High-resolution imageThe reason of this deviation of the distribution functions from the Maxwellian one is a strongly nonlinear dependence of the elastic and inelastic collision processes on the energy of the plasma particles. During their motion downwards to the divertors plasma particles with different energies are cooled down with the different efficiencies and those, which are in a weakly Coulomb collisional regime can not Maxwellise anymore. For demonstration in the figures 7(a)–(c) are plotted the cross sections of different collisions, taking place in the SOL. We consider the most effective inelastic cooling processes: the excitation + ionization collisions of the electrons with the impurity ions and charge exchange collisions of ions with the corresponding atoms. The C and the Be impurities are chosen as a limiting cases of a strong and weak electron 'coolers'. In the figure 7(d) are plotted the corresponding relative mean-free-paths for different  where we assume the concentration of the impurity particle in the charge state 'i' to be
  One can see that plasma particles can be divided into two populations: (i) those which suffer more frequent Maxwellising Coulomb collisions, lc < lin, and (ii) the others experiencing more frequent de-Maxwellising inelastic collisions, lc > lin. The latter contribute to the non-Maxwellian distribution function tails in the downstream SOL. As an example in the figure (d). we distinguish two electron populations in the presence of the C impurity with

Figure 7. Cross-sections of different collision processes in the SOL (a)–(c) and the corresponding relative mean free paths (d). (a), (b): e + C+n and e + Be+n total excitation and ionization collisions from the ground state; (c): D + D+ charge exchange, e + D+ Coulomb, e + D excitation and ionization collisions. In (d) the concentration of D atoms is assumed to be 10%. Atomic data is taken from [61–72].
Download figure:
Standard image High-resolution imageIn order to study the above-discussed effects at a quantitative level a large set of high resolution kinetic simulations have been performed.
3. Description of the simulation model
For the SOL simulation we use a massively parallel electrostatic particle-in cell (PIC) + Monte Carlo (MC) code BIT1 [73–75]. Atomic and plasma-surface interaction (PSI) processes are treated by MC part of the code via nonlinear energy and momentum conserving operators [38, 55, 76]. Collision cross sections and PSI rates represent the latest data available to us. The Coulomb collisions are treated via binary collision method [77] optimized for massively parallel simulations [78]. The simulation geometry corresponds to the magnetic flux tube in the SOL bounded by the divertor plates, the separatrix and the outer wall, see the figure 8. The plasma, the neutral and the impurity particles are treated correspondingly in 1D, 1D/2D and 'quazi-2D' approximation. The quazi-2D effects are represented by random removal of the impurity ions from the simulation with the removal rate, corresponding to the cross-field diffusion with  [13, 38, 55]. This 'diffusion' is necessary to avoid continuous accumulation of impurity ions during the simulation.

Figure 8. BIT1 simulation geometry.
Download figure:
Standard image High-resolution imageThe plasma and the heat sources, implemented in the simulation, correspond to the cross-field transport through the separatrix. The center and the outer boundary of the source region correspond to the OMP and the x point, respectively.
For convenience, these sources we call below cross-field particle, Sp, and heat, Sq, sources.
During the simulation the plasma particles, consisting of the electrons and the D+ ions, are injected in the source region with the Maxwellian velocity distribution functions. These particles propagate towards the divertor plates, absorbed there and initiate the PSI processes. The emitted recycled neutrals and impurity particles interact with the plasma, resulting in a self-consistent plasma recycling and impurity sputtering processes. The neutrals (if treated in 2D) are removed from the simulation when they reach the separatrix, or the outer wall. Simulation details can be found in [38, 55]. Here we mention the parameters, which are specific to the given simulations.
In order to speed up the simulations we use a reduced SOL model consisting of electrons, D+ and C+ ions, and D and C atoms. We are not interested in detailed impurity transport, but include impurity particles in the simulations in order to cool down the electrons in the divertor plasma to the realistically low values. For compensation the absence of highly ionized states of C ions, the e+ C+ excitation-cross section is artificially increased to 10−18 m2. In order to ensure high accuracy of the simulations a large number of simulation particles, from 100 to 1000 per Debye length, and long observation times for diagnostics, from 3 × 10⁴ to 105 plasma oscillation periods, are used. As a result, the energy and the velocity distribution functions are resolved with the relative accuracy better than 10−5.
During each inelastic, or Coulomb collisions between the different particle species, the energy loss (gain) is calculated and added to the corresponding diagnostics. The simulated plasma parameters correspond to the middle and large size tokamak SOL. The strength of the magnetic field is 2.2 T. The shorting factor is 10 [79]. SOL was fully resolved in the simulations including the divertor sheaths. For this purpose we use large number of the grid cells—up the 3.6 × 10⁵ along the poloidal direction.
We consider 3 sets of simulations with the different magnetic field inclinations, ϑ. Τhe corresponding simulation parameters are given in the table 1. In order to keep the parallel connection length to the reasonable value for the set with ϑ = 1.5° we consider a system shorter than in other sets. Each simulation set is started with a simplest case without the plasma recycling, R = 0, and the impurity sputtering, γc = 0. Then we increase the complexity of the simulations step by step. First, the plasma recycling is increased without changing other simulation parameters. The exception is the cases with R = 1 and 1D neutrals, when we ser the cross-field particle source to zero (otherwise plasma will be continuously accumulated). Then, for R = 1 we switch the C sputtering on and consider different impurity concentrations. This is achieved by changing the corresponding chemical sputtering rates [55]. Such sequence of simulation runs allow separate study of the plasma recycling and the inelastic electron-impurity interaction effects on the plasma sheath. In order to make the simulations with γc > 0 as realistic as possible, we use a 2D model for D atoms and adjust correspondingly the cross-field particle source for compensation of D losses at the outer wall and at the separatrix. At the end we add plasma recombination process [38]: the case ϑ = 6°,  R = 1,
 The temperatures of the electrons and the D+ ions injected in to the source region, i.e. particles 'coming' from the pedestal region, were
  and
and  eV. We assume that for such shallow angles, θ ≤ 6°, the secondary electrons are promptly re-absorbed back and do not include them into the simulation model [80, 81].
Table 1. Simulation parameters. Upper indexes denote the runs used in the below-given figures.
| Magnetic field inclination ϑ and the poloidal size of the SOL | Plasma recycling coefficient R, and neutral dimensionality | Impurity sputtering, chemical sputtering coefficient, 
|
Normalized cross-field heat source 
|
|---|---|---|---|
| 1.5°, 3.55 m | 01, 0.2, 0.42, 0.6, 0.83, 1D | Off, 0.0 | 0.0, 0.0 |
| 1.04, 1D | Off, 0.0 | 0.142, 0.117 | |
| 1.0, 2D | On, 0.015 | 0.145, 0.131 | |
| On, 0.086 | 0.099, 0.099 | ||
| 3°, 7.55 m | 01, 0.2, 0.42, 0.6, 0.83, 1D | Off, 0.0 | 0.0, 0.0 |
| 1.04, 1D | Off, 0.0 | 0.358, 0.383 | |
| 1.0, 2D | On, 0.015 | 0.565, 0.633 | |
| On, 0.086 | 0.567, 0.551 | ||
| 6°, 7.55 m | 01, 0.2, 0.42, 0.6, 1D | Off, 0.0 | 0.0, 0.0 |
| 0.8, 1D | Off, 0.0 | 0.0, 0.03; 0.431, 0.069; 1.27, 0.281; 0.099, 0.320; 0.313, 0.913; 0.196, 0.205; 0.586, 0.660 | |
| 1.0, 1D | Off, 0.0 | 0.556, 0.083; 1.214, 0.266; 0.108, 0.318; 0.321, 0.770; 0.224, 0.2164; 0.601, 0.573 | |
| 1.0, 2D | On, 0.01 | 0.787, 0.087; 2.293, 0.314; 0.174, 0.372; 0.615, 0.950; 0.393, 0.2785; 0.904, 0.912 | |
| On, 0.08 | 0.061, 0.023; 0.043, 0.076; 0.003, 0.239; 0.028, 0.068 |
In order to study possible influence of the cross-field heat source on the divertor plasma sheath, for case ϑ = 6° we consider the heat source of different strength and different ratios of the ion to electron partitions (see the table 1). In all simulations we consider floating divertor plates, i.e. the total current to the each divertor plate is zero.
The simulations have been performed on the Helios and the Marconi supercomputers using from 1024 to 4096 processors. The CPU time required per simulated case depend on the resolution and vary from 6 × 10⁴ to 7 × 10⁵ processor hours.
4. Simulation results
4.1. Plasma profiles
Poloidal profiles of the different plasma parameters from the inner (left side) to the outer (right side) divertor plates are plotted in the figures 9 and 10 and correspond to the sets with θ = 1.5° and θ = 6°. There is no principle difference for the case with θ = 3° and the corresponding plots are omitted. In the figures 9(f) and 10(f) are plotted the zoomed inner plasma profiles. We consider 6 runs from the each set labeled by 1–6 (see the table 1). From these plots we see, that (i) the divertor density peaking increases with the increasing plasma recycling and the impurity content, and (ii) in some cases the ion parallel velocity and the potential are not monotonic in the divertor plasma.

Figure 9. Plasma poloidal profiles in the SOL for θ = 1.5°. Here and below 1–6 correspond to the runs labeled in the table 1. (f) The normalized density, the ion-parallel and the potential profiles in the inner divertor plasma (run 2).
Download figure:
Standard image High-resolution image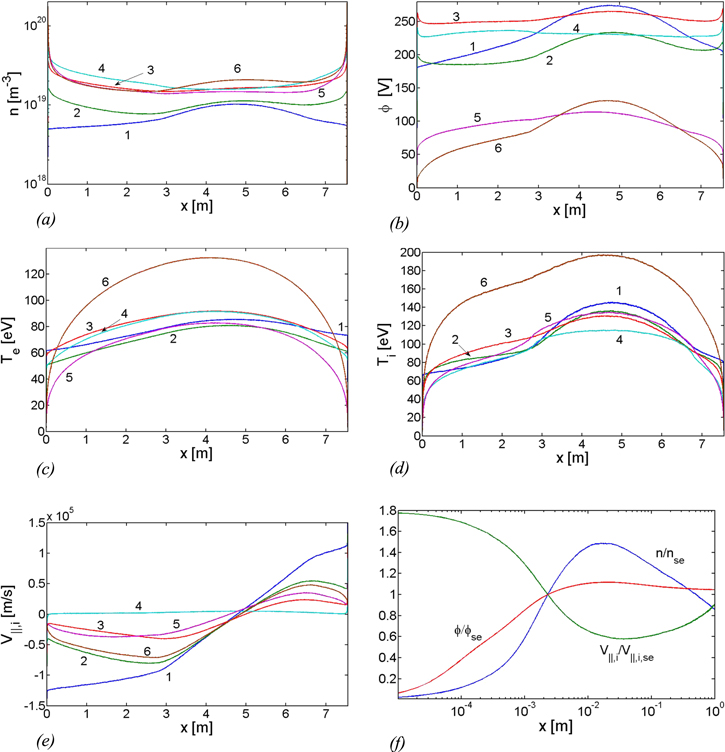
Figure 10. Plasma poloidal profiles in the SOL for θ = 6°. (f) The normalized density, the ion-parallel and the potential profiles in the inner divertor plasma (run 2).
Download figure:
Standard image High-resolution imageIt has to be noted that the dependence of plasma profiles on the inelastic processes (plasma–neutral and plasma–impurity interaction) is not linear. E.g. with increasing strength of these processes increases the plasma collisionality; as a consequence the electron upstream SOL temperature might increase due to increased thermal coupling with hotter ions. The cases without the impurity correspond to the sheath-limited SOL, while others, with a strong electron temperature gradient, correspond to the conductive-limited regime [1].
In all cases the ion (D+) flow becomes sonic at the distance of the order of few ion gyro-radii from the divertor plates (see figure 11,  is defined below). The SEs are identified as a points, where the classical Bohm–Chodura condition (4) is satisfied (the concentration of C+ ions is small at the SE and its contribution to the boundary condition can be neglected). The cases with R = 0 are kind of degenerate: due to absence of any inelastic process the ion flow becomes sonic far away from the divertor plates. Still, for consistency also in this cases we consider the SE as the point defined by the Bohm–Chodura condition. The polytrophic coefficient has a smooth profile in the vicinity of the SE, see figure 12, and the Mach number is well defined there [75, 82].

Figure 11. Normalized position of the sheath entrance, lSE, for different SOL collisionalities and angle θ. Here and below we consider the electron elastic SOL collisionality 
Download figure:
Standard image High-resolution image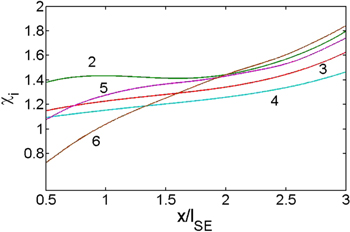
Figure 12. Profiles of the D+ ion polytropic coefficient in the vicinity of the SE. The case θ = 6°.
Download figure:
Standard image High-resolution imageFor convenience we introduce the elastic SOL (νsol) and sheath (νse), and the inelastic sheath ( ) collisionalities as follow:
where s is directed along the magnetic field and  is the density of the energy loss due to the inelastic collisions. Note,
  does not represent a traditional collisionality, but characterizes the effectiveness of the inelastic collisions in the sheath.
4.2. Plasma sheath parameters
Plasma sheath collisionalities are plotted in the figure 13. In agreement with our qualitative estimates (see the figures 3 and 4) for sufficiently high SOL collisionalities the sheath becomes Coulomb collisional, but it still remains inelastic-weakly collisional. As it is expected, the sheath elastic collisionality increases with the SOL collisionality. Here and below we plot results from the runs labeled as 1–6 in the table 1 (the exceptions will be noted explicitly).
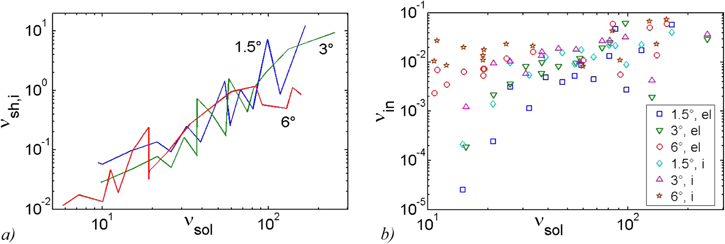
Figure 13. Elastic (a) and inelastic (b) plasma sheath collisionalities versus SOL collisionality.
Download figure:
Standard image High-resolution imageThe electron and the ion temperatures at the SE are plotted in the figure 14. The electron temperature at the SE is strongly influenced by the impurity concentration in the divertor plasma and not necessarily follow the SOL collisionality. Contrary to this, the ion temperature has more pronounced dependence on the SOL collisinality. As a result, the ion to electron temperature ratio at the SE can be lager (a typical assumption used in plasma sheath study), as well as smaller than 1. For shallow angles, θ = 1.5°, 3°, the net C+ sputtering and its concertation in the divertor plasma is lower. As a result, in these cases the electron cooling rate and  are lower too. As we will see below, this has consequences for the SHTC.
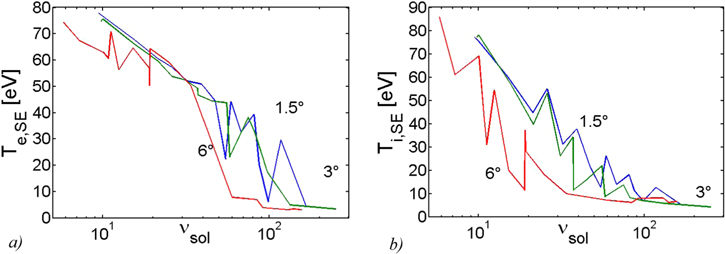
Figure 14. Plasma temperature at the SE. (a) Electrons, (b) ions.
Download figure:
Standard image High-resolution imageThe normalized potential drop across the sheath and the normalized height of the potential peak in the presheath are plotted in the figure 15. Sensitivity of these values against the strength of the cross-field heat source is given in the figure 16. As we can see: (i) the sheath potential drop can deviate from its classical value by the factor up to 2.5; (ii) in agreement with the qualitative estimate there exists a collisionality range when the potential is peaking in the presheath; (iii) this peaking exists only in the high plasma recycling cases without a strong electron-impurity interaction; (iv) the both values depend weakly on the relative strength of the cross-field electron heat flux.

Figure 15. The potential drop across the sheath (a) and the relative height of the potential peak in the presheath (b). In (b) the cases without potential peaking are not plotted.
Download figure:
Standard image High-resolution image
Figure 16. The potential drop across the sheath (a) and the relative height of the potential peak for different electron heat sources.
Download figure:
Standard image High-resolution imageIn the figure 17 are plotted the ion polytrophic coefficients at the SE for different SOL collisionalities and different strengths of the electron heat source. For a high collisionality χi stays within the isothermal, 1, and the magnetized adiabatic, 1.5, limits.
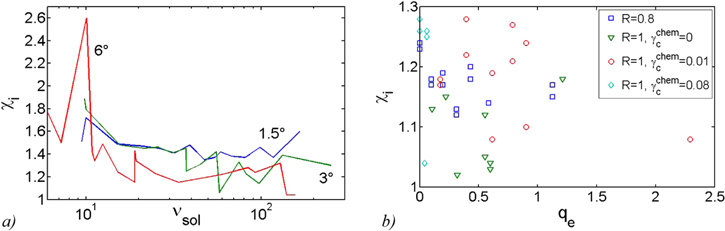
Figure 17. The ion polytrophic coefficient at the sheath entrance (a) and its sensitivity against the electron heat source (b).
Download figure:
Standard image High-resolution imageThe SHTC are plotted in the figure 18. Note, results from all runs are plotted and not just the ones labeled by 1–6. For convenience we introduce the total SHTC, γ, which is usually used for the estimation of the plasma energy loads to the PFC and its generalization including the energy load of the neutral particles, γn:

where  is the neutral particle (in our case the D atom) energy flux to the divertor plates.
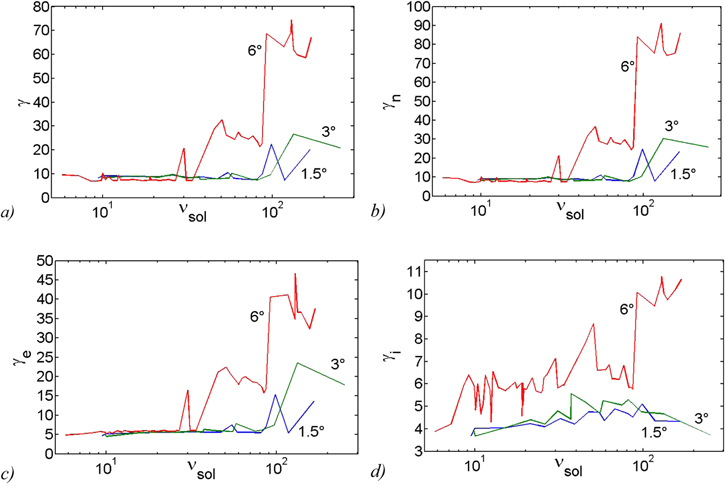
Figure 18. SHTC versus SOL collisionality. (a) Total plasma, (b) plasma and D atoms, (c) the electron and (d) the ion SHTCs.
Download figure:
Standard image High-resolution imageAs one can see: (i) for a high SOL collisionality the total SHTC exceeds the classical value by the factor up to 7; (ii) the neutral particle contribution can be of the order of 10% and more, hence it can not be neglected; (iii) mainly the electrons are responsible for the increased SHTC, although the ion SHTC can exceed the classical value by the factor 3; (iv) the SOL collisionality is not the only parameter directly defining the SHTC, e.g. for the same collisionality the SHTC for different angles differ significantly. These results will be explained in the next section.
For completeness, in the figure 19 is plotted the Mach number for C+ ions at the divertor SE. With increasing sheath collisionality increases the friction between the D+ and the C+ ions. As a results, Mc can reach its upper limit defend by the main ion velocity


Figure 19. C+Mach number at the sheath entrance.
Download figure:
Standard image High-resolution image4.3. Energy, velocity and angular distribution functions
In the figures 20–22 are plotted the energy and the parallel velocity distributions of the plasma particles at the SE. As one can see, (i) there is a clear presence of the super-thermal particles originating from the upstream SOL, and (ii) there is no strict cut-off in the parallel velocity distributions at  for the electrons and at
  for the ions, respectively. The latter is a consequence of the finite sheath collisionality. The both effects increase with the plasma recycling and the electron cooling rate and are stronger for the case with less shallow angle θ = 6°.

Figure 20. Energy (a), (c) and parallel velocity (b), (d) distribution functions of the plasma particles at the sheath entrance. (a), (b) For the electrons, (c), (d) for the ions. The case θ = 1.5°.
Download figure:
Standard image High-resolution image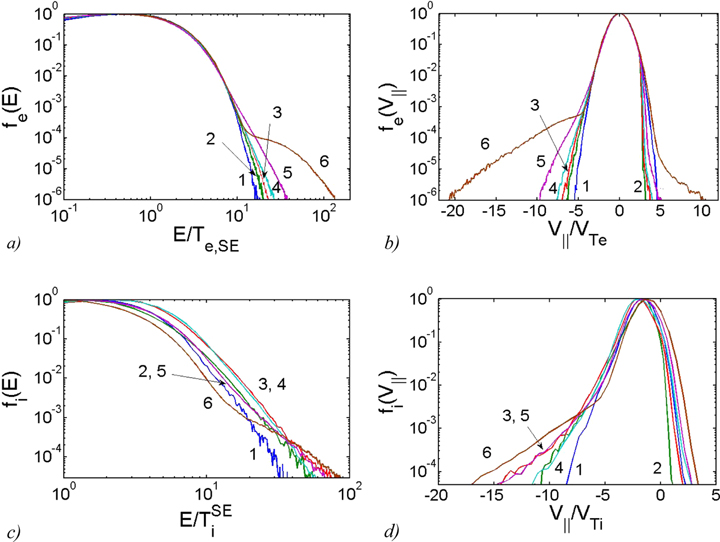
Figure 21. Energy (a), (c) and parallel velocity (b), (d) distribution functions of the plasma particles at the sheath entrance. (a), (b) For electrons, (c), (d) For ions. The case θ = 3°.
Download figure:
Standard image High-resolution image
Figure 22. Energy (a), (c) and parallel velocity (b), (d) distribution functions of the plasma particles at the sheath entrance. (a), (b) For the electrons, (c), (d) for the ions. The case θ = 6°.
Download figure:
Standard image High-resolution imageThe position of the peak value of the ion parallel velocity distribution function is defined by the ion acceleration in the presheath, i.e. by the potential drop in the presheath, which is directly related to the electron temperature there. As a result, it is affected by the electron cooling rate, e.g. the ion acceleration in the presheath is significantly smaller for the case with θ = 6° in the presence of the impurity (see the figure 22(d)).
In the figure 23 are plotted the angular and the energy distribution functions of the D+ ions absorbed at the inner divertor plate. There is no principle difference with the similar plots for the outer divertor plate and the latter is not plotted. For a low collisional regime (R = 0) the angular and the energy distribution functions are localized near  and
and  which is in agreement with the sheath classical model [1, 34]. With increasing sheath collisionality the distribution functions are becoming broader. As for the energy distribution functions at the SE there is a clear evidence of the super-thermal particles.

Figure 23. Angular (a), (c), (e) and energy (b), (d), (f) distribution functions of the D+ ions absorbed at the inner divertor plate. (a), (b), (c), (d) and (e), (f) correspond to the cases with θ = 1.5°, 3° and 6°, respectively.
Download figure:
Standard image High-resolution image5. Discussion of the obtained results
The present simulations indicate that practically none of the classical sheath conditions formulated in the section 2 is satisfied in a high recycling divertor plasma sheath. But most of the divertor sheath parameters still do not deviate drastically from the classical values. E.g. the ion parallel velocity and potential profiles are not monotonic in the presheath, but at the distance of a few ion gyroradii the ion flux becomes sonic, i.e. there exists a classical SE where the Bohm–Chodura condition is satisfied. Note, no flow reversal has been observed, because it is a two-dimensional effect [1]. Also the corresponding potential drop across the sheath is of the order of the classical value: in our simulations it agrees with the classical value within the factor 2.5. But there are number of new features, which have to be taken into the account for estimation the particle and the energy fluxes to the divertor plates and of the corresponding PSI processes. Namely
1. the angular and the energy distribution functions of the ions impinging the divertor plates are broader than it is predicted by the classical model. The broadening increases with the collisionality of the sheath;
2. the SHTC in the diveror sheath can exceed the classical value by order of magnitude. We identify the super-thermal plasma particles, mainly the electrons, originating from the upstream SOL, to be responsible for this increase. Below we present a simple model reproducing these result.
Let us assume that the velocity distribution function of electrons at the SE consists of double-Maxwellian [36]:
where the sub-index 'omp' denotes the parameters at the OMP,  is the concentration of the hot election fraction originating from the OMP region and assume that
  The corresponding SHTC is given as
This SHTC depends on three parameters: on the normalized potential drop across the sheath, ψ; on the OMP to SE temperature ratio, τ, and the hot particle concentration somp. The electron SHTC normalized to the classical value is plotted in the figure 24 for different hot particle concentration and temperature ratios. As one can see, already for moderate temperature gradients (τ = 20) even one percent of the hot particle concentration population can cause SHTC increase by the factor 5.
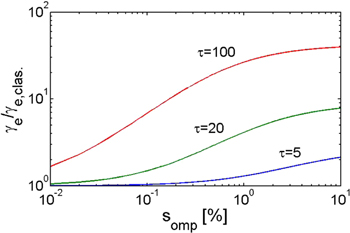
Figure 24. The electron SHTC for different hot particle concentrations.
Download figure:
Standard image High-resolution imageFor stronger temperature gradients (τ = 100) the presence of 0.1% hot particles is sufficient to increase the electron SHTC by the order of magnitude.
In order to study the applicability of this simple model we fit the electron energy distribution functions at the sheath edge by the double-Maxwellian distribution function. As an example in the figure 25 are plotted the distribution functions for the cases θ = 1.5°,5, 3°,5 and 6°,5,6. The concertation of the hot electron population, obtained from this fitting are used to calculate the corresponding electron SHTC using the equation (10). The results for the cases θ = 1.5°, 6° are plotted in the figure 26 indicating a fairly good agreement with the PIC simulation results.

Figure 25. Electron energy distribution function at the sheath entrance and the corresponding double-Maxwellian distribution function (dashed red line). (a)–(c) correspond to the runs θ = 1.5°,5, 3°,5 and 6°,5,6, respectively. The upper index is the run label.
Download figure:
Standard image High-resolution image
Figure 26. The SHTC obtained from the PIC simulations and from the equation (10). (a) The case θ = 1.5°; (b) the case θ = 6°.
Download figure:
Standard image High-resolution image
The SHTC for a high recycling divertor plasma sheath have been measured experimentally too [83–88]. These results are quite contradictory: e.g. in [83, 87] classical values, γ ∼ 8–10, of the SHTC are obtained, in [84, 86, 88] 'unphysically' low, γ ∼ 2–3, values have been reported and in [85] γ up to 20 and more have been measured. Probably the reason of such disagreement is the complexity of the interpretation of the plasma probe measurement in a high recycling regime, as well as a strong sensitivity of the SHTC to the SOL plasma parameters. These measurements have been made for different, or same machines with different plasma conditions. The experimental results might be also influenced by the processes not included in our model, such as the turbulence in the SOL (e.g. see [89]) and the cross-field drifts [1].
One has to take care when applying our results to the next generation magnetic fusion devices. E.g. due to extremely high density divertor plasma in ITER (of the order of 1021 m−3 and more) the divertor surface roughness effects might become important. In this case the local magnetic field inclination angle increases significantly, so that the secondary electron contribution can not be neglected any more, as well as the cross field gradients might become important. Also the temperature ratio at the OMP and SE becomes of the order of 100 and more, so that even a small deviation from the Maxwellian distribution functions in the upstream SOL might strongly influence the divertor SHTC.
The presence of super-thermal particle tails of the energy distribution functions at the SE, as well as the sheath collisionality, are independent of the current regime, therefore we expect that obtained results can be generalized to non-floating cases too.
At the end we note that the obtained results are applicable not only to the tokamak divertor sheath, but also to the plasma sheath in other devices with a strong temperature gradients towards the wall.
Acknowledgments
This work has been carried out within the framework of the EUROfusion Consortium and has received funding from the Euratom research and training programme 2014–2018 under grant agreement No 633053. The views and opinions expressed herein do not necessarily reflect those of the European Commission. The author acknowledges the support by the Austrian Science Fund project P26544-N27.