

Abstract
A direct acceleration scheme to generate high-energy, high-charge electron beams with an intense few-cycle Laguerre–Gaussian (LG) laser pulse was investigated using three-dimensional particle-in-cell simulations. In this scheme, an intense LG laser pulse was irradiated onto a solid density plasma slab. When the laser pulse is reflected, electrons on the target front surface are injected into the longitudinal electric field of the laser and accelerated further. We found that the carrier-envelope phase (CEP) of the few-cycle laser pulse plays a key role in the electron injection and acceleration process. Using a three-cycle LG laser pulse with  and an appropriate CEP, an about 60 pC electron beam could be obtained at a maximum energy of 16 MeV. In comparison, when a laser pulse with mismatched CEP was used, a total of 4 pC electron beam with a maximum energy of 3.5 MeV was obtained. Linear scaling of electron energy to the laser strength was shown up to
  at which a quasi-monoenergetic electron beam of 850 MeV energy with a charge equal to 600 pC could be obtained. These results demonstrate that high-energy electron beams can be stably generated through direct laser acceleration using a CEP-controlled intense few-cycle LG laser pulse.
Export citation and abstract BibTeX RIS
1. Introduction
As technology for generating and manipulating ultra-short intense laser pulses develops, many studies have been conducted to generate high-energy electron beams using such lasers [1]. Efforts to generate high-energy electron beams using lasers have been pursued in two directions: wakefield acceleration [2] and direct laser acceleration (DLA) [3]. If the electric field of the laser is sufficiently strong, the electrons acquire relativistic energy within the distance of the laser wavelength, and thus the electron beam travels with the laser for a long distance and accelerates to high energy. This process is called DLA in vacuum. Laser–plasma-based wakefield electron acceleration has been quite successful [4, 5]. Laser wakefield acceleration experiments have shown that petawatt class lasers could be used to generate multi GeV electron beams [6, 7]. Despite the advantages of a very high acceleration gradient and simplicity, effective DLA schemes are still not well developed.
The DLA of electrons to high energy in a vacuum using an intense laser has been the subject of many studies. The ponderomotive acceleration mechanism of electrons by an intense laser field has been proposed and experimentally demonstrated [8–12]. Electron acceleration by a vacuum beat wave accelerator using two crossed laser beams was proposed and examined [3, 13]. The experimental observation of energetic electrons with MeV energies driven by the Lorentz force of an intense laser was reported [14]. DLA schemes by the laser electric field are proposed and demonstrated [15–17]. Electron acceleration by an intense radially polarized (RP) laser pulse was suggested by an analytical theory and particle-in-cell (PIC) simulations, and examined experimentally [18–25]. In this scheme, the radial ponderomotive force confines electrons near the laser axis, and the oscillatory longitudinal electric field of the laser pulse directly accelerates them. DLA using Laguerre–Gaussian (LG) laser beams has been studied using test particle simulations and PIC simulations for targets such as underdense plasmas, wires, and plasma mirrors (PMs) [26–31]. In these works, the role of the ponderomotive force and the direct laser field interaction with electrons were studied.
In the acceleration of electrons by an oscillating electromagnetic field, the initial phase of electrons when electrons are injected into the electromagnetic field is very important. Efficient DLA using an external injection method is, however, extremely difficult [23]. An injection scheme using a PM was proposed and then demonstrated for DLA using the ponderomotive drive by a linearly polarized laser pulse [11]. A PM is a promising candidate of the electron beam injector for DLA by a longitudinal electric field [30]. In a DLA with a laser field oscillating in the longitudinal direction, the laser does not have to be a long pulse. Rather, it is advantageous to use shorter pulses (see the supplementary material available online at stacks.iop.org/PPCF/64/055013/mmedia). The carrier-envelope phase (CEP) of a laser pulse becomes an important characteristic when intense few-cycle laser pulses are used.
When a short laser pulse impinges on a solid density target with a short preplasma at the front surface, electrons in near-critical density preplasma are driven by the ponderomotive force and the longitudinal electric field (Ez
) of the driving laser. The electrons are accelerated into the vacuum through the push-pull mechanism [32]. The electron beam is trapped and accelerated by the electric field oscillating in the propagation direction when the laser pulse is reflected from the PM. Electrons near the front surface of the target are pushed to the inside of the target by the ponderomotive force of the laser pulse and the longitudinal electric field near the laser axis. When the electrons with sufficient energy are placed in the acceleration phase of the electric field in the forward direction ( ), they are further accelerated by this electric field and are completely separated from the target and accelerated in the vacuum.
The electron beam continuously interacts with the driving laser pulse during propagation. In this process, the electron beam can have a phase slip in the oscillating longitudinal electric field of the laser pulse because the electron speed is lower than that of the laser pulse in vacuum. Since the energy of an electron beam decreases in the decelerating phase,  (to minimize the reduction), the maximum acceleration should be made within a single half-period of the laser pulse, and the amplitude of the electric field should be sufficiently small in the dephasing period. This is made possible by focusing the laser beam into a small spot size. If the focus is as tight as possible, the intensity of the electric field in the propagation direction at the focusing position is large and the Rayleigh range is short, so the intensity of the electric field is weakened within a short distance through dispersion. This is why the CEP of the laser field is important when an intense few-cycle pulse is used for DLA.
The reason for using the LG laser beam is that it is readily applicable to attain high intensity by using a reflective phase plate [33]. Since there is no angular dependence of Ez , a stable acceleration structure is created. In addition, it can be effectively applied to many applications requiring an electron beam with angular momentum or to the generation of γ-rays with angular momentum through single-pulse nonlinear Compton scattering.
2. 3D PIC simulation
The spatial intensity profile of the circularly polarized (CP) LG beam has a donut shape with an electric field oscillating in the propagation direction around the laser axis given as [34]:
where  , w(z), R(z), and z0 refer to the beam waist, the curvature radius, and the Rayleigh range of a Gaussian beam [35]. Here, ψ0 is the control parameter for the CEP of a laser pulse. The CEP plays an important role in the interaction of a few-cycle laser pulse with plasmas [36]. The parameters defining an LG mode are the orbital angular momentum number l and the spin angular momentum number s [34]. We note that for the anti-parallel (AP) LG beam in this work,
  in equation (1), the Ez
field oscillates with finite amplitude and is strongest at the laser axis. For the parallel LG beam,
in equation (1), the Ez
field oscillates with finite amplitude and is strongest at the laser axis. For the parallel LG beam,  in equation (1), the DLA does not occur since there is no longitudinal component of the electric field at the laser axis. Instead, Ez
is created with a donut profile around it. In this case, as is expected from equation (1), a stable electron acceleration structure is not formed because of the θ dependence of Ez
.
in equation (1), the DLA does not occur since there is no longitudinal component of the electric field at the laser axis. Instead, Ez
is created with a donut profile around it. In this case, as is expected from equation (1), a stable electron acceleration structure is not formed because of the θ dependence of Ez
.
Three-dimensional PIC simulations were performed on the interaction of few-cycle LG laser pulses and PMs. A CP three-cycle laser pulse is converted into an AP LG laser beam. In this work, we only used the lowest-order AP LG beam mode ( ). The laser field strength was
  before the conversion. Then, a0 was increased from 10 to 100 to examine the scalability. We used the Smilei code for the numerical simulations [37]. The laser pulse was launched by initializing the
  field at the boundary such as:

where φ is the oscillation phase of the laser field according to time-space, and φ0 is the actual CEP control parameter given in the input conditions. The  contains the donut intensity profile given by the LG function. The normalized temporal profile of the laser pulse electric field strength was given by the formula [38] (see the supplementary material for a detailed description):

where  , and T is the optical period, which means a three-cycle (
 ) laser pulse. The spot size of the laser pulse was defined using
  in (1). The laser pulse energy in the
  case for
  nm is around 4 mJ, or 1 TW in power. And the laser pulse energy in the
  (100) case corresponds to 100 mJ (10 J), or 25 TW (2.5 PW) in power. The laser pulse was focused on the target surface. We compare two cases,
  and
and  in (2), to verify the dependency of the injection process on the CEP. We also tried a parallel LG beam case,
  in (1), and confirmed that there is no significant electron beam acceleration in this case. The target was modeled by a
  -thick plasma slab of electron density
  with a short scale length (
 ) preplasma on the front surface. This configuration ensures the laser pulse is reflected at the surface. For
  , we enabled the strong field quantum electrodynamics of the Smilei code. This did not give significant change in the electron beam acceleration results in terms of the energy spectrum, acceleration process, and emittance compared to the results when the strong-field quantum electrodynamics are disabled. The simulation domain size was
  with a grid cell size of
  , where z is the laser propagation direction. The moving window was used to follow the laser pulse and fast electrons for a long time up to 60 T after the start of the laser–plasma interaction. All the boundaries were set to absorb any electromagnetic field and remove passing-through particles.
3. Results and discussion
The interaction process was investigated through the change in electron density distribution according to the longitudinal electric field over time. Figure 1 shows the details of the interaction between the three-cycle LG laser pulse and the solid density plasma target with a short scale length preplasma on the front surface. The target is located on the left side. The laser pulse is incident from the right and then is reflected off the front surface of the target and propagates to the right. Temporal evolution of the electron density of the target and the longitudinal electric field profile at early interaction stages are shown in figure 1. Figures 1(a), (c), and (e) are for  , and (b), (d), and (f) are for
  . Figures 1(a) and (b) are for t = 0 T, (c), (d) are for t = 1.25 T, and (e), (f) are for t = 2.25 T.
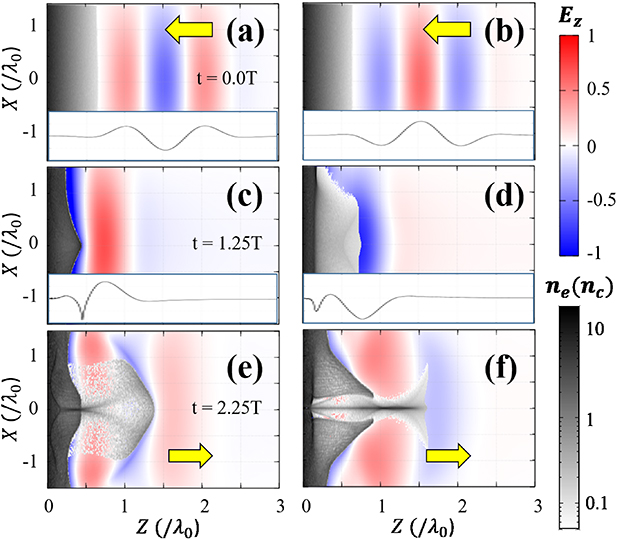
Figure 1. Temporal evolution of the interaction process of an intense few-cycle AP LG laser pulse with a PM slab: (a), (c), and (e) are for  and (b), (d), and (f) are for
  . The insets in (a), (b), (c), and (d) are the line plots of the longitudinal electric field along the laser axis. The yellow arrows show the laser propagation direction, and T is the period of the laser pulse.
Download figure:
Standard image High-resolution imageElectrons are driven by both the ponderomotive force and the laser electric field and are injected into the acceleration phase of the longitudinal electric field. At first, the electrons at the target surface are pushed to the −z direction by the ponderomotive force of the laser pulse. An electrostatic field is generated between the displaced electrons and the ions remaining at their original position. When the longitudinal electric field of the laser changes to negative ( ), the sum of the laser field and the electrostatic field drives the electrons in the +z direction. Figures 1(c) and (d) show the point at which the front part of the laser pulse is reflected. In both cases, electrons are injected into the region where the Ez
field of the laser is negative (blue). For
), the sum of the laser field and the electrostatic field drives the electrons in the +z direction. Figures 1(c) and (d) show the point at which the front part of the laser pulse is reflected. In both cases, electrons are injected into the region where the Ez
field of the laser is negative (blue). For  , when the laser pulse is reflected (figure 1(c)), a high-density electron beam is formed and trapped at the front of the acceleration phase (negative Ez
region). In this case, electrons are injected where the incident/reflection of the laser overlaps, and the electrons are positioned (
, when the laser pulse is reflected (figure 1(c)), a high-density electron beam is formed and trapped at the front of the acceleration phase (negative Ez
region). In this case, electrons are injected where the incident/reflection of the laser overlaps, and the electrons are positioned ( ) at the front of the strong
  cycle (acceleration phase) of the reflected pulse. For
  , on the other hand, electrons are injected into the
  cycle of the laser, where the strength of Ez
is smaller than that in the
cycle of the laser, where the strength of Ez
is smaller than that in the  case. From figure 1(d) we see that the electrons are located at the back of the
  cycle (
 ).
).
The electrons overcome the electrostatic field and are accelerated to the vacuum by the longitudinal component of the laser electric field (Ez
). The electron beam is overshot from the plasma to the vacuum and is then accelerated directly by the laser field. Then, as shown in figures 1(e) and (f), the leading electrons are trapped at the front of the laser pulse Ez
. For  , the electrons injected before are stably accelerated. At
  , a high-density electron beam begins to form near the laser axis. In particular, at the part where the Ez
field of the laser pulse is strongest, electrons are accelerated very quickly. On the other hand, for
, a high-density electron beam begins to form near the laser axis. In particular, at the part where the Ez
field of the laser pulse is strongest, electrons are accelerated very quickly. On the other hand, for  , a bunch of electrons is initially formed and is located in the acceleration phase of Ez
, but dephasing occurs quickly because these electrons are trapped at the end of the acceleration phase (figure 1(f)).
, a bunch of electrons is initially formed and is located in the acceleration phase of Ez
, but dephasing occurs quickly because these electrons are trapped at the end of the acceleration phase (figure 1(f)).
For  , the formation of a high-density electron column with a surrounding lobe structure near the laser axis is clearly visible at
  (figure 1(f)). When electrons near the laser axis accelerate away from the target, the resulting space charge force attracts the electrons at the periphery around the central axis, forming the high-density electron column. The electrons, which were accelerated during the next cycle of the laser, are pushed to the periphery due to the space charge force of the high-density column at the center, resulting in the lobe-shaped distribution. The electron beam column in the middle maintains high density by the space charge force with this lobe structure. The high-density electron structure that is longer than half of the laser wavelength hinders the formation of a regular acceleration structure. Because of the weaker laser Ez
than that of the
(figure 1(f)). When electrons near the laser axis accelerate away from the target, the resulting space charge force attracts the electrons at the periphery around the central axis, forming the high-density electron column. The electrons, which were accelerated during the next cycle of the laser, are pushed to the periphery due to the space charge force of the high-density column at the center, resulting in the lobe-shaped distribution. The electron beam column in the middle maintains high density by the space charge force with this lobe structure. The high-density electron structure that is longer than half of the laser wavelength hinders the formation of a regular acceleration structure. Because of the weaker laser Ez
than that of the  case and the formation of the high-density electron column, the acceleration is relatively weak compared to the
  case.
case.
The electron injection status is clearly seen by comparing the electron density and electric field distribution along the laser axis. Figures 2(a) and (b) show the lineout of Ez
and Ne
along the laser axis at t = 3 T. For  (figure 2(a)), the front part of the electron distribution is located where the
  cycle of the reflected laser pulse is the strongest (z ≈ 2,
  ). For
  (figure 2(b)) the front part of the electron distribution is located at the back of the
  period of the reflected laser pulse, where
  . Because a phase slip occurs according to the difference between the laser pulse speed and the electron speed, it is expected to dephase soon.
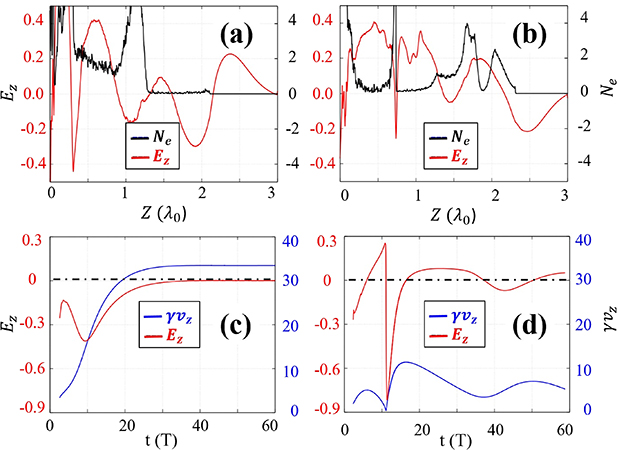
Figure 2. (a), (b) The longitudinal electric field (red: left axis) and electron density (black: right axis) along the laser axis at t = 3 T for (a)  and (b)
  . (c), (d) The strength of the longitudinal electric field (red curves: left axis) that an electron experiences and the longitudinal momentum (blue curves: right axis) of it over time for (c)
  and (d)
  . The dash-dot lines in (c) and (d) indicate
  .
.
Download figure:
Standard image High-resolution imageThe acceleration dynamics of the injected electrons were investigated by tracing the typical motion of the electrons accelerated to the highest energy. Figures 2(c) and (d) show the temporal evolution of the strength of the Ez
field felt by electrons and the  value for each case. Figure 2(c) is for
  and (d) is for
  , respectively. For
  , there is an oscillation of one period in the Ez
field at the beginning. When considering only the laser field, in the first half cycle, the value of the electric field is greater than 0 and the electron should be decelerated. However, due to the electrostatic charge separation field, the total longitudinal electric field resulted in a continuous acceleration with
, there is an oscillation of one period in the Ez
field at the beginning. When considering only the laser field, in the first half cycle, the value of the electric field is greater than 0 and the electron should be decelerated. However, due to the electrostatic charge separation field, the total longitudinal electric field resulted in a continuous acceleration with  . The electric field increases monotonically after passing the minimum at
  , and is almost saturated as it passes
  , and then remains near 0. In the whole process, because the electron is accelerated to the end within only one negative Ez
period until the intensity of the laser pulse becomes very weak, the electron is continuously accelerated and
, and then remains near 0. In the whole process, because the electron is accelerated to the end within only one negative Ez
period until the intensity of the laser pulse becomes very weak, the electron is continuously accelerated and  increases with time and saturates to about
  as Ez
approaches 0.
as Ez
approaches 0.
For  , completely different dynamics occur. The dynamics could be expected from figure 2(b): (i) early dephasing because the electron is located near the end of the acceleration phase, (ii) deceleration by
  , and (iii) repeats the acceleration and deceleration over time due to the laser-pulse–electron phase slip. As shown in figure 2(d), at
  , the electron experiences the field sign change from negative to positive, which means the interaction changes from acceleration to deceleration. At
  , the interaction changes sharply from the deceleration phase to the acceleration phase, and the electron experiences a strong acceleration field accordingly. However, at about
  it quickly dephases again to enter the deceleration phase. Because of this relatively fast change between the acceleration and deceleration phases, the electron energy gain is not so large,
  . Afterward, the Ez
felt by the electron oscillates, and the
. Afterward, the Ez
felt by the electron oscillates, and the  of the electron oscillates accordingly. When
  is large, the time it travels with the laser increases, and when
  is small, the opposite happens, so the oscillation of
  becomes saw-tooth shaped. Finally, as the laser pulse becomes very weak due to dispersion, the
  value of the electron converges to about 5. The final energy for
  is 1/6 of the
  case.
case.
The acceleration efficiency of the electron beam depends on whether it undergoes continuous acceleration or dephasing. Figure 3 shows the acceleration results at the time t = 20 T (refer to figures 2(c) and (d)). Figures 3(a) and (b) show the distribution of the longitudinal component of the electric field and the density distribution of electrons on the XZ plane for  and
and  . At this time, the acceleration of electrons is near saturation for
  , while high-energy electrons are in the deceleration phase for
  (which is identified from figures 2(c) and (d)). For
  , electrons in the first bunch overlap with Ez
at
, electrons in the first bunch overlap with Ez
at  and are distributed in the accelerating phase to form a sub-fs electron micro-bunch. For
  , on the other hand, electrons in the front are dephased and exist in the
  region, that is, they are decelerating. The lobe structure seen in figure 1(f) expands radially after the laser pulse passes as the ponderomotive force of the laser weakens. Accordingly, the high-density column in the middle also expands to the periphery by its own space charge force. This makes the back tail structure of electrons in figures 3(a) and (b).
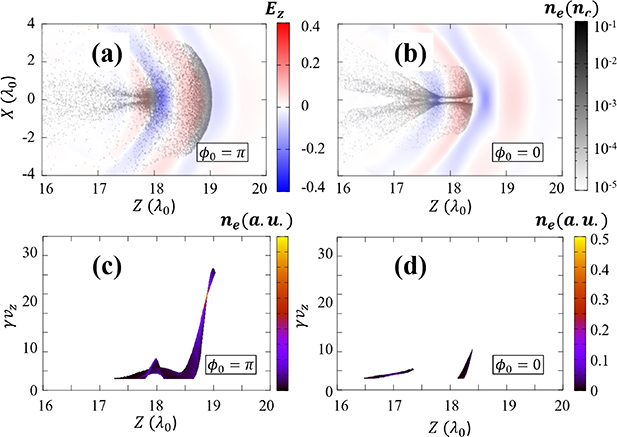
Figure 3. The electron density profile overlapped with the longitudinal electric field at t = 20 T for (a)  and (b)
  . The comparison of the z-
 phase distribution of electrons for (c)
  and (d)
  .
.
Download figure:
Standard image High-resolution imageThe electron acceleration results are well represented by the z- phase space distribution, which is shown in figures 3(c) and (d) for each case. Here, we show only electrons with
  . Figure 3(c) shows that the electrons in the leading bunch of figure 3(a) are accelerated to the highest energy. It can be seen that
  is continuously distributed from 3 to 28. The small peak located at
  shows that the electrons located in the acceleration phase among the second bunch are accelerated. Other electrons with
  are in the decelerating phase. In figure 3(d), electrons have very low
  values compared to those in figure 3(c). The first bunch is distributed up to
  , but it is already dephased and is decelerating. Electrons around z ≈ 17 are also dephased and are no longer accelerated.
The characteristics of the electron beams at t = 60 T for both  and 0 cases are shown in figure 4. Figure 4(a) shows the electron energy spectra. The maximum electron energy is
  MeV when
  , which is much larger than
  MeV when
  . The charge amount
  appears to be more than three times larger. The reason is that, as shown in figures 1 and 3, for
  , most of the initially injected and accelerated electrons dephased, lost energy, and left behind the laser pulse during propagation. On the other hand, for
  , most of the initially injected and accelerated charges are located in the acceleration phase of the laser pulse without dephasing, so that the high-charge is maintained in the high-energy region. For
  , a local minimum of
  is formed at E ≈ 7 MeV, and there is a local maximum at E ≈ 11 MeV. The total charge contained in the higher energy peak,
  7 MeV, is about 25 pC. The double-peak spectrum is expected from figures 3(a) and (c). Those electrons injected in the strongest part of the laser pulse form the high-energy peak, while electrons captured in a relatively weak part form a second micro-bunch, resulting in the low-energy peak.
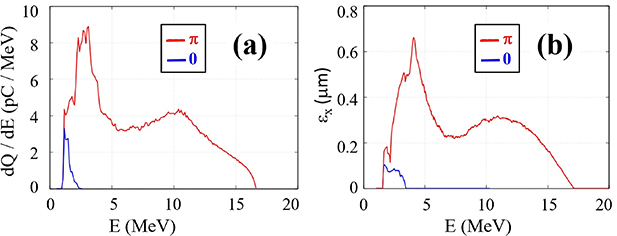
Figure 4. Characteristics of the electron beam accelerated from a PM by an intense AP LG beam at t = 60 T. (a) Electron energy spectra for  (red) and for
  (blue). (b) Beam emittances are shown as a function of energy.
Download figure:
Standard image High-resolution imageBeam emittance is an important parameter when characterizing high-energy charged particle beams. Figure 4(b) shows the electron beam emittances in  m as a function of energy. The rms beam emittance is defined at each energy value and calculated as follows [39]:

where β and γ are the relativistic parameters for the electron energy and  . The emittance for
  is much smaller than that for
  . For
. For  , at the low-energy peak position,
  is about three times larger than that for
  and the emittance is about four times larger. For
  , the emittance curve also shows a double-peak structure, which overlaps with the energy spectrum. While electrons are accelerated by a strong laser field, the emittance of the electron beam is mainly maintained by a strong longitudinal magnetic field [30]. However, when the intensity of the laser field is weakened to an insignificant level and only the electron beam proceeds, the electron beam is further dispersed by the self-field. This effect is stronger at lower energy and higher electron beam density. The beam emittance is relatively large, ∼0.5 µm at the low energy region for
  7 MeV, while the maximum emittance reaches around
  m at the high-energy part for
  11 MeV. This emittance value is either less than that measured in the laser wakefield acceleration experiment, which resulted in about
  m [40], or higher than that estimated to be ∼0.1 µm in a more recent experiment [41].
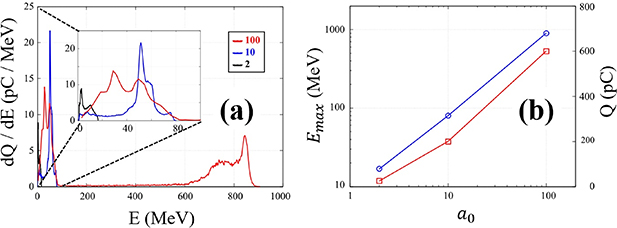
To check the scalability of the CEP-dependent acceleration process, we ran two additional simulations for  with a0 values of 10 and 100. The results are shown in figure 5, where the electron energy spectrum and maximum energy scaling are plotted as functions of energy and a0, respectively. The electron energy spectra in figure 5(a) show quasi-monoenergetic peaks in both
  and
and  cases. For
  , the total charge in the high-energy peak, around 50 MeV, is about 200 pC, while it is 600 pC for
  in the peak around 800 MeV.
Figure 5. (a) A comparison of electron energy spectra for a0 values of 2, 10, and 100. (b) Maximum electron energy (blue: left axis) and the total charge contained in the high-energy quasi-monoenergetic peak (red: right axis) as a function of a0. The inset of (a) is the enlargement of the low-energy part.
Download figure:
Standard image High-resolution image
The electron maximum energy in figure 5(b) shows the linear scaling as a function of a0. This linear scaling in a0 is the manifestation of field-driven acceleration: the DLA by the longitudinal electric field, while the donut-shaped intensity profile confines the electron beam. The same scaling was observed in the acceleration by an RP pulse [3, 18]. The scaling of the total charge contained in the quasi-monoenergetic peaks shown in figure 5(b) implies the proposed scheme could be a good candidate to generate high energy electron beams with high charge up to hundreds of pC.
4. Conclusion
The generation of a high-charge, high-energy electron beam through the DLA by an intense few-cycle LG laser pulse was investigated using 3D PIC simulations. When a few-cycle intense LG laser pulse is reflected from a solid density plasma slab, electrons on the target front surface are injected into the laser's longitudinal electric field and accelerated further. We found that the CEP of the few-cycle laser pulse plays a key role in this acceleration mechanism. Using a three-cycle LG laser pulse with  and appropriate CEP, we could obtain an about 60 pC electron beam with a maximum energy of 16 MeV, while a total of 4 pC electron beam with maximum energy of 3.5 MeV was achieved for the mismatched CEP case. Linear scaling of electron energy to the laser strength was observed up to
  . For
. For  , a quasi-monoenergetic electron beam of 850 MeV peak energy with a total charge amounting to 600 pC could be obtained. These results show that by using an intense few-cycle LG laser pulse combined with the CEP stabilization technique, it is possible to stably generate a high-energy, high-charge electron beam through DLA at a short distance.
Acknowledgment
This work was supported by IBS (Institute for Basic Science) under IBS-R012-D1 and by GIST Research Institute (GRI).
Data availability statement
All data that support the findings of this study are included within the article (and any supplementary files).