
Abstract
Edge localized modes (ELMs) in H-mode plasmas erode plasma-facing components (PFCs) and lead to impurities in the core, reducing confinement. This study analyzes D2 pellet injection on the DIII-D fusion experiment used as an ELM mitigation technique applied during the 2016 tungsten Metal Rings Campaign to reduce W erosion during ELMs. The 400.9 nm photon wavelength line emission intensity of tungsten atoms (WI) filterscope channels and Langmuir probes were used to infer the gross erosion rate of tungsten-coated tiles installed in the divertor of DIII-D. D2 mass injection rates ranging from 34 to 41 arbitrary units (A.U.) and no D2 injection resulted in a similar total W erosion rate during ELMs (intra-ELM). On average, results show a 29% increase in the total gross W erosion rate with intermediate mass injection rates (∼13–23 A.U.) compared to the no pellets and the highest injection rate cases. On average, the fast D2 mass injection rate cases had 15% less erosion in the inter-ELM phase than the case with no pellets. Generally, higher D2 mass injection rates increased the ELM frequency, and the highest injection rates reduced the average erosion per ELM and fractional carbon impurities at the top of the pedestal by nearly 40% when compared to the no-pellet case. As expected, a higher D2 pellet injection rate led to a higher plasma density and lower plasma temperature in the divertor. Additionally, an increasing divertor inter-ELM plasma electron density directly correlated to more frequent pellet injection and a decrease in both the average gross intra-ELM W erosion and the total gross intra-ELM W erosion rate. Simulations of intra-ELM erosion using the 'free-streaming plus recycling model' (FSRM) underestimate W erosion during pellet injection by about 30% on average. The discrepancies between the experimental measurements and the FSRM intra-ELM W erosion predictions are postulated to be due to C/W material mixing. A simple analytic mixed-material model is presented and results in better agreement with the experimental data. These results highlight the importance of incorporating the effects of a mixed-material layer in the analysis of PFC erosion.
Export citation and abstract BibTeX RIS

Original content from this work may be used under the terms of the Creative Commons Attribution 4.0 license. Any further distribution of this work must maintain attribution to the author(s) and the title of the work, journal citation and DOI.
1. Introduction
1.1. Overview
During tokamak operation in the high confinement mode (H-mode), a strong pressure gradient near the edge of the plasma often leads to a periodic instability known as an edge localized mode (ELM). ELMs originate near the edge of the confined plasma in a region known as the pedestal and are caused by a peeling-ballooning instability that expels the confined plasma towards plasma-facing components (PFCs) [1]. ELMs occur in numerous H-mode scenarios and can lead to significant damage of PFCs, particularly in the divertor. In the event of a detached or partially detached plasma, the inter-ELM W erosion is near zero due to a significant drop in electron temperature (Te), and subsequently, a large decrease in the ion impact energy (Ei) to the divertor target. Unmitigated ELMs, however, may 'burn through' detachment and erode the divertor material in the intra-ELM phase [2]. If the ELMs are not sufficiently mitigated, the intra-ELM phase is expected to dominate future tokamak PFC erosion. Unmitigated ELMs on the order of 10% of the plasma stored energy are expected in ITER [3]. An intense unmitigated ELM in ITER may result in an incident heat flux hot enough to melt or crack the plasma facing material (PFM) [4]. Consequently, mitigating intra-ELM erosion is vital for the survival of PFCs.
D2 pellets injected at thermal velocities (approximately 100–200 m s−1) near the low-field side midplane of the tokamak, where instabilities are significant, have been demonstrated to mitigate ELM effects by triggering smaller and more frequent ELMs. D2 pellet injection destabilizes the pedestal, perturbing the ballooning stability boundary [5, 6]. Smaller ELMs result in a lower energy deposited in the divertor per ELM, providing a mechanism to remain below damage threshold of impacted PFMs. Moreover, D2 pellet injection (as well as D2 gas puffing) can help to induce plasma detachment from the divertor by lowering the divertor Te sufficiently (Te < 5 eV). Low Te values will result in reduced ion temperatures and impact energies to the divertor target. This lowers the physical sputtering (PS) coefficients of D and C on W to lessen W erosion. However, increasing the amount of injected D2 generally increases the divertor incident D+ ion flux, potentially increasing W erosion if a sufficiently low plasma Te is not achieved. D2 injection also affects pedestal conditions. As in the divertor, pedestal Te may decrease, and plasma density (ne) may increase with larger frequencies of injected D2 pellets. As discussed below, the fractional change in Te and ne is generally smaller in the pedestal relative to the divertor. The ideal D2 pellet injection frequency must also avoid significantly increasing the collisionality of the pedestal to maintain adequate plasma confinement and performance.
The following sections will discuss the associated modeling, experimental procedure, results, and conclusions regarding ELM mitigation via pellet pacing performed during the Metal Rings Campaign (MRC). Section 2 describes the free-streaming plus recycling model (FSRM) used to predict the size of ELMs and the C/W Mixed Material Model used to account for the impact of a C deposition layer on the divertor. This C deposition layer reduces W erosion. Section 3 describes the approach to measuring W erosion via visible light spectroscopy and the use of Langmuir probe (LP) to acquire divertor plasma parameters. Section 4 highlights how varying D2 pellet injection frequencies impacts W erosion and divertor and pedestal parameters during the intra-ELM phase. Moreover, section 4 includes information on the heat flux and pedestal energy drop associated with ELMs. Section 5 concludes the paper and provides insight to future fusion devices.
2. Modeling
2.1. The FSRM
The analytic 'free-streaming model' treats ELMs as a 1D plasma filament that detaches from the pedestal into the scrape-off layer, where particles rapidly (<1 ms) stream to strike the divertor target [7, 8]. Sputtered and reflected ions often ionize near the target and re-accelerate back to the divertor, a process known as recycling. The particles undergo repeated recycling, interacting with the divertor target numerous times. This is the general conception for the FSRM, a relatively simple 1D model used to predict the divertor erosion during ELMs [9, 10]. The FSRM predicts intra-ELM erosion based off plasma parameters that are assumed to be relatively constant during the inter-ELM phase but fluctuate over the duration of an ELM. The inputs to the FSRM include the peak characteristic ne and Te at the pedestal top and the divertor, impurity concentrations at the pedestal top, the effective recycling coefficient (Reff), the parallel length of the ELM filament (LELM), the parallel intra-ELM magnetic connection length (L||), and the magnetic field pitch angle to the divertor. It is worth noting that the divertor ne and Te inputs are taken approximately 0.5 ms after the ELMs start (just before the ELM crash) while the pedestal ne and Te inputs are taken approximately 0.5 ms before the ELMs start. Contrary, all other inputs are averaged values over the whole-time frame of the shot analyzed. Then, expressions are derived for the ion flux (Γ||,FS), and heat flux (q||,FS) to the divertor target. Mathematical expressions for the ion and heat flux and further discussion of the FSRM can be found in [9].
A cartoon diagram of plasma–material interactions (PMIs) during an ELM impact on a mixed-material C/W surface is illustrated in figure 1. Previous analysis has indicated that most W erosion is caused by either free streaming (FS) D+ ions or FS C6+ to the divertor target [10]. Additionally, there exists a small but non-negligible W erosion contribution due to recycling C atoms re-striking the divertor. W self-sputtering is negligible due to the low concentration of eroded W compared to the concentration of D and C species at the divertor.
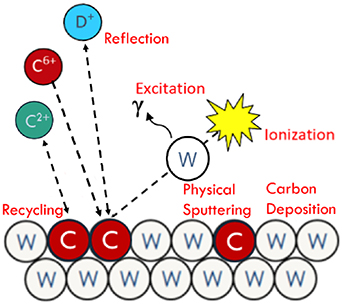
Figure 1. Cartoon diagram of W divertor PMI over the MRC. Reprinted from [10], Copyright (2011), with permission from Elsevier.
Download figure:
Standard image High-resolution imageThe magnetic field pitch angle to the divertor is around 2°, although sheath and gyro-orbit effects result in an ion impact angle much more normal. As a result, incoming D and C ions will strike the W divertor at angles ranging up to 85° to the plasma-material interface. On average, the incident ions collide around 45° from the normal. Therefore, an incident ion angle of 45° was assumed to calculate PS yields in this work.
2.2. C/W mixed material model
Importantly, C ions interacting with the surface not only physically sputter W but may deposit on or embed in the W surface prior to recycling back into the main plasma. Previous modeling work has indicated that a higher percentage of C deposition results from a larger concentration of C relative to the D concentration in the divertor [11]. Additionally, a lower plasma temperature will result in a lower C Ei to the divertor, leading to a decreased chance of recycling C ions overcoming the sheath potential to reach the core. Moreover, a low Ei will prevent C from implanting farther than several monolayers below the surface. Thus, the probability of near-surface C deposition on the W divertor increases with a lower C Ei to the divertor. In this paper, it is postulated that C deposition on the W surface acts as a barrier protecting the W target from direct interactions with incoming ions, reducing sputtering. Here we present an analytic model for the fraction of W and C present in the deposition layer and incorporate such effects into the FSRM.
Consider, in steady-state, a near-surface mixed-material carbon/tungsten layer with normalized W/C concentrations  and
and  . No other impurities are assumed present such that
  . The total gross erosion yield (Y) of C and W are thus given by the following set of equations, modified from Abrams (2021) [12]:


where  is the carbon impurity flux fraction,
  . As discussed above, we assume self-sputtering by tungsten flux to the surface,
  , is negligible. We also assume W sputtering by D is negligible because the average
  for D is below the threshold energy for this process to occur. Accounting additionally for the reflection coefficients (R), the total flux
  of material leaving the surface is given by:


The carbon impurity flux fraction  is assumed to be equal to the value at the pedestal top and is thus a known quantity provided by charge exchange spectroscopy diagnostics on DIII-D [13]. In steady state, the values of
  and
and  do not change. We assume the net erosion regime for carbon, where
  . Steady state implies that the amount of material leaving the mixed-material layer is equal to the amount of material entering the layer, for both species (C and W). For C, this can be expressed as follows:


Solving for  :
:
After solving for the normalized C concentration,  , the FSRM simulated intra-ELM erosion can account for the effects of a mixed C/W material. Currently, it is assumed that W erosion only stems from the concentration of W in the deposition layer, with negligible PMI beyond the several-monolayer thick mixed material layer. Hence, the intra-ELM W erosion simulated by the FSRM is multiplied by the normalized W concentration,
  , to correct for a C/W mixed material effect.
3. Experimental procedure
The experiments described here were performed during the DIII-D MRC, in which two toroidally symmetric rows of W-coated tiles were installed in the DIII-D lower divertor [14]. In the plasma discharge analyzed in this work, 1.3 mm diameter, 0.9 mm length cylindrical D2 pellets were injected at frequencies up to nominally 60 Hz near the low-field side midplane of the tokamak using two pellet guns capable of injection up to 30 Hz [5]. These D2 pellets were injected during H-mode, attached plasma conditions. In-situ experimental W divertor erosion estimations were obtained via visible light spectroscopy. WI (400.9 nm) filterscopes [15] obtained photon emission intensity rates from sputtered neutral W atoms while LPs and Thomson scattering (TS) were used to obtain Te and ne at the divertor surface and pedestal top, respectively. LPs used V–I scanning with a spatiotemporal resolution of 4 mm width LP tips to capture the resolution of the transient Te caused by ELMs [15]. Figure 2 gives an overview of the diagnostics used in this study, as well as a typical magnetic equilibrium during this experiment.
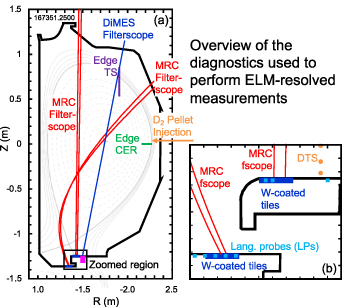
Figure 2. Overview of the diagnostics used to perform ELM-resolved measurements during the MRC. Reprinted from [9], Copyright (2011), with permission from Elsevier.
Download figure:
Standard image High-resolution imageIn figures 2(a) and (b), the MRC filterscopes in red contain the WI filterscope chords, each viewing several radial positions of the W-coated tiles installed in both the divertor floor and shelf. Notably, this image is a poloidal projection of views that are not parallel to the poloidal plane. This causes the viewing chords to look 'bent.' The location of the TS views to measure pedestal plasma conditions are also overlaid.
For this experiment, the outer strike point (OSP) position resided at approximately a major radius of R = 1.42 m on the divertor shelf, shown in the upper right portion of figure 2(b). The W photon emission signal obtained from the WI filterscope chord viewing the OSP position is then converted to gross W erosion using the ionization/photon (S/XB) method. The S/XB method essentially multiplies the measured photon emission rate by the atomic ionizations per photon, also known as the S/XB coefficient. The S/XB coefficient is a function of the divertor Te and ne, which evolve significantly over the ELM cycle, making the S/XB coefficient time dependent. The S/XB coefficients for W atoms as a function of Te and ne are obtained via the open Atomic Data Analysis Structure [16]. Specifically, the peak characteristic Te and ne just after the ELM crash (∼0.2–0.8 ms after the ELM start) and corresponding S/XB coefficient are considered for the peak photon intensity of the ELM. Then, ne is scaled directly to the photon intensity of the ELM in respect to the relative ELM start time, while Te is scaled to the time varying Te in respect to the relative ELM time. Hence, equation (8) below gives the calculation for the W gross erosion rate:
Here I is the photon intensity and dz is the integration of the W atoms along the line of sight of the WI filterscope chord. LPs were specifically installed on the W tiles to measure the relevant divertor Te and ne used to obtain the S/XB coefficient and W gross erosion rate. Lastly, Dα (656.19 nm) filterscopes were used to detect ELM start times to enable the analysis of W erosion relative to the ELM start time, a procedure known as 'coherent averaging.' The peak Dα filterscope signal determined the most significant ELMs worth measuring for this analysis. Thus, only ELMs that contain a peak intensity above some threshold fraction of the most intense ELM analyzed over the shot timeframe were included. Table 1 shows this threshold as a fraction of the most significant ELM for each shot and timeframe. Characteristically, there was generally a band of 'large-sized', 'mid-sized', and 'small-sized' Type-I ELMs for each shot timeframe. For all shots, the 'large-sized' and 'mid-sized' ELMs were analyzed, as W erosion from the 'small-sized' ELMs was negligible. The respective divertor Te and ne profiles used to obtain the S/XB coefficients differed for the 'large-sized' and 'mid-sized' ELMs as more intense ELMs contained slightly greater divertor Te and much greater divertor ne. Since the divertor ne directly scales to the ELM intensity, the majority of the 'mid-sized' ELMs resulted in a small contribution of erosion compared to the 'large-sized' ELMs. On average, the mid-sized ELMs only contained about 3% of the total intra-ELM gross W erosion rate. In the no pellet pacing cases, this average contribution increased to around 10% of the total intra-ELM gross W erosion rate. More details on this analysis workflow can be found in previous papers on this topic [9, 10].

Figure 3. Mass injection rate as a function of D2 nominal injection frequency. Data interpolated by the linear trend line are shown in red.
Download figure:
Standard image High-resolution imageTable 1. Plasma shot summary.
| Shot number | D2 mass injection rate (A.U.) | FELM (Hz) | Threshold | Time range (ms) |
|---|---|---|---|---|
| 349 | 0 | 8 | 0.25 | 2200:3200 |
| 351 | 13.3 | 25.7 | 0.25 | 2150:2500 |
| 351 | 14.8 | 20 | 0.25 | 2550:3000 |
| 351 | 35.6 | 24.4 | 0.25 | 3050:3500 |
| 351 | 34.7 | 20 | 0.25 | 3550:4000 |
| 351 | 40.7 | 22.2 | 0.3 | 4050:4500 |
| 352 | 40.6* | 16 | 0.25 | 2550:3050 |
| 353 | 0 | 15 | 0.25 | 2100:2900 |
| 354 | 0 | 9.4 | 0.25 | 2600:4200 |
| 355 | 38 | 13.3 | 0.4 | 3900:4800 |
| 356 | 40.6* | 18.5 | 0.4 | 3400:4700 |
| 357 | 25 | 20 | 0.3 | 2600:3000 |
| 358 | 27* | 22.5 | 0.25 | 2600:3000 |
| 358 | 27* | 20 | 0.2 | 3200:3800 |
*Interpolated D2 mass injection rates from figure 3.
4. Results
Intra-ELM and inter-ELM W erosion rates have been analyzed for nine different plasma shots over various time ranges with relatively constant parameters for validation of the FSRM.
Table 1 below lists the D2 mass injection rate in arbitrary units and the analyzed time ranges. Shot time ranges were selected after the OSP position settled within 1 cm of the MRC LPs installed in the W tiles (R = 1.41 and 1.42 m).
Due to uncertainties in the number and size of the D2 pellets injected over the time course of each analyzed shot, the pellet masses are determined with a microwave cavity diagnostic [17]. However, an absolute calibration of the cavity signal for this dataset is unavailable, thus the technique only provides a relative comparison of pellet masses and the total injected mass is given in arbitrary units. For the majority of the shots and associated time ranges, the D2 mass injection rate in arbitrary units has been determined by conducting a linear fit to the cumulative injected mass over time. Figure 3 shows the D2 mass injection rates for each shot time range plotted as a function of nominal D2 pellet injection frequency.
Unfortunately, it is a time consuming process to interpret the cumulative D2 mass injection over a given time range. Thus, the shots with asterisks in table 1 were not mass calibrated. Instead, the linear trend line is applied to interpolate these data points, shown in red in figure 3.
For shot 167351, the D2 injection rate was increased from a nominal pellet pacing injection frequency of 20–60 Hz in increments of 10 Hz. In actuality, the second D2 pellet gun applied did not perform up to 30 Hz and the actual amount of D2 injected at a given nominal injection frequency can vary as displayed in figure 3. Consequently, the nominal pellet injection frequency has been supplanted by the D2 mass injection rate. Nonetheless, each nominal frequency lasted 500 ms and D2 pellet injection started once a stable OSP position was obtained near R = 1.42 m, around 2.1 s into the plasma shot. Figure 4 shows the measured divertor Te and ne and time range-averaged D2 mass injection rate as a function of plasma shot time for shot 167351.
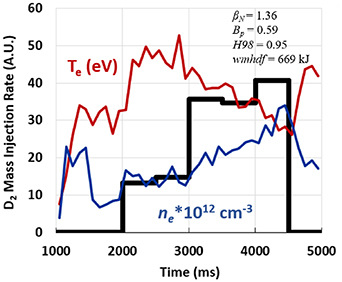
Figure 4. Time history of the D2 mass injection rate and divertor electron density and temperature in DIII-D discharge 167351. Y-axis values represent D2 mass injection rate and divertor electron density and temperature. βN, βp, H98, and wmhdf plasma confinement parameters are also shown.
Download figure:
Standard image High-resolution imageIncreasing frequency of injected D2 pellets causes an increase in the divertor ne but a decrease in the divertor Te. The increase of divertor Te just after 2 s into the plasma shot is the result of the stabilization of the OSP position. From here, the divertor Te steadily decreases with D2 pellet injection while divertor ne steadily increases. Interestingly, for this particular shot, the ELM frequency (fELM) remained relatively constant as the pellet pacing frequency increased. For this shot, there were about ten 'large-sized' ELMs for each nominal pellet injection frequency time range. The divertor and pedestal ne and Te have been measured over the course of each plasma shot. As discussed previously, these parameters are direct inputs into the FSRM, helping predict average intra-ELM divertor erosion for current and future tokamak devices. Notably, plasma confinement parameters are largely unaltered by the changing D2 mass injection frequency in this shot. Figure 5 shows the characteristic peak intra-ELM Te and ne just before the ELM crash at the pedestal and divertor for each plasma shot.

Figure 5. Measured divertor and pedestal electron temperature and density just before the ELM crash as a function of D2 injection frequency for all cases listed in table 1. The partially transparent data points represent the pellet pacing frequency sweep, shot 167351.
Download figure:
Standard image High-resolution imageSimilar to the divertor plasma conditions at the time just before the ELM crash, ne increased and Te decreased at the pedestal top with increasing pellet pacing frequencies. Notably, the divertor intra-ELM regime plasma conditions demonstrated a much larger fractional change in comparison to the pedestal plasma conditions. Changes in the pedestal Te just before the ELM crash showed the least correlation to the D2 pellet injection frequency. When comparing the average divertor and pedestal ne and Te over the shot time (in inter or intra-ELM regime), similar trends for the divertor plasma conditions are seen while an increasing pedestal ne and decreasing pedestal Te correlates more strongly to an increasing nominal D2 pellet injection frequency. In contrast, varying the D2 pellet injection rate resulted in inconclusive changes to the core plasma stored energy [18] and other plasma confinement parameters.
Typically, the 'large-sized' and 'mid-sized' ELM bursts in this experiment lasted 1–4 ms before the W erosion returned to inter-ELM levels. LPs measured an accurate divertor ne profile as a function of time relative to the ELM start. Over the time course of each ELM, the spatiotemporal resolution of the LPs were able to capture a few divertor Te measurements per ELM. Coherent averaging was then used to determine an appropriate divertor Te input, averaged from 0 to 1 ms relative to the ELM start time, for the S/XB coefficient and FSRM. Moreover, similar processes were used to estimate the divertor ne and Te in past MRC analyses involving D2 pellet injection [9, 10]. The average W gross erosion rate per ELM as a function of time relative to the ELM start is shown in figure 6 for each pellet injection frequency in discharge 167351.
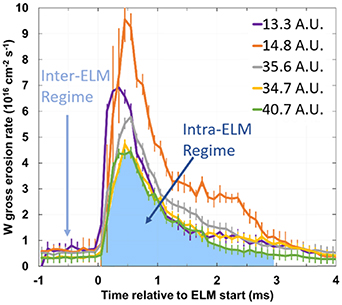
Figure 6. Measured average W gross erosion rate per ELM during DIII-D discharge 167351 for the time ranges indicated in table 1. Each time range corresponds to a D2 mass injection rate averaged over the respective time range.
Download figure:
Standard image High-resolution imageOver the course of shot 167351, the peak intra-ELM W gross erosion rate was the greatest at the nominal 30 Hz pellet pacing frequency, corresponding to the D2 mass injection rate of 14.8 A.U. The inter-ELM W gross erosion rate at 14.8 A.U. was similar the 13.3 A.U. case, but greater than any of the higher injection frequencies. At injection frequencies higher than 14.8 A.U., both the intra-ELM and inter-ELM W erosion rates at the OSP position monotonically decreased. Unfortunately, the OSP position did not stabilize for this shot until the 20 Hz nominal pellet pacing frequency, corresponding to the D2 mass injection rate of 13.3 A.U. This prevents comparing the W erosion rate to the no pellet case for this shot. The difference in W erosion for the various D2 mass injection rates for shot 167351 is attributed to both changing divertor conditions and ELM amplitude, although the ELM frequency remained relatively unchanged. D2 injection may have initially increased erosion due to increasing ne before a large enough amount of D2 was injected to decrease Te sufficiently. When averaging the gross W erosion rate at the OSP position across the entire discharge, inter-ELM erosion exceeded intra-ELM erosion by approximately 150%. This is due to the plasma residing in inter-ELM phase about 85%–90% of the time. On average, an ELM resulted in transient W erosion about 300% greater than the steady-state in the inter-ELM regime.
In this section, we compare the measured intra-ELM W erosion against the calculations of the FSRM as a function of increasing D2 pellet injection frequencies. As discussed in section 2.1 above, the FSRM provides a framework to calculate the average W erosion per ELM given the experimentally measured pedestal and divertor conditions. Figure 7 compares this average intra-ELM W erosion between the FSRM and experimental data. The standard deviation of the raw WI emission signals is considered as the error bar, shown for all measured average intra-ELM erosion shots. Thus, the error is considered on an ELM-by-ELM basis. The FSRM calculations both with and without the mixed-material model are shown in figure 7.
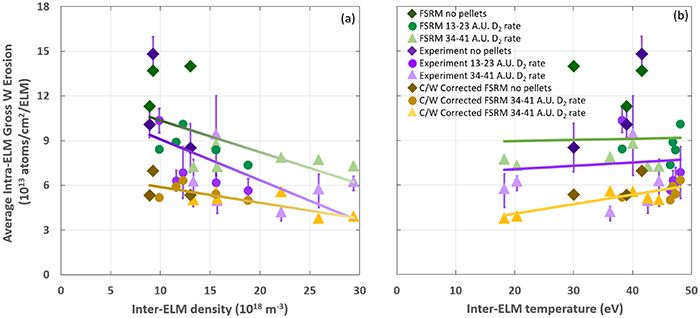
Figure 7. Average gross W erosion rate per ELM measured experimentally (purple), calculated by the FSRM with no mixed-material model (green), and with the mixed-material model (gold), as a function of plasma electron inter-ELM (a) density and (b) temperature. Linear fits are overlaid in all cases.
Download figure:
Standard image High-resolution imageOn average, the FSRM under-predicts the experimentally measured average intra-ELM W erosion by 28% when the mixed-material model is included. When mixed-material effects are neglected, the FSRM over-predicts the average intra-ELM W erosion by 24%. Thus, it is possible that W erosion may occur outside the C deposition layer, although many other aspects of the model not discussed here can also be improved upon [10].
Figure 7 shows the average intra-ELM gross W erosion decreasing with increasing inter-ELM density and increasing with increasing inter-ELM temperature. Generally, an increasing divertor plasma density leads to greater erosion due to a higher incident particle flux. However, increasing D2 pellet injection frequencies also decreases the divertor Te and consequently the divertor Ei. Thus, the general trend supports decreasing erosion with increasing divertor ne, rather. Usually, the shots with a higher D2 mass injection rate contain a higher divertor inter-ELM density and lower inter-ELM temperature, supported by figures 4 and 7. The correlation between the average intra-ELM gross erosion and inter-ELM temperature is weaker than comparing the average intra-ELM gross erosion to inter-ELM density. In fact, the FSRM may suggest little to no erosion correlation to the inter-ELM temperature before incorporating the mixed C/W material model.
Next, figure 8 shows the measured total gross intra-ELM W erosion rate for all ELMs occurring as a function of inter-ELM density and temperature for each plasma shot listed in table 1. This rate is equal to the average erosion per ELM in figure 7 multiplied by the ELM frequency (number of ELMs over shot time). Additionally, figure 8 shows the predicted 'C-free' total gross W erosion rate. This quantity is an extrapolation to the total gross W erosion rate that would be experimentally measured if there was no C deposition, i.e. a mixed C/W layer did not exist. The predicted C-free total gross W erosion rate is obtained by dividing the measured experimental erosion by the calculated normalized surface concentration of W,  , as discussed in section 2.2 above.

Figure 8. Measured total intra-ELM gross W erosion rate (blue) and predicted gross W erosion rate in the absence of a C/W mixed material layer (red) vs. plasma electron inter-ELM (a) density and (b) temperature. Linear fits are overlaid in both cases.
Download figure:
Standard image High-resolution imageSimilar to figure 7, the total gross W erosion rate decreases with increasing inter-ELM density and increases with increasing inter-ELM temperature. Although, much weaker trends between the nominal pellet pacing frequency and total gross W erosion rate exist. The total gross W divertor erosion rate appears to be impacted more heavily impacted by the divertor conditions than ELM amplitude or ELM triggering physics. The predicted C-free gross intra-EM W erosion rate shows a similar trend compared to the inter-ELM density. Contrary, the relationship between the predicted 'C free' total gross W erosion rate and inter-ELM temperature looks relatively inconclusive.
Then, figure 9 shows the ELM frequency and average pedestal stored energy drop associated with an ELM and figure 10 shows the average peak intra-ELM heat flux, both as a function of D2 mass injection rate. The ELM frequency and heat flux values correspond to the 'large sized' Type-I ELMs discussed previously.
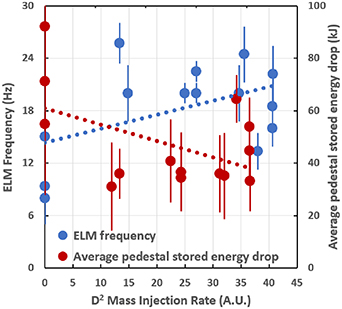
Figure 9. ELM frequency and average pedestal stored energy drop per ELM as a function of D2 mass injection rate.
Download figure:
Standard image High-resolution image
Figure 10. Average peak intra-ELM heat flux vs. D2 mass injection rate.
Download figure:
Standard image High-resolution image
The ELM frequency is lowest in the no pellet cases, but there is no clear distinction in the ELM frequency between the various D2 mass injection rates. Shots with D2 pellet injection may have had a higher ELM frequency due to a slightly higher pedestal density profile and/or infrequent triggering of ELMs, but results are unclear. Contrary, the average pedestal stored energy drop is highest for the no pellet cases and is lower for the D2 pellet injection cases. Once again, increasing the D2 mass injection rate further has an inconclusive effect. The peak intra-ELM heat flux associated with the ELM decreased steadily with increasing D2 mass injection. In past MRC and other DIII-D affiliated experiments, the peak intra-ELM heat flux and average pedestal stored energy drop monotonically decrease with increasing D2 mass injection, while the ELM frequency increases [5, 6]. In both figures 9 and 10, the error is considered the standard deviation of measurements associated with each ELM.
5. Discussion and conclusions
Most notably, the average ELM erosion decreased steadily with increasing D2 mass injection rate, which directly correlates to the higher inter-ELM densities shown in figure 7(a). Intermediate D2 mass injection rates (13–23 A.U.) seemed to result in a larger total gross W erosion rate and average W erosion per ELM (at the OSP) than the no pellet and 34–41 A.U. cases. This may be due to an increased D+ ion flux to the divertor compared to the no pellet case without a substantially lowered plasma temperature to sufficiently decrease the PS yield of D and C on W. Contrary, it is hypothesized that the 34–41 A.U. D2 mass injection rate reduced the divertor Te and Ei significantly enough to overcome the increasing ion flux to the target. While D2 pellet shots resulted in about twice the FELM as no pellets shots, many injection cases were not seen to pace the more numerous large ELMs above the threshold considered significant. Although, some of the 'mid-sized' ELMs accounted for in this analysis were likely triggered. D2 pellet injection led to relatively small changes in the pedestal plasma conditions opposed to the divertor plasma conditions and in most cases did not trigger ELMs by reaching the associated ballooning-limited boundary. Thus, the D2 pellet injection rate did not drastically impact the FELM. Besides the associated ELM triggering physics, there may exist an ideal pellet injection rate that lowers the Te and Ei at the divertor substantially enough to overcome the increasing ion flux to the target without significantly increasing the collisionality of the pedestal. These assertions are primarily supported through the pellet pacing frequency sweep shot (167351) and trends between the W erosion and inter-ELM density.
As expected, the divertor target and pedestal Te just before the ELM crash both decrease with D2 mass injection rate while the divertor target and pedestal ne just before the ELM crash increase. Commonly, a lower average gross W erosion per ELM also corresponds to a reduction in the peak heat flux deposited on the divertor with respect to time and an improvement in confinement performance [5, 6, 9]. Like in past MRC and other experiments, increasing the D2 pellet injection rate decreased the peak intra-ELM heat flux [5, 6]. On future devices with much larger and less frequent expected ELMs like ITER, reducing the peak intra-ELM heat flux becomes far more significant to avoid material melting and cracking in addition to longer term erosion.
It should also be noted that while this study is limited to W sputtering effects close to the strike-point, it was generally observed during the MRC that ELMs cause significantly more W erosion than the inter-ELM plasma when moving radially away from the OSP [19]. This is due to a large decrease in the Te with increasing distance from the OSP, thus decreasing the Ei to the divertor and PS yields of D and C on W. Likewise, past studies emphasize that larger ELMs will contain a wider heat flux footprint on the divertor than smaller ELMs [2, 20]. Additionally, higher D2 mass injection rates further decrease the divertor Te and reduce these PS yields as the distance from the OSP position increases. Hence, smaller, more frequent ELMs emerging from perturbations in the pedestal initiated by faster D2 pellet injection rates likely result in a smaller footprint on the divertor, also leading to a lower total W erosion rate. Therefore, it is likely that D2 pellets with a mass injection rate of 34–41 A.U. resulted in lower total W erosion rates than no pellets. Unfortunately, hardware and diagnostic limitations prevent verification of lower intra-ELM total intra-ELM W erosion rates with increasing distances from the OSP.
Overall, the FSRM provided reasonable estimations of the erosion per ELM given the various experimental inputted parameters. Some incorporation of the mixed C/W material layer is necessary to correct the overestimation, however. Likewise, refining the FSRM remains an ongoing effort, and incorporating the effects of a mixed material layer are one of many areas to improve upon. Incorporating the presence of a mixed material deposition layer enables far more accurate erosion estimations for current and future fusion devices with differing divertor and first wall materials. Moreover, mixed material models will help the fusion community understand the compatibility of various candidate divertor and first wall materials given various plasma conditions.
Recent studies during the SAS-VW divertor operation at DIII-D [21] have been carried out to further understand gross and net intra- and inter-ELM W erosion for various D2 pellet injection and gas puffing rates. It is expected that, for given upstream conditions, a lower divertor Te in the slot-like SAS-VW will lead to lower intra- and inter-ELM W erosion that seen in the MRC. D2 injection at the outboard midplane via pellets and gas puffing will be performed to evaluate their relative effectiveness in mitigating intra-ELM erosion.
Acknowledgments
This material is based upon work supported by the U.S. Department of Energy, Office of Science, Office of Fusion Energy Sciences, using the DIII-D National Fusion Facility, a DOE Office of Science user facility, under Award(s) DE-SC0019256 (UTK), DE-FC02-04ER54698 (DIII-D), and DE-AC05-00OR22725 (ORNL). Special thanks are given to Dr Tyler Abrams and Dr David Donovan, the DIII-D team, and the University of Tennessee at Knoxville for collaboration. Disclaimer: This report was prepared as an account of work sponsored by an agency of the United States Government. Neither the United States Government nor any agency thereof, nor any of their employees, makes any warranty, express or implied, or assumes any legal liability or responsibility for the accuracy, completeness, or usefulness of any information, apparatus, product, or process disclosed, or represents that its use would not infringe privately owned rights. Reference herein to any specific commercial product, process, or service by trade name, trademark, manufacturer, or otherwise does not necessarily constitute or imply its endorsement, recommendation, or favoring by the United States Government or any agency thereof. The views and opinions of authors expressed herein do not necessarily state or reflect those of the United States Government or any agency thereof.
Data availability statement
The data that support the findings of this study are available upon reasonable request from the authors.