
Abstract
The presented work highlights the role of residual weakly-bound surface electrons acting as an effective seed electron reservoir that favors the pre-ionization of diffuse barrier discharges (BDs). A glow-like BD was operated in helium at a pressure of  in between two plane electrodes each covered with float glass at a distance of
  . The change in discharge development due to laser photodesorption of surface electrons was studied by electrical measurements and optical emission spectroscopy. Moreover, a 1D numerical fluid model of the diffuse discharge allowed the simulation of the laser photodesorption experiment, the estimation of the released surface electrons, and the understanding of their impact on the reaction kinetics in the volume. The breakdown voltage is clearly reduced when the laser beam at photon energy of
  hits the cathodic dielectric that is charged with residual electrons during the discharge pre-phase. According to the adapted simulation, the laser releases only a small amount of surface electrons in the order of
  . Nevertheless, this significantly supports the pre-ionization. Using a lower photon energy of
  , the transition from the glow mode to the Townsend mode is induced due to a much higher electron yield up to
  . In this case, both experiment and simulation indicate a retarded stepwise release of surface electrons initiated by the low laser photon energy.
Export citation and abstract BibTeX RIS

Original content from this work may be used under the terms of the Creative Commons Attribution 3.0 licence. Any further distribution of this work must maintain attribution to the author(s) and the title of the work, journal citation and DOI.
1. Introduction
Barrier discharges (BDs) belong to the most common discharge types for industrial applications at atmospheric pressure [1–3]. Dielectric-covered electrodes restrict the breakdown current which allows the generation of non-equilibrium plasmas. Moreover, BDs are quite promising due to high chemical reactivity at comparatively low power consumption. That is why this discharge type has become indispensable for the surface treatment and modification of heat-sensitive materials as well as for biomedical use [4, 5]. In this context, the key position is addressed to laterally diffuse BDs, often referred to as the atmospheric-pressure glow discharge and the atmospheric-pressure Townsend discharge, respectively [6].
A crucial formation criterion for diffuse BDs is assigned to a sufficient pre-ionization, e.g., by secondary electron emission (SEE) and Penning ionization requiring the presence of species in metastable states. In this way, the long-living species act as a memory between consecutive discharge breakdowns. Also, the effective ionization rate during the breakdown must be moderate to avoid critical space charge formation and streamer development, and to allow an overlap of wide electron avalanches in lateral direction. For these reasons, diffuse BDs are typically operated in helium and nitrogen [7–11]. However, diffuse BDs are also observed in oxygen-containing systems, especially, when the operating frequency is low [7, 12, 13]. Since oxygen quenches the metastable states, their effective lifetime becomes much shorter than the discharge off-time under these conditions. As a consequence, another source of seed electrons must exist that provides the required pre-ionization. One possible and recently discussed process is the thermal desorption of residual weakly-bound electrons from the dielectric surface [14].
The accumulation of charge carriers at dielectric surfaces is most characteristic of BDs. Up to now, the physical nature of surface charges, their trapping and binding mechanisms, and their interaction with the discharge species are controversially discussed. It is assumed that negative surface charges are adsorbed electrons with low material-dependent binding energy. These electrons are either trapped in the shallow image potential just in front of the crystallographic boundary or in the conduction band (CB) just inside the dielectric, which depends on the solid's electron affinity [15, 16]. However, in general consensus, positive surface charges are defect electrons (positive holes) in the valance band caused by recombination of positive ions with electrons at the dielectric surface [17, 18].
Indeed, investigations of thermally stimulated current, thermoluminescence and optically stimulated luminescence revealed electron trapping centers in the order of  , which differs significantly from the valence-band electrons [19, 20]. Consequently, surface electrons can be removed more easily than intrinsic electrons, wherefore one has to distinguish between both species. The release of residual surface electrons by thermal influence, photons, excited species or radicals is assumed to favor the pre-ionization of diffuse BDs [17, 21, 22]. Experiments revealed that the lower the binding energy of surface electrons depending on the dielectric material, the higher is the probability to operate diffuse BDs in air [19]. Besides, streamer breakdown in air can be self-synchronized and triggered via surface electron desorption by incident photons coming from the discharge [23], and laser photons [24], respectively.
The presented work investigates the effect of released surface electrons on the pre-ionization of the diffuse BD in helium. Besides the laser photodesorption experiment, a one-dimensional numerical fluid simulation provides information about the influence of released surface electrons on the reaction kinetics in the discharge volume. The outline of this article is as follows. The experimental setup and the diagnostics are described in section 2. Section 3 briefly points out the most important features of the modeling. Finally, the characteristics of the laser photodesorption effect and its influence on the discharge mode are discussed in section 4 and section 5, respectively.
2. Experimental setup and methodology
2.1. Discharge configuration and gas supply
Figure 1 shows the plane-parallel discharge configuration. The high-voltage driven electrode made of copper as well as the grounded aluminum block were covered with float glass (thickness of  , permittivity of 7.6). Gap spacers (not drawn in the figure) made of polyether ether ketone defined the discharge gap width of
  . Four sidewise oriented orifices enabled the direct gas supply, the investigation of the optical emission from the discharge volume, and the laser guidance. The discharge cell was placed inside a vacuum chamber made of stainless steel that was pumped to a base pressure below
  before it was filled with helium (purity
  ). The operating pressure of
  was kept constant in the flowing regime (
 ) using a process pump (TRIVAC D25BCSPFPE) in combination with a diaphragm pressure gauge and a butterfly valve (MKS).

Figure 1. Sketch of the discharge configuration from side-view.
Download figure:
Standard image High-resolution image2.2. Electrical measurements
The discharge was operated with a sine-wave voltage  at a frequency of
  provided by a power supply (Trek PM04015). As illustrated in figure 2, the total transported charge
  was measured via an external capacitor (
 ) at the grounded electrode. The electrical signals were recorded by a digital oscilloscope (LeCroy 9304AM). The gap voltage

the discharge current without any displacement current
and the surface charge density on the upper dielectric
were recalculated by means of an appropriate electrical equivalent circuit, introduced in [25, 26]. Here,  and
and  are the capacitances of the gas gap and the dielectrics, respectively. Both quantities are calculated based on the assumption that the lateral discharge extent equals the circular electrode area
  .
.  is the total cell capacitance derived from the flat slope of the
  plot (Lissajous figure), and
  is the parallel capacitance beyond the lateral discharge extent.

Figure 2. Diagnostic setup: electrical measurements, optical emission spectroscopy, and laser beam guidance.
Download figure:
Standard image High-resolution image2.3. Optical emission spectroscopy
The optical emission originating from the discharge volume was depicted by a vertically moveable lens and detected by a photomultiplier tube (PMT, Hamamatsu R928) in combination with a monochromator (MC, Acton Research Corporation, SpectraPro, focal length of  ). The width of the horizontal slit at the entrance of the MC was
  , and the lens was moved in steps of
  . The spectral resolution of
  results from the fixed
  grating and the adjustable width of the vertical slits just in front and behind the MC. The PMT signal was recorded by the digital oscilloscope with a temporal resolution of
  .
.
2.4. Laser photodesorption
The photodesorption experiment was performed by means of a Nd:YAG laser (Quanta Ray GCR 130,  repetition rate,
  maximum energy,
  pulse duration). As the second harmonic wavelength
  was used, then the fundamental wavelength
  was filtered out by a beam dump and vice versa (see figure 2). A system of mirrors that were highly reflective for both laser wavelengths enabled the vertical beam alignment. Thereafter, a cylindrical lens (focal length of
  ) focused the laser beam only vertically in order to pass the discharge gap width of
  just behind the focus. In the center of the discharge volume, the elliptical cross-sectional area of the laser beam was defined by the vertical half-axis of about
  and the horizontal half-axis of about
  . Finally, the slight divergence of the laser beam enabled the photodesorption of surface electrons at a small angle of incidence.
Moreover, the laser pulse energy ( ) was detected by a power meter (COHERENT, FieldMaxII) located behind the vacuum chamber. The maximum pulse energy inside the discharge volume was about
  and
and  , respectively. Furthermore, the laser pulse was shifted along the phase of the feeding voltage by means of a pulse delay generator (SMV PDG 204). The experiment was triggered by the laser pulse train at
  . Each time, up to four consecutive discharge cycles at the operating frequency of
  were recorded in order to analyze the laser-induced change in discharge characteristics and its relaxation behavior.
3. Numerical fluid simulation
3.1. Simulation of the discharge
A detailed description of the one-dimensional fluid simulation regarding the balance equations, boundary conditions, numerics, and parameter variations is given in [22]. However, this time, the simulation considered small (synthetic) air impurities, defined by the density ratio ![$[{{\rm{N}}}_{2}]/[{{\rm{O}}}_{2}]=4/1$](https://content.cld.iop.org/journals/0963-0252/26/7/075006/revision1/psstaa758bieqn44.gif) , instead of small admixtures of oxygen to helium. A minimum set of relevant species and reactions, summarized in table 1, was used which enabled the simulation to represent the main discharge characteristics from the experiment.
, instead of small admixtures of oxygen to helium. A minimum set of relevant species and reactions, summarized in table 1, was used which enabled the simulation to represent the main discharge characteristics from the experiment.
Table 1.
Elementary processes considered in the simulation. The corresponding rate coefficients have units of  for two-body reactions and
  for three-body reactions.
  is the mean electron temperature and
  denotes the gas temperature.
| Reaction | Rate coefficient | References |
|---|---|---|
| Electron-impact excitation | ||

|

|
[27] |
|

|
[27] |
|

|
[27] |
| Radiation relaxation | ||

|
 (immediately) (immediately) |
|

|
 (immediately) (immediately) |
|
| Electron-impact ionization | ||
|

|
[27] |
|

|
[27] |
|

|
[27] |
| Ion–electron recombination | ||

|
|
[28] |

|
|
[28] |
 a
a
|

|
[31] |

|
|
[5] |
| Penning ionization | ||
|

|
[28] |
|

|
[28] |
|

|
[31] |

|

|
[31] |
| Charge transfer | ||
|

|
[28] |
|
|
[31] |
| Charge conversion | ||
|
|
[31] |
|
|
[5] |
|

|
[28] |
|

|
[28] |
|
|
[5] |
|

|
[5] |
| Neutrals conversion | ||

|

|
[31] |

|

|
[5] |
| Wall reaction | ||
|
1.000 | |

|
1.000 | |
|
1.000 | |

|
1.000 | |

|
1.000 |
The ground-state neutral species He, N2, and O2 act as the background gas, and the charged species are electrons and the positive ions He+, He2+,  ,
,  ,
,  , and
, and  . Negative ion formation was ignored in the present simulation since the concentration of oxygen impurities is only around
  , and the previous simulation of the discharge in helium with
  oxygen admixture revealed no remarkable influence of negative ions and related processes on the discharge development [22]. Metastable atoms He
 and dimers He
 are included as well as further resonantly excited He states serving as immediate sources of UV and VIS photons. Note that the VIS radiation relaxation is only simulated for comparison with the measured optical emission from the experiment. The rate coefficients for excitation and ionization by electron impact were calculated using BOLSIG+ and the cross sections taken from lxcat.net and the Lisbon database [27, 29, 30], and for heavy particle collisions from [5, 28, 31]. Note that the stated rate coefficient for recombination of
  ions with electrons is the sum over several dissociative and non-dissociative reaction channels, given in [31]. Electrons reaching the dielectric surface are fully absorbed, ions become neutralized, and He metastable states become de-excited. Here, SEE is considered for incident ions (
 ), metastable states (
 ), and UV photons (
 ). Moreover, thermal desorption of surface electrons is included in the simulation, as proposed in [17].
The electron transport parameters were obtained as a function of the reduced electric field strength E/n using BOLSIG+. As motivated in [17], the axial electric field distribution  was calculated analytically from the electric displacement field
  , which allows a fast determination of the electric field in 1D compared to the numerical solution of the Poisson's equation. Therefore, Gauss's law

was integrated stepwise for the dielectrics and the gas gap. Here,  is the charge density distribution inside the gas gap, and
  and
and  are the surface charge densities on both dielectrics. Two boundary conditions must be considered. Firstly, the total charge is conserved,

Secondly, the unspecified integration constant resulting from the stepwise integration of Gauss's law (4) was determined by the equivalence of the axially integrated electric field and the applied voltage

Here, d and g are the widths of the dielectrics and the gas gap, respectively. Finally, the analytical formula for the spatio-temporal electric field distribution inside the gas gap ( ) reads
with
Moreover, the balance equation for the density  of species k at position z and time t,

was solved numerically using the Euler method in combination with different dynamic time steps for fast and slow collision processes, allowing a maximum change in the species densities of  from one to another time step. This limit is a compromise between the computing time, the calculation accuracy and the stability of the simulation. However, using
  or
or  does not result in significant changes in the discharge characteristics. In equation (9),
  is the total rate of production and loss by collisions, and
  denotes the total flux of the species density
  , including the diffusion flux for neutral particles

and, additionally, the drift flux for charged particles

where  denotes the diffusion coefficient and
  is the mobility of the charged particles. Regarding the numerical discretization, a centered scheme was used for the diffusion flux, whereas the drift flux was handled by an upwind scheme. More details regarding the numerics can be found in [22].
3.2. Adaption to the experiment
The next step was the adaption of the simulation to the experiment, since the actual effect caused by laser photodesorption of surface electrons is very sensitive to the initial discharge characteristics. Therefore, the density of air impurities  , the gas temperature
  , the SEE coefficients
  and
and  , and the electron flux
  caused by thermal desorption were varied. Their respective influence on the discharge was separately discussed in [22]. Several parameter sets result in a satisfying agreement with the discharge characteristics from the experiment, and reproduce the laser photodesorption effect as well. However, for the further discussion we chose one parameter set.
Figure 3 presents the discharge characteristics from experiment compared to the adapted simulation. A good agreement is achieved for  air impurities,
  ,
,  , and
, and  . In (a), the applied voltage
  , gap voltage
  , and discharge current
  from experiment (gray lines) and simulation (colored lines) are plotted. In (b)–(d), the measured spatio-temporal development of the He(
 ) emission at
  , the simulated excitation rate of the radiative He(3
 ) state, and the reduced electric field strength are depicted. The discharge current pulse, the gap voltage drop, the cathode-directed ionization front, and the absence of a positive column are well-reproduced by the simulation. Note that the simulated gap voltage drop lasts longer. Probably, the electron–ion recombination during the afterglow might be too slow to describe the experiment with consideration of the used set of reactions in table 1, as also pointed out in [32]. But, the investigated laser photodesorption effect influences primarily the well-reproduced discharge pre-phase and the breakdown. Moreover, in (e) and (f), the spatially averaged particle-density profiles and the contribution of ions, helium metastable states, UV photons, and thermal desorption to the total SEE flux are plotted, respectively. During the early discharge pre-phase, the thermal desorption of surface electrons from the cathodic dielectric clearly dominates and provides the required pre-ionization. But, during the late pre-phase as well as during the breakdown, the SEE by ions and UV photons determines the total SEE flux.

Figure 3. Measured and simulated characteristics of the glow-like BD in helium: (a) gap voltage  and discharge current
  during the negative half-cycle of the sine-wave feeding voltage (
 ), comparing experiment (gray lines) and simulation (colored lines). (b)–(d) Spatio-temporal evolution of measured He(
 ) emission at
  , simulated excitation rate for the resonantly excited He(3
 ) state, and reduced electric field strength. (e) Spatially averaged particle-density profiles. (f) Contribution of ions and metastable species, UV photons, and thermal desorption (TD) to the total flux of secondary electron emission from the cathodic dielectric.
Download figure:
Standard image High-resolution imageNote that the simulation does not account for radiation trapping, which means that the excitation of the He( ) state results in UV photons by radiation relaxation to the ground state, but it does not consider de-excitation to metastable states. As a consequence, the simulation might over-predict the SEE by UV photons. However, since the SEE by ions is in the same order of magnitude, the effect of missing radiation trapping remains small. This can be compensated by a reasonable increase of the SEE coefficient for ions from 0.2 to 0.25 when the excitation of He(
 ) ends in the metastable state, only. In a current work under identical discharge conditions [33], it was estimated by Townsend's criterion for the breakdown voltage that effective SEE coefficients may lie between 0.04 and 0.4 depending on the (charged) dielectric material. Also, the rates for electron-impact excitation of He(
 ) and He(
 ) are clearly larger than for He(
 ) at low electric fields, wherefore the metastable densities are not remarkably influenced by radiation trapping.
3.3. Simulation of laser photodesorption
Modeling the complex interaction between the laser photons and the charged dielectric surface is beyond the scope of this work, since the number density of incoming laser photons is not well-defined, and the photodesorption probabilities as well as the binding energy of electrons adsorbed to an impure dielectric are not well-known. Instead, laser photodesorption of surface electrons was implemented in the simulation by removing a defined surface electron density  . During the laser pulse duration of
  at the firing time
  , that is varied with respect to the phase of the feeding voltage, the time-dependence of the released surface electron density is calculated by a Gaussian distribution,
Actually, the temporal shape of the laser pulse is not crucial since the pulse duration  is short compared to the
  time scale of the discharge development. But, this is the most realistic shape and its smoothness stabilizes the numerics. The released surface electrons are put into the first grid cell next to the dielectric and, then, they can either diffuse back and become adsorbed again or they drift towards the discharge volume and multiply by ionization processes. Note that this boundary condition is the same as for secondary electrons and electrons from the discharge volume [34]. Finally,
  was varied to adapt the simulated effect to the laser photodesorption effect from experiment. In this way,
  may represent the charge density of surface electrons released by the laser.
4. Laser photodesorption of surface electrons
4.1. Effect on electrical discharge characteristics
Starting with the experimental results, figure 4 shows the change in electrical discharge characteristics caused by laser photodesorption of surface electrons. Here, the sine-wave feeding voltage  , the gap voltage
  , the discharge current
  , and the surface charge density
  on the laser-exposed dielectric are plotted for three consecutive discharge cycles, both with laser pulse (colored lines) and, for reference, without laser pulse (gray lines). The laser beam hits the negatively charged cathodic dielectric during the discharge pre-phase. The laser wavelength
  is used at the maximum pulse energy
  . According to the literature [19, 24], the corresponding photon energy
  is high enough to release weakly-bound surface electrons from the glass-coated electrodes.

Figure 4. Laser photodesorption effect for one discharge breakdown per half-cycle: temporal behavior of applied voltage  and gap voltage
  (top), discharge current
  (center), and surface charge density
  (bottom) for the discharge without laser pulse (gray lines) and with laser pulse (colored) marked by an arrow at the time
  . The laser beam hits the cathodic dielectric that is charged with residual surface electrons at this time. The quantities
  ,
,  and
and  define the difference in breakdown voltage, the time shift between the peak values of the currents and the difference in deposited charge density, respectively, comparing the laser-affected and unaffected discharge. Applied voltage amplitude
  . Laser:
  ,
,  .
.
Download figure:
Standard image High-resolution imageAt first, no additional laser-induced current pulse or corresponding change in surface charge density  is observed. Hence, it follows that the amount of electrons
  released by laser photons is below the detection limit, which allows at least the rough estimation of an upper limit for
  : taking into account the measuring capacitance of
  , typical signal amplitudes of a few volts, and the
  vertical resolution of the oscilloscope, the resolution limit is in the order of tens of
  . Although no immediate effect occurs coinciding with the laser pulse, the laser-influenced discharge ignites at a clearly lower gap voltage (
 ) and thus earlier (
 ) than the discharge without laser pulse. That means the released electrons significantly support the pre-ionization. Moreover, the lower breakdown voltage causes a smaller amount of transported charge and deposited charge density (
 ). Because of the surface charge memory effect, the discharge breakdown during the following half-cycle starts later. Thereafter, the laser-affected discharge characteristics reconstitute within the two following voltage periods, since the discharge development is controlled by the unchanged operating conditions such as the feeding gas and the applied voltage. Hence, the influence of long-term effects due to laser-heating of the dielectric surface can be excluded.
Increasing the feeding voltage amplitude from  to
to  causes two discharge breakdowns per half-cycle. Under these conditions, the laser photodesorption effect is shown in figure 5. Both the electrical measurements and the spatio-temporal evolution of the optical emission revealed that the first discharge breakdown operates in the glow mode and the second one in the Townsend mode. The first glow-like discharge breakdown is directly influenced by laser photodesorption of surface electrons during its pre-phase at
  . The characteristic changes in the electrical discharge quantities are the same as already discussed for one breakdown per half-cycle in figure 4. However, this time the discharge is not disturbed for some voltage periods. Instead, the initial discharge characteristics are reconstituted already after the second breakdown within the same half-cycle. Due to the less deposited surface charge after the first laser-affected breakdown, the ignition voltage for the second breakdown is reached earlier in comparison to the discharge behavior without laser pulse. Once the ignition voltage for the second discharge breakdown has been reached it keeps constant as long as the sine-wave feeding voltage is rising. This is typical for the Townsend discharge mechanism which explains the full compensation of the laser-induced disturbance.

Figure 5. Laser photodesorption effect for two discharge breakdowns per half-cycle: the depiction is the same as already explained in figure 4. Applied voltage amplitude  . Laser:
  ,
,  ,
,  .
.
Download figure:
Standard image High-resolution image4.2. Influence on reaction kinetics in the volume
In figure 6, the simulated discharge characteristics are plotted without laser (gray lines) and with artificial release of  surface electron density (colored lines), which matches the best with the laser photodesorption effect from experiment in figure 4. Above, the gap voltage
  and the discharge current
  are plotted. In good agreement with the experiment, the simulation reveals a lower ignition voltage, corresponding earlier breakdown onset, and less transported charge when additional electrons are released from the cathodic dielectric during the pre-phase. Below, the dynamics of the spatially averaged densities of electrons, positive ions (in total), and He metastable states are shown. Even this comparatively small amount of additionally released surface electrons significantly supports the pre-ionization, because the initial volume electron density is very low during the early pre-phase. At first, the volume electron density rises immediately by two orders of magnitude due to laser photodesorption of surface electrons

The desorption energy hv must exceed the binding energy of electrons deposited on the dielectric surface. In general, this energy can be provided by photons, excited species, or thermal processes. Subsequently, the density of He metastable states is enhanced by one order of magnitude via fast electron-impact excitation

followed by slower Penning ionization of air impurities

Thereby, the increase in the densities of  and
and  is delayed, and the volume electron density keeps high after the first short-lived laser-induced peak. Finally, the additional positive ions move to the cathodic dielectric and enhance the yield of secondary electrons

The disturbance in the species densities with respect to the ordinary development without laser interaction (gray lines) lasts for some tens of microseconds, which is mainly due to the effective lifetime of the metastable states. Summarized, the laser-enhanced pre-ionization does not reconstitute until the breakdown onset, wherefore the discharge characteristics finally change. Inversely, especially because of the lower gap voltage during the discharge current pulse, the densities of electrons, He metastable states and ions are slightly reduced during the laser-affected discharge breakdown in comparison to the unaffected discharge. As a result, the overall amount of transported charge is less for the laser-disturbed discharge.

Figure 6. Simulated laser photodesorption effect adapted to the experiment in figure 4: (a) gap voltage  and discharge current
  without laser pulse (gray lines) and with artificial release of
  surface electron density (colored). (b) Dynamics of the spatially averaged densities of electrons, positive ions (in total), and He metastable states.
Download figure:
Standard image High-resolution imageThe favoring of pre-ionization due to the presence of few additional electrons was also discussed in studies concerning the laser-induced branching and guiding of streamers in air [35, 36], and laser photodetachment of negative ions in diffuse helium–oxygen BDs [37]. These investigations and the present work have in common that no laser-induced current is detected due to the marginal number of additional electrons. But, these electrons are sufficient to enhance the ionization rate which, later on, results in notable effects on the discharge breakdown. From this point of view, these results underline the significance of a small amount of seed electrons for the required pre-ionization to form diffuse BDs. Especially, for the standard operation of diffuse BDs driven by low operating frequency, these seed electrons might be provided by thermal desorption of surface electrons, as assumed in [14, 17, 22].
4.3. Parameter variations
In figure 7, the laser photodesorption effect, quantified by the earlier ignition onset  and the difference in surface charge density
  , is depicted in dependence of the axial laser beam position. The laser is fired during the discharge pre-phase with maximum pulse energy
  resulting in the largest effect on the discharge. The discharge characteristics change only if the laser beam hits the cathodic dielectric that is charged with residual surface electrons. There is no effect at all if the laser beam passes the gas gap or hits the positively charged anodic dielectric. Thus, the laser photon energy is insufficient to create additional charge carriers in the volume. As well, there is no significant contribution of laser photodetachment of negative ions to the observed effect on the discharge, since the oxygen concentration in the order of
  is too low in the present experiment. Note that a measurable effect by laser photdetachment of negative ions in the volume was reported for at least
  oxygen admixture to helium under otherwise similar discharge conditions [37]. When the laser hits the anodic dielectric, no weakly-bound surface electrons are present, and the photon energy is too low to release electrons from the valence band. However, even if electrons would be removed from the anodic dielectric, they will be retarded by the electric field. Since the vertical extent of the laser beam is approximately
  inside the discharge gap, the effect occurs already for a distance of about
  to the cathodic dielectric. As the laser beam comes closer to the cathodic dielectric,
  and
and  increase monotonously but not linearly. The reason is that the axial distribution of the laser radiation intensity differs from a homogenous profile. Therefore, the variation of the axial laser beam position changes both the effective illumination area as well as the density of incoming laser photons.

Figure 7. Laser-induced time shift  of the breakdown onset and difference in surface charge density
  depending on the axial position of the laser beam inside the discharge gap. The laser is fired during the discharge pre-phase resulting in the maximized effect. Applied voltage amplitude
  . Laser:
  ,
,  .
.
Download figure:
Standard image High-resolution imageSince  and
and  are correlated and both quantify the same laser-induced effect, only
  is considered in the following discussion. Figure 8 depicts the laser photodesorption effect when shifting the laser pulse in time steps of
  over a full discharge cycle. The periodic changes in surface charge polarity and electric field direction across the gas gap are illustrated in (a). Below in (b), the feeding voltage
  , the gap voltage
  , and the discharge current
  are plotted for the discharge without laser interaction. The highlighted times t1 to t4 mark the zero-crossings of the gap voltage and the breakdown onsets, respectively. In (c), the laser-induced time shift
  of the breakdown onset is shown in dependence of the moment of the laser pulse. The laser photodesorption effect is significant only if the laser pulse was set between t1 and t2, which marks the pre-phase of the discharge in the negative half-cycle. It starts with the zero-crossing of the gap voltage and it ends just after the onset of the discharge breakdown. Hence, the laser photodesorption effect occurs only when the laser hits the cathodic dielectric charged with residual surface electrons. In this case, the released electrons are able to pass the discharge gap on their way to the anode and, thereby, they enhance the pre-ionization. Although the upper dielectric is already charged with surface electrons before t1, at this time the gap voltage polarity prohibits the movement of the laser-released electrons through the gas gap. Nonetheless, one should note that a very small effect is observed before t1 too, indicating low ionization by the released electrons in front of the upper dielectric. Vice versa, during the pre-phase of the positive half-cycle between t3 and t4, the gap voltage polarity would allow a laser-induced effect, but no surface electrons are bound to the anodic dielectric at this time.

Figure 8. Laser photodesorption effect depending on the laser pulse in time with respect to the sine-wave operation: (a) the laser hits the upper dielectric. The surface charge polarity changes during each discharge breakdown, and the direction of the electric field across the discharge gap is determined by the gap voltage polarity. (b) Applied voltage  , gap voltage
  and discharge current
  for the discharge without laser pulse. (c) Laser-induced time shift
  of the breakdown onset. The highlighted times t1, t2, t3 and t4 mark the zero-crossings of the gap voltage and the breakdown onsets without laser pulse, respectively. Applied voltage amplitude
  , Laser:
  ,
,  .
.
Download figure:
Standard image High-resolution imageIn figure 9, the laser photodesorption effect, quantified by the time shift  of the breakdown onset, is shown in dependence of the laser pulse energy
  (experiment) and the released surface electron density
  (simulation). In (a) and (b),
  is plotted as a function of the moment of the laser pulse during the discharge pre-phase for different values of
  and
and  , respectively. In (c), the quantity
  , that is averaged over the respective temporal profile in (a), is plotted as a function of
  . In (d), the simulated quantity
  for the laser pulse at
  is plotted as a function of
  in double-logarithmic scale. The higher the laser pulse energy, the higher is the density of incoming photons and the larger is the amount of released electrons. Therefore, the laser photodesorption effect rises both with increasing
  and
and  . The profiles in (a) agree qualitatively and quantitatively well with those in (b). However, the maximum in
  occurs at different laser pulse times comparing experiment and simulation. Moreover, in (c) the slope of
  increases with increasing
  , whereas in (d) the slope of
  decreases with increasing
  . Most likely this discrepancy is associated with a change in the cross-sectional area and the axial intensity distribution of the laser beam by variation of
  . It should be mentioned as well, that not all of the initially released electrons drift towards the anode and participate in ionization processes. The reason is the partial re-trapping of released surface electrons after subsequent back-diffusion to the dielectric.

Figure 9. Laser photodesorption effect in dependence of the laser pulse energy  (experiment) and the released surface electron density
  (simulation): time shift
  of the breakdown onset as a function of the moment of laser pulse during the discharge pre-phase for different values of (a)
  and (b)
  . Temporally averaged time shift
  as a function of
  (c), and
  as a function of
  at
at  (d).
(d).
Download figure:
Standard image High-resolution image5. Laser-induced discharge mode transition
5.1. Influence of laser photon energy
Since the laser photodesorption of surface electrons corresponds to an artificial increase in the SEE which enhances the pre-ionization, the BD mode might finally change. This was tested first for the laser wavelength  which corresponds to the photon energy
  . Figure 10 illustrates the laser photodesorption effect on the development of the glow-like BD, regarding the electrical characteristics in (a), and the spatio-temporal evolution of the He(
 ) emission at
  with laser pulse and without laser pulse in (b). As already discussed, the laser-induced effect is characterized by discrepancies in the ignition voltage, breakdown onset, and transported charge. The He line emission in figure 10(b) acts as an indicator for both high electron density and energy, since the resonantly excited He(3
 ) state is dominantly populated by electron-impact excitation from the He ground state requiring high excitation energy of
  ,
,


Both with and without laser pulse, the ionization front starts in front of the anode and propagates towards the cathode, as typical for the glow-like BD. However, the ionization front of the laser-affected discharge starts noticeably earlier and propagates slower compared to the unaffected development. This is due to the laser-induced decrease in breakdown voltage. But, the gap voltage drop during the laser-affected breakdown is still large, and the maximum emission is just slightly shifted towards the anode. Summarized, the discharge mode is not changed by laser photodesorption of surface electrons at  . This is confirmed by the simulated electrical characteristics and total ionization rate in figures 10(c) and (d). Releasing a surface electron density of
  from the cathodic dielectric enhances the pre-ionization of the discharge in agreement with the experiment. As well, the reduced breakdown voltage causes a slower cathode-directed propagation of the ionization front and a decrease in total ionization rate during the breakdown phase. In contrast to the experiment, the simulation reveals a small additional current peak of sub-microsecond duration at the moment of the laser pulse. Since the amount of laser-released electrons is still below the detection limit of the measured total charge
  , such small current peak could not be identified in the recalculated discharge current
  in the experiment.

Figure 10. Laser photodesorption effect on the discharge development comparing experiment with laser photon energy of  and adapted simulation with released surface electron density of
  : gap voltage
  and discharge current
  for the discharge with laser pulse (colored lines) in comparison to the unaffected discharge (gray lines), for (a) experiment and (c) simulation. Spatio-temporal development of (b) He line emission at
  and (d) total ionization rate, without laser pulse (top) and with laser pulse (bottom), respectively. The laser beam hits the negatively charged cathodic dielectric. Applied voltage amplitude
  . Laser:
  .
.
Download figure:
Standard image High-resolution imageIncreasing the laser wavelength from  to
to  corresponds to a decrease in photon energy from
  to
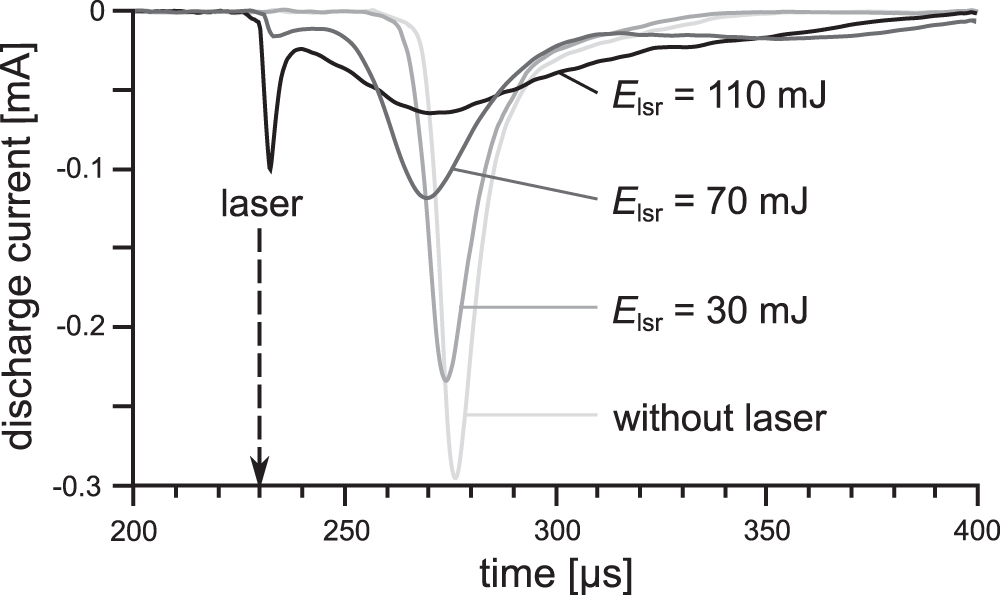
to  . In figure 11, the unaffected discharge current is compared with the discharge current disturbed by laser photodesorption of surface electrons during the pre-phase for different laser pulse energies at the photon energy
  . Again, the laser-induced effect on the discharge, characterized by the earlier breakdown onset and less transported charge, increases with increasing laser pulse energy. But, in contrast to the laser photodesorption effect at
  , an additional current peak just after the laser pulse is observed using the photon energy
  at the pulse energies
  and
and  . The additional current peak indicates a large amount of released surface electrons. Note that
  equals the maximum available pulse energy at
  used in figure 10. Hence,
  is more efficient in releasing surface electrons than
  .
.

Figure 11. Discharge current affected by laser photodesorption of surface electrons for different laser pulse energies  at the photon energy
  compared to the unaffected discharge current. Applied voltage amplitude
  .
.
Download figure:
Standard image High-resolution imageFor  at the maximum available pulse energy
  , figure 12 shows the laser photodesorption effect on the discharge development comparing the experiment with the adapted simulation. The depiction is the same as already introduced in figure 10. Unlike the laser photodesorption effect at
  , the discharge breakdown affected by the laser at
  starts at the moment of the laser pulse, and is characterized by an almost constant gap voltage during the weak discharge current pulse of about
  duration. It is most notable that the maximum of the optical emission originating from the laser-affected discharge is clearly shifted towards the anode, compare figure 12(b) top and bottom. In conclusion, the additional current peak and the transition from the glow mode to a kind of Townsend mode, favored by effective SEE, indicate a large amount of released surface electrons. Indeed, the released surface electron density must be increased significantly to
  in order to adapt the simulation to the experiment at
  . Note that this electron yield exceeds the total electron density deposited onto the dielectric surface. However, with consideration of the finite laser pulse duration and the effective re-trapping of released electrons, this is no contradiction. In agreement with the laser-affected discharge from experiment in figures 12(a) and (b), the gap voltage remains nearly constant and the discharge current is weak and long-lasting. As well, the total ionization rate is clearly enhanced during the pre-phase but reduced during the breakdown, and its maximum is shifted away from the cathode, see figures 12(c) and (d). Also, the additional current peak at the moment of the laser pulse is observed due the large amount of released surface electrons.

Figure 12. Laser photodesorption effect on the discharge development comparing experiment with laser photon energy of  and adapted simulation with released surface electron density of
  . The depiction is the same as already introduced in figure 10. Applied voltage amplitude
  . Laser:
  .
.
Download figure:
Standard image High-resolution image5.2. Stepwise release of surface electrons
In figure 13, the discharge current is plotted without and with laser photodesorption of surface electrons at  and
and  . The additional current peak caused by the released electrons just after the laser pulse at
  is characterized by a raise to its maximum within few microseconds followed by a slightly slower decrease. This delay with respect to the moment of the laser pulse (
 duration) as well as the overall duration of this current peak take much too long compared to the transit time of electrons drifting through the
  discharge gap when the breakdown voltage has been reached. Thus, the delay between the laser pulse and the current peak indicates the stepwise release of surface electrons initiated by the low laser photon energy.

Figure 13. Discharge current without laser pulse and with laser photodesorption of surface electrons at the photon energies  and
and  , and calculated additional current peak just after the laser pulse assuming stepwise surface electron release at
  according to equation (22), with
  ,
,  ,
,  .
.
Download figure:
Standard image High-resolution imageIn fact, a reasonable microscopic description of an impure dielectric surface is beyond the scope of this work. However, one possible sequence for the stepwise electron release is shown in figure 14, which is a sketch of the interface between the discharge and the dielectric surface, based on the model in [16]. The bending of both the valence band and the CB is caused by the charging with surplus electrons. Most of the dielectric materials that are commonly used in BD configurations, such as silica or alumina, have positive electron affinity  [15]. The latter is defined as the energy difference between the lower edge of the CB and the effective surface potential wall just outside the dielectric boundary resulting from the superposition of the image potential and the plasma sheath potential. In this context, free electrons (
 ) are defined as those electrons having enough energy to overcome the effective potential wall. In particular, the model in [16] predicts the trapping of electrons from the discharge within the CB, with subsequent relaxation to deeper energy levels. From experimental investigations of the thermally and optically stimulated luminescence [19, 20], it is known that the residual surface electrons have low material-dependent binding energy in the order of
  . Thus, the electrons are finally trapped in additional band gap states (
 ) originating from chemical contamination, doping, or structural damage caused by the discharge exposure.

Figure 14. Sketch of the interface between the discharge and a dielectric wall having positive electron affinity  , in accordance with the model in [16]. Residual surface electrons are trapped within additional band gap states of the (impure) dielectric. The laser photon energy
  is sufficient to release these electrons directly. In contrast, using
  , the following sequence is proposed to explain the experiment by stepwise surface electron release: the electrons get first excited to the CB by laser, then, transferred to a second intermediate state (
 ) within the surface potential (SP) valley, and, finally, released (
 ) by incident ions, photons, or thermal desorption. Further details are given in the text.
Download figure:
Standard image High-resolution image
In the present experiment using float glass plates covering the electrodes, it is therefore assumed that the laser photon energy  allows the direct release of surface electrons from the population
  . In contrast, the shape of the additional current peak using the low photon energy
  can be explained by fast laser-excitation of surface electrons to the CB (
 ), followed by the slower transfer to the shallow surface potential valley (
 ), and, finally, the excited electrons might be released by incident ions, photons, or thermal desorption. Of course, multiple energy levels and de-excitation must be considered for an accurate description. But, this is neglected here since the idea is just to demonstrate whether stepwise surface electron release may explain the experiment. Since the laser pulse is short compared to the slow processes depleting the CB, the laser-excited electron population
  is immediately build up. Hence, the rate equation system according to the excitation sequence proposed in figure 14 reads


Following this one-directional sequence, the time-dependent population  just decays exponentially according to the rate
  , starting from the initial laser-excited amount
  . Finally, inserting the solution for the inhomogeneous rate equation (20) into equation (21) yields the time-dependent current of released surface electrons

For  ,
,  , and
, and  , the current calculated from equation (22) is plotted as a dashed line in figure 13. In general, the calculated current reproduces the shape of the measured current peak induced by laser photodesorption at low photon energy
  , which supports the assumption of stepwise electron release. In conclusion, at least two intermediate states for the surface electrons, here
  and
and  , are necessary to explain (i) the delay between the laser excitation and the current pulse maximum, as well as (ii) the slow decrease afterwards. However, this simple 0D analytical calculation cannot perfectly match with the experiment due to spatial inhomogeneities in laser radiation intensity, and due to the lack of knowledge about the underlying microscopic processes at the interface between the discharge volume and the dielectric surface.
Note that  corresponds to
  released surface electrons. With consideration of the laser pulse energy
  at the photon energy
  used in the experiment, the total number of photons per laser pulse is about
  . Thus, the laser photodesorption efficiency defined as the ratio of released surface electrons to laser photons results in about 10−8, which seems to be very small. However, first of all, only the edge of the laser beam hits the dielectric surface, and the photon density is not constant across the axial laser beam profile but decreases significantly towards the edges. Secondly, the laser beam is only slightly divergent and, hence, nearly parallel to the dielectric surface, wherefore most of the photons become reflected there. Thirdly, due to the low photon energy, the laser can finally release only those surface electrons having a low binding energy.
6. Summary and outlook
The presented work studies the role of residual weakly-bound surface electrons for the pre-ionization in homogeneous glow-like helium BDs. A laser photodesorption experiment was performed and, in addition, a 1D numerical fluid simulation was set up to investigate the impact of released surface electrons on the discharge development. Both experiment and simulation revealed that releasing a small amount of surface electrons from the cathodic dielectric during the discharge pre-phase supports significantly the pre-ionization kinetics. As a result, the breakdown voltage is noticeably reduced which corresponds to an earlier discharge onset, the cathode-directed ionization front is slowed down, and the overall transported charge is less compared to the discharge without laser interaction. This result highlights the importance of weakly-bound surface electrons in acting as a seed electron reservoir for diffuse BDs driven by low operating frequency, as so far proposed in some simulations of the BD in helium and helium–oxygen mixtures.
In more detail, the axial laser beam position, the laser pulse time and energy, and the laser wavelength (photon energy) were systematically varied. Actually, the experiment verified that the surface electrons are weakly bound to the glass-coated electrodes, wherefore they can be released by laser at low photon energy of  . The comparison between experiment and simulation indicates that the laser photodesorption of surface electrons significantly supports the ionization kinetics at low background electron density in the gas volume. Only the released electrons from the cathodic dielectric are able to pass through the gas gap and participate in ionization processes. Both criteria are fulfilled during the discharge pre-phase, but neither during the breakdown nor during the post-phase.
Finally, the reduction of the laser photon energy from  to
to  causes an additional current peak just after the laser pulse, and the transition from the glow mode to the Townsend mode of the BD due to an effective increase in the secondary electron yield. The additional current peak caused by the large amount of released surface electrons reveals a remarkable delay to the short laser pulse. This can be explained by stepwise electron release initiated by laser excitation to a higher energy level within the dielectric. This approach is supported by analytical calculations based on a simple excitation sequence at the interface between the discharge and the dielectric surface.
To summarize, the investigations demonstrate the possibility to manipulate BDs by the laser interaction with charged dielectric-covered electrodes. Here, the binding energy of surface electrons was found to lie between  and
and  for the used float glass plate. Thus, the release of surface electrons by optical photons or thermal processes may essentially contribute to the pre-ionization of homogeneous BDs. The presented laser photodesorption effect is suitable to measure the binding energy of electrons deposited onto a dielectric surface, and to draw conclusions on effective SEE processes. For this purpose, it is planned to use tunable photon energies, and to investigate more well-defined dielectric materials, such as mono-crystalline silica, alumina, and magnesia. This intention should be combined with the direct measurement of surface electrons, e.g., based on the electro-optic Pockels effect of a Bi12SiO20 crystal. Indeed, the effective SEE depends on the amount of surplus electrons adsorbed to the dielectric surface.
Acknowledgments
The presented work was supported by the Deutsche Forschungsgemeinschaft through the Project No. B11 of the Collaborative Research Center Transregio 24 (TRR 24), 'Fundamentals of Complex Plasmas'.