

Abstract
Corona discharge in high voltage power transmission lines can generate audible noise and radio inference, causing environmental problems in daily life. There are three different discharge modes of negative corona depending on DC voltage amplitude, namely, Trichel pulses, stable glow and negative streamers. A 2D fluid model, incorporating three species (electrons, positive oxygen ions and negative oxygen ions), was successfully built to simulate the formation of repetitive Trichel pulses in air. However, this simplified model cannot correctly predict the transition to pulseless glow. The calculated transition voltage is higher than experimental results. In this work the gas dynamics and a detachment reaction are taken into account in the model. Gas heating due to the deposited discharge energy will influence the chemical reaction rates and reduce the gas density. Besides the mobility of charged particles, the ionization and attachment coefficients are determined by the reduced electric field. The calculation results of the gas density from the gas dynamics model are coupled back to the discharge model. The corona discharge in a needle-cylinder electrode configuration is simulated and the results show that the mode transitions at a lower voltage, which agrees well with the experimental data. The ionization rate is greatly enhanced around the needle because of the gas density reduction. Therefore, the reduced electric field will not easily be decreased by the generation and accumulation of negative ions. A higher detachment rate also causes the Trichel pulses to disappear. The simulation results suggest that gas heating is more important for the mode transition of negative coronas from Trichel pulses to pulseless glow than was previously expected.
Export citation and abstract BibTeX RIS
1. Introduction
Corona discharges occur if the electric field is non-uniform and the maximum electric field exceeds a threshold field Ec at the high voltage electrode [1]. Corona discharges are self-sustained and are often seen initiating from power transmission lines. They have adverse effects on power grid operation and our daily lives [2]. Firstly, corona discharges lead to energy consumption, resulting in unnecessary power losses. A series of chemical reactions is also triggered and harmful species such as ozone and nitric oxide will be created, which may damage insulation material. In addition, a variety of high harmonics in the corona current can cause radio interference and audible noise, which can have psychological and physical effects on humans. Therefore, corona discharges have aroused widespread concern regarding the design of ultra-high voltage DC (UHVDC) systems. However, corona discharges are very important in many industrial applications, such as electrostatic precipitators, ozone production, the semiconductor industry, exhaust gas treatment, surface modification and boundary layer flow control [3–8].
Trichel [9] conducted an experimental study of a point-plane negative corona discharge in 1938. He first obtained oscillograms of the negative corona current and found that the current is composed of regular pulses, whose magnitude and frequency depend on the average current, point size and gas pressure. In 1968, Giao and Jordan [10] summarized the different modes of corona discharges in air. With increasing applied voltage, negative corona discharges undergo several stages: Trichel pulses, pulseless glow and negative streamers. The morphology of the first two modes are diffuse glow and the last one is filamentary. Since then, there have been many studies on the characteristics of negative corona discharges.
Trichel proposed that the formation of negative charges accumulated around the point electrode and the subsequent removal of them resulted in repetitive current pulses. For many years Trichel pulses were thought to only occur in electronegative gases. The relationship between the frequency and amplitude of these pulses and the voltage, electrode shape, pressure and humidity were studied [11–14]. In 2001, Akishev et al proved that the pulsed mode of a negative corona can also be observed in pure nitrogen [15]. Zhang et al [16] presented experimental results of Trichel pulses in argon. They argued that positive ions play a predominant role in the formation of pulses. The pulsing process corresponds to the temporal glow breakdown in non-electronegative gases. More experiments were conducted to explain the mechanism of the transition from Trichel pulses to pulseless glow. Giao and Jordan [17] believed that increasing the voltage enhances the removal rate of negative ions in low fields and reduces the production rate of negative ions, due to the detachment effect in high fields. So, the electric field in the vicinity of the cathode cannot be easily limited by negative ions. Kurimoto and Farish [18] used Schlieren and interferometric techniques to study the gas density distribution for negative coronas in a point-plane gap. It was found that the gas temperature in the glow region was about 500–900 K. The local heating may affect the Trichel pulse–glow transition by increasing the ionization and detachment processes near the cathode. Akishev et al [19] showed that the glow discharge can be stabilized by preventing the ionization instability. Using an external gas flow, changing the shape of the anode and changing the material of the anode are some possible methods.
Since the 1960s, researchers have been developing numerical models to study the mechanism of negative corona discharges. Morrow [20] studied the corona discharges in oxygen with a 1D model and first proposed a quantitative theory for Trichel pulses in 1985. The flux corrected transport method (FCT) was used to solve the continuity equations of electrons, positive ions and negative ions. It was demonstrated that electron attachment plays a crucial role in the current pulse formation. Only the first current pulse was simulated and reproduced within the 213 ns of the discharge. A different quasi-1D model was built by Napartovich et al [21] simulating a point-plane geometry. This model gave a quantitative description of repetitive pulse formation and showed a reasonable agreement with the pulse shape. Chen and Davidson [3] proposed a 1D model in the glow regime of negative DC coronas in a wire-cylinder configuration. Their results showed that the electron number was increased by 80% when the gas temperature was raised from 300 K to 800 K. Akishev et al [22] built a self-consistent 2D axisymmetric model without assuming the radius of the cylindrical discharge channel. They gave a detailed description of the steady-state Trichel pulses and predicted the distributions of three charged species in the air gap. In 2011, Sattari [23] solved the 2D model of negative DC corona discharges using a combination of FCT and the finite element method (FEM). The effect of external resistance of the circuit, secondary electron emission and the mobility of positive and negative ions on the characteristics of Trichel pulses was investigated. FCT-FEM was further improved to handle complex geometries and unstructured meshes [24, 25]. A 2D axisymmetric negative corona model was successfully implemented in COMSOL Multiphysics by Tran et al [26]. The different stages of Trichel pulse formation were explained in a 3.3 mm needle-plane geometry. Since then, more researchers have studied the influences of different parameters (airflow, humidity, etc) on the negative DC corona discharge using COMSOL [23, 27, 28]. The transition from the Trichel pulse mode to glow mode was also studied. Dordizadeh et al believed that the strong electric field throughout the whole gap is the key factor controlling the transition [29]. They predicted that the transition voltage is −12 kV for a needle-plane configuration with a 6 mm spacing and a 35 μm tip. However, they stressed that the realization of glow discharges at this voltage level in reality is impossible because of the gap breakdown. Later, they investigated the effect of the detachment reaction on the discharge mode transition and found that it causes the pulsating mode to disappear [30].
The experimental and simulation results indicate that the Trichel pulse–glow transition occurs when the electric field around the cathode is strong enough to keep the negative ion space charge at a sufficient distance from the cathode. Furthermore, the reduced gas density due to gas heating and the detachment reaction seem to play a role in this process. However, it is not clear whether they are both crucial for the transition of Trichel pulses to pulseless glow. The main purpose of this paper is to understand the transition of Trichel pulses to pulseless glow. A three-species (electron, positive ions and negative ion) 2D fluid model of discharges is employed to give a quantitative analysis. Gas heating and detachment, which are usually ignored in the simulation of negative coronas, are taken into consideration. The continuity equation of charged particles together with gas dynamics equations are solved in COMSOL Multiphysics.
First we give a description of the negative corona model in section 2. The simulation results of current, electric field and charged species density are presented in section 3, including a comparison of the calculated voltages at which the mode transition occurs with experimental results. In section 4, the effect of discharge parameters such as the detachment rate and the relaxation time of the vibration–translation collision are discussed. Conclusions are given in section 5.
2. Model description
We study how a negative corona discharge evolves when gas heating and thermal expansion are considered. A 2D axisymmetric fluid plasma model has been coupled to a compressible Navier–Stokes description of the gas dynamics. In our previous works, a self-consistent ionic wind model was built, which also described the coupling between plasmas and gas dynamics [31, 32]. However, only the unidirectional influence of corona discharges on gas flows was considered. Besides, the vibrational–translational energy transition is not included in the power heating equation. In this section, we describe the physical basis of the two models and the coupling between them.
2.1. Model for the corona discharge
A widely-used three-species hydrodynamic corona model is employed in which the dynamics of electrons, positive ions and negative ions are taken into consideration. The number densities of the charged species are calculated by solving the following set of continuity equations (1)–(3) coupled with a Poisson equation (4).

where ne, np and nn are the electron, positive ion and negative ion number densities; μe, μp, μn, and De, Dp and Dn the mobility and diffusion coefficients for electrons, positive ions and negative ions respectively; α the Townsend ionization coefficient, η the attachment coefficient, kdt the detachment coefficient, and kep and knp the recombination coefficients of positive ions with electrons and negative ions, respectively. The detachment only accounts for the electrons from  ions and the coefficient was summarized in [33]. The charged particle mobility, ionization and attachment coefficients are supposed to depend on the local reduced field
  and these values are taken from Morrow's corona model [34]. Here N is the gas number density, which is related to the mass density ρg as ρg = mgN, where mg is the average mass of the air molecules. The electric field
  is calculated according to
  where ϕ is the electric potential; ε is the permittivity of air and e the electron charge.
The discharge current including the contributions of all charged species is proposed by Sato [35] and given by equation (5):
where r and z are cylindrical coordinates, Ua the applied voltage,  the Laplacian electric field and D the 2D axisymmetric domain.
2.2. Model for the gas dynamics
The gas dynamics is influenced by the discharge through momentum and energy transfer. The compressible Navier–Stokes equations (6)–(8), including the conservation of mass, momentum and energy for neutral gas, are employed to describe the coupling between discharge and gas dynamics.


Here, ρg is the gas density,  the flow velocity,
 ![$\tau \,={\mu }_{v}\left[{\rm{\nabla }}\vec{u}+{({\rm{\nabla }}\vec{u})}^{{\rm{T}}}-2/3({\rm{\nabla }}\cdot \vec{u}){\bf{I}}\right]$](https://content.cld.iop.org/journals/0963-0252/28/5/055017/revision2/psstaae554ieqn7.gif) the stress tensor, μv the air dynamic viscosity, p the static pressure, I the unit tensor, T the gas temperature, κ the thermal conductivity of air, and
the stress tensor, μv the air dynamic viscosity, p the static pressure, I the unit tensor, T the gas temperature, κ the thermal conductivity of air, and  is the total energy per unit volume, where γ = 1.4 is the ratio of specific heat for air.
The source term  in the momentum equation (7) is the electrohydrodynamic (EHD) force [36], which is responsible for the momentum transfer from charged particles to neutral molecules and is written as:

The source term Pheat in the energy equation (8) is the heating source of the gas. The energy released through collisions between ions and neutral species is assumed to be instantaneously transferred into gas heating. The thermal energy transferred from electrons to neutral molecules can be divided into several parts. Firstly, the energy transferred though elastic collisions and rotational excitation is immediately deposited into gas heating. Secondly, a fraction of the electron energy is expended on the excitation of the electronic degrees of freedom of N2 molecules and instantaneously converted into gas heating [37]. Thirdly, the relaxation of vibrational energy stored in N2 molecules occurs on a longer time scale. A relaxation time τvt is used for the process of vibration–translation (V–T) collisions. So the electrical power density deposited by the discharge is
where je, jp and jn are the current densities of electrons, positive ions and negative ions, ηel-r, ηex and ηv are the fractional power deposited in elastic and rotational excitation of air molecules, electronic excitation and vibrational excitation of N2 molecules respectively. The dependence of the three fractions on  is calculated using BOLSIG+ for discharges in air [38]. It is assumed that ξex = 30% of the power expended on the electronic excitation is directly transferred to gas heating [39]. A phenomenological equation (11) of the V–T energy transfer is used in this paper [40]. The power density Pvt is first stored in vibrational states of the molecules and then released as heat with a relaxation time τvt = 20 μs [41]. The quantity τvt depends on the vibrational temperature [42, 43], but we treat it as a parameter and will later discuss it in section 4.1.
The above equations are closed with the equation (12) of state of perfect gases:

The discharge model and the gas dynamic model are two-way coupled. The former model provides the EHD force and the heating power to the latter. In turn the changes in the gas density by gas heating have an impact on the transport coefficients of charged species, the ionization and attachment rates. In addition, the induced gas flow may modify the velocity of charged particles. However, the flow velocity is several meters per second and is much lower than the typical drift velocities of ion and electron, thereby hardly affecting the discharge dynamics in contrast to the gas heating.
2.3. Simulation geometry and initial/boundary conditions
In order to compare with experimental results, the negative corona model is investigated in a similar 2D axisymmetric geometry [31]. Figure 1 shows the schematic diagram of the needle-cylinder electrode arrangement. The needle has a hyperbolic tip with a radius of curvature of about 220 μm, and is placed 20 mm away from and collinearly to the cylinder electrode symmetry axis. The grounded electrode is a cylinder with an inner diameter of 34 mm and a height of 30 mm.

Figure 1. The simulation geometry of negative corona discharges.
Download figure:
Standard image High-resolution imageThe initial electrons and positive ion are uniformly distributed in the simulation domain and their number densities are equal to 1010 m−3. The density of negative ions is assumed to be zero. The initial gas velocity is 0 m s−1, the initial pressure 1 bar and the initial temperature 293 K. The boundary conditions for the discharge model and the flow model can be found in [31, 32]. Secondary emitted electrons from the needle surface are required in the model to sustain the discharge. The secondary electron emission coefficient γse is set to 0.001, as we suggested in [31]. The boundary conditions for the heat transfer equation (8) are set as follows: we assume that the temperature on the needle electrode has a homogeneous Neumann boundary condition and that it is equal to the ambient temperature (293 K) on other boundaries.
The fully coupled corona discharge model is implemented in the commercial FEM-based package COMSOL Multiphysics. The discharge equations (1)–(4) are solved by the 'transport of diluted species' and 'electrostatics' modules, the gas dynamics equations (6)–(8) are solved by the 'Laminar Flow' and 'Heat Transfer in Fluids' modules, and the V–T transfer equation (11) is solved by the ordinary differential equation (ODE) module. The time step size is automatically determined with a maximum step of 10−8 s. In order to accelerate the calculation, the mesh is refined near the tip and is left coarser in the remaining region. A non-uniform triangular mesh was used with a maximum element size of 1.0 μm near the needle tip, which increases to 1 mm in the area far from the needle. In total around 80 000 triangular elements are used.
3. Simulation results
In order to investigate the transition mechanism of discharge modes, we now present simulations of the negative corona in air with models considering different physics. The first model is the basic negative corona discharge model (NCD-B) which solves equations (1)–(4) but does not consider the detachment rate. This model was typically used by many researchers in the past to show the formation of Trichel pulses. The free electrons created by detachment from negative ions are included in the second model (NCD-DT). In the third negative corona model (NCD-GH) the effect of gas heating is considered while the detachment is not, and this model solves equations (1)–(12) of discharge dynamics coupled with the gas dynamics. The NCD-DT and NCD-GH models are employed to show the influence of the detachment and gas heating on the transition from Trichel pulses to pulseless glow.
Experimental results show that the transition voltage in this setup is around −13 kV for the needle-cylinder geometry [31]. Stepped negative voltage pulses Ua with absolute values between 12–16 kV are applied to the needle to show the characteristics of different discharge modes. The voltage is increased from zero to the given value with a constant rise rate of 1 kV μs−1 and is kept constant when the intended voltage is reached. All simulations are run on a desktop PC (Intel Core i7-7700, 16GB RAM). The total simulation duration of the three models varies between 80 and 200 μs to reach a steady state of the current. The simulations take about 60–180 h to complete. We will compare simulation results of the current, electric field and net number density of charged species in the three models.
3.1. Comparison of current waveforms
Firstly, we show the current waveforms calculated by the NCD-B model at voltages of −12 kV, −14 kV and −16 kV in figure 2. During the rising edge of the voltage, a large current pulse is seen for all voltages. This is because of rapid ionization and electron motion during the first several microseconds after the DC voltage is suddenly applied. The amplitude of the first current pulse is usually very high and reaches many hundreds of micro-amperes. After the first current pulse, the current gradually decreases. Since many electrons are generated and move away from the tip, they will be attached to oxygen molecules and negative ions drift away in the low fields region. At −12 kV the regular current pulses start to oscillate from t = 22 μs, indicating that the Trichel pulse mode of negative corona has started. The oscillating behavior appears later at −14 kV than at −12 kV. This implies that more negative charges are produced at −14 kV, and more time is required to clear the charges to recover the electric field near the cathode. The pulse repetition frequency at −14 kV is higher frequency than at −12 kV. When the voltage is increased to −16 kV, the current pulses do not appear until t = 88 μs, which is not shown in figure 2. The corona mode does not change to the pulseless glow stage in the voltage range of −12 to −16 kV. Though we have not tested higher voltages to see the transition threshold voltage, the simulation results by NCD-B indicates that it does not describe the transition process of negative corona modes accurately.

Figure 2. Simulated current pulses of the basic negative corona discharge model NCD-B. The applied voltages are −12 kV, −14 kV and −16 kV.
Download figure:
Standard image High-resolution imageFigure 3 shows the current waveforms calculated by NCD-DT when the voltages are −12 kV and −14 kV. Similar to the calculated current by NCD-B, the current consists of a regular train of pulses at voltages of −12 kV and −14 kV. At −14 kV, the current pulses require more time to reach a steady state than in the NCD-B model results. The calculation results show that the mode transition does not occur at lower voltages when electron detachment is considered. These findings are not consistent with the results by Dordizadeh et al [30], who report that the pulsating mode disappears when detachment of electrons from O− ions by collisions with unexcited N2 is considered. The set of the coefficients of detachment reaction were taken from Soloviev et al [44]. However, this detachment practically does not occur when the gas temperature is not too high [33]. A different set of reactions is used in our model, where the detachment of electrons from  ions are considered. Moreover, the detachment rate coefficient from O− ions is much higher than that from
  ions. This will probably lead to more electrons and the formation of a glow. We will further discuss how the discharge mode changes for varying detachment rate in section 4.2.
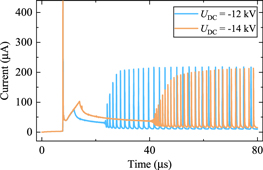
Figure 3. Simulated current pulses of the negative corona discharge model NCD-DT considering detachment reactions. The applied voltages are −10 kV and −12 kV.
Download figure:
Standard image High-resolution imageThe simulated current by NCD-GH with voltages of −12 kV and −14 kV is shown in figure 4. The current at −12 kV shows pulsating behavior while at −14 kV the discharge becomes steady after the first large current pulse. This indicates that the transition from Trichel pulses to the pulseless glow occurs between −12 kV and −14 kV. This transition voltage is in good agreement with the experimental value [31]. The current pulses appear later at t = 156 μs, and the amplitudes of the pulses are tens of micro-amperes, lower than those by NCD-B and NCD-DT.
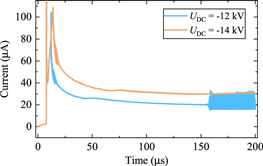
Figure 4. Simulated current pulses of the negative corona discharge model NCD-GH considering gas heating. The applied voltages are −12 kV and −14 kV.
Download figure:
Standard image High-resolution imageIn figure 5 the mean currents of the Trichel pulses are compared for the three models and the experimental data. The mean currents at −12 kV and −14 kV during the last current pulse are about 20 μA and 30 μA respectively, which is larger than the measured values of 15 μA and 24 μA. In spite of different corona modes at −14 kV, the differences in mean current calculated by the three models are small. This suggests that the ions in the drift region are the main contribution to the total current, while the ionization region, which is affected most by gas heating, is responsible for the corona modes. This will be clearly illustrated in the next section when the reduced electric fields are compared.
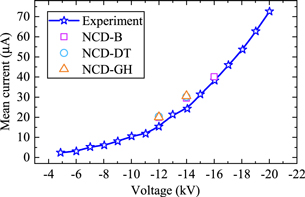
Figure 5. Comparison of the current–voltage characteristics of negative glow corona measured in [31] and simulated with different models.
Download figure:
Standard image High-resolution image3.2. Comparison of electric field and net number density of charged species
The 2D distributions of the electric field and net number density of charged species calculated by NCD-B were studied thoroughly in the Trichel pulse regime [29, 31]. It can be seen from the previous section that NCD-B and NCD-DT give similar current waveforms. This suggests that the distributions of the electric field and charged species are also quite similar for these two models. Figure 6 shows the time evolution of these distributions to illustrate the Trichel pulse formation. During a Trichel pulse, the steep rise of the current pulse is mainly due to rapid motion of positive ions in the high field near the needle tip, which looks like an ionization wave propagating towards the cathode. As the positive ions are neutralized by the cathode, the electric field adjacent to the cathode is strongly distorted by leftover space charges. A large amount of electrons at a further distance from the cathode is attached to molecules and negative ions are formed. This could reduce the field near the cathode and quench the ionization activity. As the negative ions drift away, the current decreases gradually to a low value due to the low mobility of ions. The maximum charged species density is not located on the symmetry axis. It means that a ring-like corona region is formed near the tip, which has also been reported in other simulations of Trichel pulses [45]. Moreover, a ring shape of the negative corona discharge was observed from a point electrode [46, 47]. The authors believed that it is due to the field distortion caused by negative space charges in the gap.
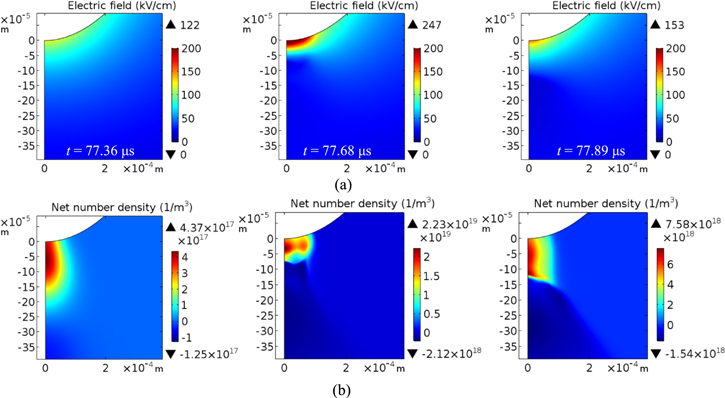
Figure 6. 2D distributions of electric field (top) and net charged species density np–ne–nn (bottom) with the voltage of −12 kV by NCD-DT.
Download figure:
Standard image High-resolution imageFigure 7 presents results of the time evolution of the electric field and charged species density calculated by NCD-GH. The basic process of Trichel pulse formation from the NCD-GH model is similar to that from the NCD-DT model. There are still a few differences compared to figure 6 with respect to the Trichel pulse regime in figure 7(a). The positive ions are seen to move towards the needle more clearly in figure 6, while the negative ion clouds move away faster in figure 7. The maximum number density of charged species for NCD-GH is higher than that for NCD-DT. Figure 7(b) depicts the distributions of the electric field and charged species density of the glow mode at U = −14 kV. The distributions are stationary and no rapid motion of positive ions is seen as in figure 7(a).
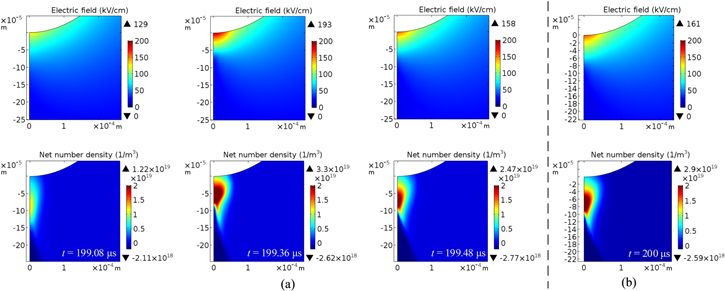
Figure 7. 2D distributions of electric field (top) and net charged species density (bottom) with applied voltages of (a) −12 kV and (b) −14 kV by NCD-GH.
Download figure:
Standard image High-resolution imageFigure 8 compares the distributions of gas density and gas temperature at the end of the simulation. The power density deposited in the cathode sheath region is quite large and leads to the gas heating. The maximum gas temperature in this region at U = −14 kV is 655 K, compared to 543 K at U = −12 kV. The calculated maximum temperatures are higher than the experimental results of 400–450 K [32], which were obtained from the spectroscopic measurements of the N2 C–B transition. The difference is mainly because the temperature is measured at the region below the needle tip and is spatially averaged. Accordingly, the gas density at U = −14 kV is lower than at U = −12 kV. This will further enhance the reduced electric field near the tip and thus affect the ionization and attachment coefficients.

Figure 8. 2D distributions of gas density (top) and gas temperature (bottom) with applied voltages of (a) −12 kV and (b) −14 kV at t = 200 μs by NCD-GH.
Download figure:
Standard image High-resolution imageFigure 9 shows the 1D distribution of the reduced field and ionization and attachment rates along the symmetry axis for NCD-B and NCD-GH model at U = −14 kV. The gas heating primarily influences these parameters in the region z < 100 μm. The reduced electric field calculated by NCD-GH near the needle can reach a maximum value of 1200 Td, which is triple that of NCD-B, while in the area far from the needle the reduced fields do not differ much. The electric fields do not have to be strong enough through the whole gap to reach a high net ionization rate, as discussed in [30], since the decreased gas density leads to higher reaction rates. In the ionization region at z = 100 μm, the ionization rate by NCD-GH is nearly two orders of magnitude greater than that by NCD-B, and so is the attachment rate.
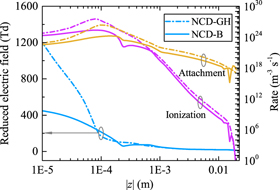
Figure 9. Comparison of reduced electric field, ionization and attachment rates on the symmetry axis by NCD-GH and NCD-B at t = 80 μs. The applied voltage is −14 kV.
Download figure:
Standard image High-resolution imageIt can be concluded from the above analysis that gas heating has effects on the negative mode transition. If gas heating was not taken into consideration, a higher voltage would be required to enhance the electric field in the whole gap and thus realizing the Trichel pulse—pulseless glow transition, as is discussed in [29]. The high electric field not only increases the rate of removal of negative ions into the low field gap, but also reduces the formation rate of negative ions. However, according to the results by NCD-B, this threshold voltage is so high that the discharge may quickly turn into the spark regime. That is why the removal of heat dissipated in the discharge is crucial to form glow mode in a short air gap at higher voltages [48]. The experiment results show that the negative corona can switch to a pulseless glow at a relative low voltage. This phenomenon can be simulated by NCD-GH. The gas heating decreases the gas density and thereby increases the reduced electric field. Therefore, the ionization and attachment rates are increased, which has a similar effect to raising the voltage. The difference is that only the cathode sheath region in the vicinity of the needle is affected instead of the entire discharge area. On the other hand, the detachment is not that important for the transition in our simulation, which is inconsistent with the findings by Dordizadeh et al [30]. The main reason is that the detachment rate is 3–4 orders of degree lower in our work. A higher detachment rate leads to suppression of negative ion density. Hence, the electric field will not be decreased to the same degree as the lower detachment rate. Besides, the extra secondary electrons in the vicinity of the tip will accelerate the ionization reaction and keep the charged particles in an equilibrium state. It can be concluded that the gas heating effect plays a greater role in the transition process than the detachment rate.
4. Discussion
4.1. Effect of the energy relaxation time through V–T collisions
A phenomenological gas heating model is used in this paper. The energy relaxation time τvt is used to describe how fast the energy stored in the vibrational states can be transferred to the translational state. Hence, the gas temperature might be affected and so does the reduced electric field. The period of the Trichel pulses is several microseconds, which is lower than the τvt of 20 μs in the NCD-GH model. Here we investigate its effect by varying τvt from 2 μs to 200 μs. For τvt = 200 μs only a small fraction of the vibrational energy is transferred to translational energy, since τvt is now comparable to the total simulation time. Figure 10 shows the distributions of the reduced electric field and gas temperature on the symmetry axis for different values of τvt. The reduced electric fields are hardly affected by the value of τvt and they all decrease from about 950 Td to 10 Td for increasing distance to the tip. The reduced field is slightly higher near the needle tip for a lower τvt. The gas temperature distributions show similar trends and decrease from 540 K to the ambient temperature 293 K. The result shows that a smaller τvt leads to faster V–T energy transfer, whereas it enhances the reduced electric field only slightly.
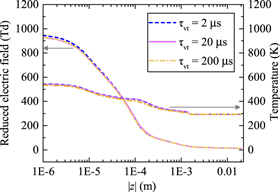
Figure 10. 1D distributions of the reduced electric field and gas temperature on the symmetry axis (r = 0 m) at t = 200 μs for different energy relaxation time τvt through V–T collisions as calculated by the NCD-GH model. The applied voltage is −12 kV.
Download figure:
Standard image High-resolution imageNext, figure 11 shows the time evolution of the discharge current for different values of τvt. For τvt = 200 μs the current goes into the Trichel pulse stage earlier than for τvt = 2 μs and 20 μs. This is because the energy is deposited on a shorter time scale and therefore the ionization activity is stronger, and a larger current pulse appears for smaller τvt, as can be seen in figure 11(a). It requires a longer time for negative ions to move from the tip. After the first large current pulse, the stable current pulses in figure 11(b) for different τvt are very similar. This can be explained by the similar reduced electric field and gas temperature in the vicinity of the tip. The simulation results demonstrate that τvt affects the time of Trichel–pulseless glow transition, but not the characteristics of the Trichel pulses.

Figure 11. Time evolution of the discharge current for different τvt.
Download figure:
Standard image High-resolution image4.2. Effect of the detachment rate
In section 3, it was shown that the addition of the detachment reaction in the NCD-DT model does not affect the transition of negative corona modes. So, we increase the detachment rate in order to better investigate its effect. Figure 12 shows the current waveforms calculated for different detachment rates of kdt, 102 kdt and 104 kdt. At −14 kV, the current calculated with 102 kdt is close to that of the original kdt. When the detachment rate is increased to 104 times its original value, the current pulse disappears and the corona modes has changed into the pulseless glow mode. It should also be noted that there are small oscillations in the current waveform, which is not as smooth as that in figure 4. The calculation results illustrate that the higher detachment reaction increases the free electron density and thus reduces the negative ion density. The electrons can move away from the tip faster, so the electric field will not decrease to choke the ionization activity. However, the detachment rate used here has an unreasonably high value, while in the real case the effect of the detachment reaction on the negative corona modes transition cannot be compared to the gas heating.

Figure 12. Time evolution of the discharge current calculated by NCD-DT model for different detachment rates: the original kdt, 102 kdt and 104 kdt. The applied voltage is −14 kV.
Download figure:
Standard image High-resolution image
5. Conclusion
We have developed a negative corona model in Comsol to study the transition of Trichel pulses to pulseless glow by a needle-cylinder DC discharge. The model solves fluid discharge equations coupled with the compressible form of the Navier–Stokes equations. The effect of the gas heating and the detachment reaction have been investigated to clarify which factor leads to the negative corona mode transition.
The results calculated by the corona fluid model show that the applied voltage, i.e. the electric field should be high enough to quickly remove negative ions from the cathode. However, this transition voltage is much higher than the experimental value. Next, a more reasonable set of detachment reactions was included in the model. It is shown that the detachment does not have much influence on the pulsating mode. A higher detachment rate causes the Trichel pulses to disappear. When the deposited energy in the gas is considered, the results show that the transition occurs at a relatively low voltage, which agrees well with the experimental data. The increased temperature in the cathode sheath region decreases the gas density and thereby enhances the reduced electric field. This reduced field is kept at a high value, resulting in more active ionization in this narrow region. In the presence of the gas heating, the charged species reach stationary distributions near the needle tip. The simulation results illustrate that gas heating plays a more important role in the transition from Trichel pulses to pulseless corona than was previously assumed.
Acknowledgments
This work was supported by National Natural Science Foundation of China (51607061, 51325703 and 51377094), Fundamental Research Funds for the Central Universities (531107040929) and STW project 13651.