
Abstract
Detailed knowledge of correlations between direct current (DC) cathodic arc deposition process parameters, plasma properties, and the microstructure of deposited coatings are essential for a comprehensive understanding of the DC cathodic arc deposition process. In this study we have probed the plasma, generated by DC arc on a Ti-50 at.% Al cathode in a N2 ambience, at the growth front of the TiAlN coating. Several consequences of an increasing N2 pressure are observed, including a decreased electron temperature, an increased electron density, and a loss of energetic ions. As a result, the preferred growth texture switches from 220 to 111. It is also observed that neutrals in the plasma can significantly contribute to the growth of TiAlN coatings.
Export citation and abstract BibTeX RIS

Original content from this work may be used under the terms of the Creative Commons Attribution 4.0 licence. Any further distribution of this work must maintain attribution to the author(s) and the title of the work, journal citation and DOI.
1. Introduction
The generation of plasma is inherent to the direct current (DC) cathodic arc deposition process, and in order to comprehend the fundamental mechanisms that govern the cathodic arc deposition process, insights into the correlations between plasma generation, its transport and the consequent microstructure of the coating are necessary. Sputtering processes have been extensively studied and a copious amount of literature on the correlations between plasma generation, the dynamics involved in the plasma transport and the subsequent microstructure developed in the thin films is readily available. For example, Engström et al [1] have shown how the magnetic field of an electromagnetic coil placed behind the substrate stage changes the plasma properties at the thin film growth front in magnetron sputtering (MS), which ultimately alters the microstructure of the thin film. Greczynski et al [2] have shown how, in a hybrid high-power impulse magnetron sputtering (HIPIMS)/DC MS setup for the deposition of TiAlN thin films, the plasma properties change depending on whether the Ti or Al cathode is placed in an HIPIMS source. This change in plasma properties alters the microstructure of the TiAlN thin films.
The DC cathodic arc deposition process has metal ions of multiple charge states that can attain high velocities, corresponding to kinetic energies of up to a few hundred eV. Due to the transient nature of the cathode spots, high frequency plasma fluctuations are inherent to the DC arc deposition process [3], which makes it difficult to perform relevant plasma diagnostics to study plasma generation and transport mechanisms in the DC cathodic arc process. Therefore, most of the published studies are focused on finding the links between the process parameters (i.e. DC arc current [4], applied bias [4–6], applied magnetic field [7], N2 pressure [8], cathode grain size [9], and cathode microstructure [10]) and the microstructure of the coatings. However, studies determining the relationships between process parameters, plasma properties, and the microstructure of deposited coatings remain an uncharted domain for the DC cathodic arc deposition process.
Here, we show how variations in N2 pressure during arcing of a Ti-50 at.% Al cathode alter the plasma properties (i.e. electron density, effective electron temperature, plasma potential, average ion energies, ion composition, average charge states of ions and the ion current densities) in the proximity of the growth front of the coatings, and how these alterations in plasma properties dictate the microstructure of the coatings. The choice of using TiAlN coatings as a test material is based on their industrial relevance which is attributed to a combination of unique properties, such as age hardening [11] and high-temperature oxidation-resistance [12].
2. Experimental details
The coating depositions and plasma diagnostics were performed in a lab scale chamber (diameter: 660 mm, length: 750 mm) equipped with a DC arc source that housed a powder metallurgically manufactured Ti-50 at.% Al (average grain size–50 μm) circular cathode of 100 mm diameter and operated with a DC arc current of 120 A. The arc was guided on the cathode surface by a weak magnetic field of 0.4 mT. The base pressure of the chamber was 5 × 10⁻⁴ Pa. The distance between the cathode surface and the substrates or the plasma probes was kept constant at 700 mm (see figure 1). Plasma characterizations and coating depositions were performed at multiple N2 gas pressures (see table 1).
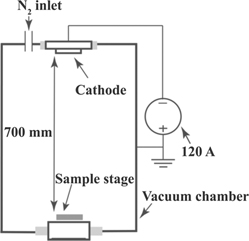
Figure 1. Deposition chamber schematics (not to scale).
Download figure:
Standard image High-resolution imageTable 1. Plasma characterization and depositions performed as a function of N2 pressure.
| N2 pressure | MEA | Langmuir probe | Flat probe | Coating deposition |
|---|---|---|---|---|
| 0 Pa | x | x | x | x |
| 0.07 Pa | x | x | x | x |
| 0.2 Pa | x | x | x | x |
| 0.3 Pa | x | x | x | |
| 0.4 Pa | x | x | x | x |
| 0.5 Pa | x | |||
| 0.6 Pa | x | x | x | x |
| 0.8 Pa | x | x | x | |
| 1 Pa | x | x | x | x |
Polished Si (001) wafers (1 mm thick) were used as substrates for the coating depositions. The substrates were cleaned by sonification in an alcohol solution prior to being inserted in the deposition chamber. During deposition, the backsides of the substrates were heated by a SiC-filament so that a constant substrate temperature of 150 °C was achieved. All coatings were deposited at floating potential and for a constant deposition time of 20 min.
To measure ion energy distribution functions (IEDFs) of the plasma species, the substrate stage was replaced by a Hiden EQP 1000 mass energy analyzer (MEA). Its grounded entrance aperture with a 30 μm orifice was placed at the same position as the substrates. Scans were recorded in the range of 0–200 eV/charge with a step size of 0.5 eV/charge. The recorded species were identified and their respective energy per charge scans were treated following the process described by Zhirkov et al [13]. To reduce the amount of noise, each scan was recorded at least three times and an averaged IEDF was then calculated.
The Langmuir probe used consisted of a straight tungsten wire of 0.2 mm thickness threaded through three concentric ceramic tubes in such a way that an 8 mm-long tip was exposed to the plasma. Controlled by a computer program, a voltage range of −20 V to +30 V swept across the tip for a few seconds to record the I–V characteristic curves. The plasma potential (Vp), the effective electron temperature (Teff), electron density (ne), and electron energy distribution function (EEDF) were extracted from the recorded I–V characteristic curves [14–16]. The Langmuir probe was placed on the sample stage and the vertical axis of the stage was adjusted to ensure a distance of 700 mm between the Langmuir probe and the cathode surface was achieved.
Ion saturation current densities were measured by a 6 mm-diameter flat probe (see figure 2). To minimize the edge effects, the flat probe was surrounded by a 20 mm-diameter guard ring. The gap between the edge of the flat probe and the inner circumference of the guard ring was 0.2 mm. A sweeping potential was simultaneously applied on the flat probe and the guard ring, while the saturation current was only measured through the flat probe. The flat probe was placed on the sample stage and a distance of 700 mm between the cathode surface and flat probe surface was achieved by adjusting the vertical axis of the stage.
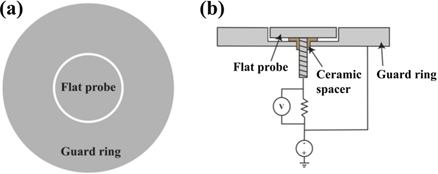
Figure 2. Flat probe (a) plan view and (b) crossectional view.
Download figure:
Standard image High-resolution imageSurface morphologies and cross-sections of the coatings were observed by using an LEO 1550 scanning electron microscope workbench operated at an acceleration voltage of 5 kV and a working distance of 5 mm. Phase analysis of the coatings was performed by the PANalytical X'Pert Pro diffractometer operated in the Bragg–Brentano configuration using Cu–Kα radiation. Stress measurements were performed with the PANalytical Empyrean XRD diffractometer and employing the d vs sin2 Ψ method [17]. The elastic constants used for stress determination were a Poisson's ratio of 0.22 and an elastic modulus of 432 GPa [18]. Compositional analysis of selected coatings was performed by the time-of-flight energy elastic recoil detection analysis (ToF-E-ERDA). The parameters used for ToF-E-ERDA were a beam of 36 MeV 127I8+ ion, an incident angle of 67.5° from surface normal of the sample, and a recoil angle of 45°. The obtained spectra were analyzed by the CONTES code [19].
3. Results
3.1. Ion energy distribution functions
The IEDFs of Ti, Al, TiN, N and N2 are shown in figure 3 and they contain multiple peaks. These peaks merge into a single broad peak when the N2 pressure is increased. At 0 Pa (N2), Ti1+ is the dominant fraction among all the Ti ions in the plasma. As the N2 pressure increases, Ti2+ becomes the dominant Ti ion fraction. Al1+ is the major fraction of Al ions irrespective of the N2 pressure. We find that the maximum velocities of Ti and Al are similar, which is consistent with the velocity rule [20].

Figure 3. IEDFs of Ti1+, Al1+, Ti2+, Al2+, Ti3+, Al3+, N2 1+, TiN1+, and N1+ at different N2 pressures.
Download figure:
Standard image High-resolution imageThe average ion energies, extracted from the respective IEDFs of Ti, Al and N are shown in figure 4(a). The average energies of Ti, Al and N ions follow a decreasing trend when the N2 pressure increases, which indicates a similar trend that has been reported previously [21, 22]. The average ion energy of Ti is higher than that of Al at all the N2 pressures studied. This higher average ion energy of Ti compared to Al is in line with previous observations for a Ti-50 at.% Al cathode [20]. The average charge states of Ti and Al ions are shown in figure 4(b). The average charge state of Al is close to 1+ for all the investigated pressures, whereas the average charge state of Ti is close to 1+ for 0 Pa of N2 and remains above 1.7+ for all the other N2 pressures.
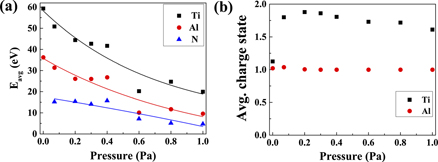
Figure 4. (a) Average ion energies (Eavg) of Ti, Al and N, curve fitted lines highlighting the trends and (b) average charge state of Ti and Al.
Download figure:
Standard image High-resolution imageThe following relation is used to calculate the ion saturation density for each species at different N2 pressures:
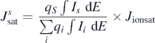
where  is the ion saturation density of species S, qS
the charge state of species S, IS
the intensity (measured by MEA) of species S, and Jionsat the total ion saturation density (measured by flat probe). The measured individual ion saturation densities of the plasma species are plotted according to their fraction of the total ion saturation density as a histogram in figure 5. The total ion saturation current density shows a sharp decrease from 0 Pa to 0.07 Pa, while a further increase in the N2 pressure results in a more gradual decrease. The N, N2, and TiN ions contribute marginally to the total ion saturation current density, which instead is dominated by the metal ions. Ti ions contribute the most to the total ion saturation current density irrespective of the N2 pressure. At 0 Pa the ratio Ti-ions/Al-ions is approximately 60/40 and for the rest of the N2 pressure range the ratio is closer to 70/30. The major fraction of Ti ions is Ti1+ at 0 Pa, while it is Ti2+ when N2 is present in the chamber. Figure 5 also shows that N1+ starts to appear as Al2+ decreases, and when Al2+ vanishes at 0.2 Pa, an immediate increase in N1+ occurs. With further increase in N2 pressure, N1+ starts to decrease and ultimately disappears at 1 Pa.
is the ion saturation density of species S, qS
the charge state of species S, IS
the intensity (measured by MEA) of species S, and Jionsat the total ion saturation density (measured by flat probe). The measured individual ion saturation densities of the plasma species are plotted according to their fraction of the total ion saturation density as a histogram in figure 5. The total ion saturation current density shows a sharp decrease from 0 Pa to 0.07 Pa, while a further increase in the N2 pressure results in a more gradual decrease. The N, N2, and TiN ions contribute marginally to the total ion saturation current density, which instead is dominated by the metal ions. Ti ions contribute the most to the total ion saturation current density irrespective of the N2 pressure. At 0 Pa the ratio Ti-ions/Al-ions is approximately 60/40 and for the rest of the N2 pressure range the ratio is closer to 70/30. The major fraction of Ti ions is Ti1+ at 0 Pa, while it is Ti2+ when N2 is present in the chamber. Figure 5 also shows that N1+ starts to appear as Al2+ decreases, and when Al2+ vanishes at 0.2 Pa, an immediate increase in N1+ occurs. With further increase in N2 pressure, N1+ starts to decrease and ultimately disappears at 1 Pa.

Figure 5. Total ion saturation current density (Jionsat) as a function of N2 pressure. The histogram shows the fraction of ion saturation densities of individual species contributing to Jionsat.
Download figure:
Standard image High-resolution image3.2. Electron energy distribution functions
The non-Maxwellian distribution of the IEDFs (see figure 3) suggests that the conventional Maxwellian assumptions to determine electron temperature and electron density from the Langmuir probe measurements are not valid. The Druyvesteyn method of Langmuir probe analysis, which assumes non-Maxwellian electron energy distribution, is used here to calculate EEDF from the second derivative of Langmuir probe I–V characteristic curve using the formula [14]:
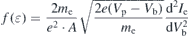
where f(ɛ) is the EEDF, A the probe area, e the charge of electron, me the mass of electron, Vp the plasma potential, Vb the bias on the probe, and Ie the electron current. Digital smoothing of the I–V curves was performed by applying the Blackman window (B.W) filter [23]. The measured and B.W filtered I–V curves recorded at 0.6 Pa N2 are shown in figure 6.
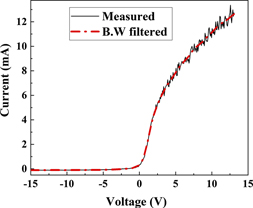
Figure 6. Langmuir probe I–V characteristic curve measured at 0.6 Pa N2; solid line is the measured curve; dotted line is the curve obtained after B.W filtering.
Download figure:
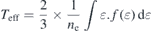
Standard image High-resolution imageFor illustrative purposes, the EEDF is usually represented in the form of the electron energy probability function (EEPF) (see figure 7), computed by dividing EEDF with the square root of electron energy ( ). At 0 Pa the EEPF appears to have a bimodal distribution which changes to a unimodal distribution at higher N2 pressures. The energetic tails of the EEPFs diminish with an increase in N2 pressure, while the population of low energy electrons increases, indicating increased collisions among plasma species that lead to their thermalization.
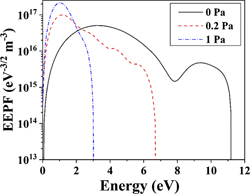
Figure 7. EEPFs at N2 pressures of 0 Pa, 0.2 Pa, and 1 Pa.
Download figure:
Standard image High-resolution imageThe plasma potential (700 mm away from the cathode) is measured from the inflection point of the second derivative of the probe current, while the floating potential is the point where the probe current becomes zero. The difference between the floating potential and the plasma potential is the sheath potential. The plasma, floating, and sheath potentials are shown in figure 8 as a function of N2 pressure. The magnitude of the sheath potential decreases with increasing N2 pressure.

Figure 8. Floating potential (Vf), plasma potential (Vp) and sheath potential (Vs = Vf–Vp) as a function of N2 pressure.
Download figure:
Standard image High-resolution imageThe electron density and effective electron temperature [14] are shown in figure 9, which are calculated by the following relations:

where ne represents the electron density,  the EEDF, ɛ the electron energy, and Teff the effective electron temperature. The electron density increases with increasing N2 pressure, while the effective electron temperature shows a steep decrease from 0 Pa to 0.2 Pa, and at higher N2 pressures the decrease is more gradual.

Figure 9. Effective electron temperature (Teff) and electron density (ne) as a function of N2 pressure.
Download figure:
Standard image High-resolution image3.3. Chemical composition, phase content and microstructure of deposited coatings
Figure 10 shows the morphologies and cross-sections of the coatings deposited at 0.07 Pa, 0.2 Pa, 0.4 Pa, 0.6 Pa and 1 Pa N2. All the coatings contain macroparticles, which are inherent to the explosive nature of the DC cathodic arc evaporation process. The coating deposited at 0.07 Pa has a glassy structure. A similar glassy structure is observed for coating deposited in the absence of N2 (not shown here). All the coatings deposited at N2 pressures ⩾0.2 Pa have a columnar structure. At 0.07 Pa the topography of the coating shows globular grains which transform to faceted grains at 1 Pa. The thickness of the coatings decreases with increasing the N2 pressure. The thickness reduction by approximately 20%, 33% and 43% is observed for the coatings deposited at 0.4 Pa, 0.6 Pa and 1 Pa, respectively, compared to the coatings deposited at 0.2 Pa.
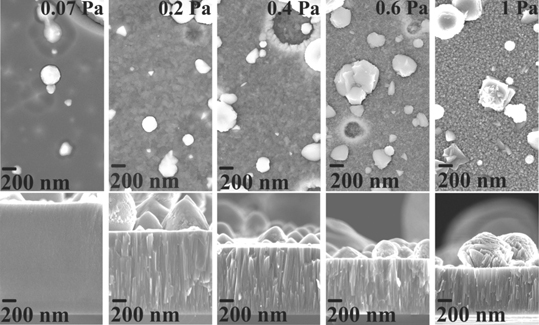
Figure 10. Morphologies and cross-sections of the coatings deposited at varying N2 pressures.
Download figure:
Standard image High-resolution imageX-ray diffractograms of the coatings are shown in figure 11. The coating deposited at 0.07 Pa N2 pressure has very broad or no significant peaks, while the coatings deposited at N2 pressures ⩾0.2 Pa show a cubic B1 structure. The crystallographic orientation along the growth direction is predominantly 220 for the coating deposited at 0.2 Pa. At 0.4 Pa the coating shows almost equal intensities of 111 and 220 peaks. At N2 pressures of 0.6 Pa and 1 Pa, the crystallographic orientation along the growth direction predominantly becomes 111. The decrease in full width half maximum of the 111 peak with the increasing N2 pressure indicates an improved crystalline quality of the coatings. The residual stress in the coatings decreases when increasing the N2 pressure. At N2 pressures in the range of 0.2 Pa to 0.6 Pa, the coatings are in a compressive residual stress state. At 1 Pa the residual stress in the coating is tensile. α (Ti), γ (TiAl) and α2 (Ti3Al) phases are observed in the coating deposited at 0 Pa.

Figure 11. XRD patterns of the coatings (note that for 0.07 Pa the intensity scale is logarithmic); residual stresses in the coatings are also indicated.
Download figure:
Standard image High-resolution imageThe compositions of coatings deposited at 0.07 Pa, 0.2 Pa, 0.6 Pa, and 1 Pa were measured by the ToF-E-ERDA and the results are shown in figure 12. The figure shows that the content of N increases with the increase in N2 pressure, while the content of O and H stays below 4.05 at.% and 1 at.%, respectively, for all the coatings. Another noticeable feature is that the Ti to Al ratio is approximately close to 1 in the coatings deposited at 0.07 Pa and 0.2 Pa, and at higher N2 pressures the Al content in the coating decreases slightly.

Figure 12. Coatings composition measured by ToF-E-ERDA.
Download figure:
Standard image High-resolution image4. Discussion
4.1. Effects of N2 pressure on electron density
The mean free path of electrons and ions decreases as more N2 is introduced in the chamber. Consequently, the probability for them to suffer inelastic collisions with gas atoms or molecules increases. Such collisions are responsible for the observed reduction in effective electron temperature (see figure 9) and the reduction in average energies of ions (see figure 4). This reduction in effective electron temperature is proportional to the reduction in effective electron velocity in plasma. The reduction in effective electron velocity means that the electrons stay for a longer time in the plasma. Since the arc is continuously operating at a constant current, an increase in electron density is expected. Another factor contributing to the increase in electron density (see figure 9) with the increase in N2 pressure is the increased probability of electrons being knocked out of the gas during inelastic collisions between electrons and the gas.
The bimodal distribution of the EEPF at 0 Pa is related to the fact that the cathode is the source of thermally emitted and thermo-field emitted electrons. With the increase in N2 pressure both distributions thermalize and appear as a single distribution.
4.2. Effects of N2 pressure on sheath potential
In the plasma, electrons have a smaller inertia than all the ions and therefore they are easily influenced by perturbations (e.g. chamber walls, plasma probes etc) which can cause the electrons to leave the plasma faster than the ions. As quasineutrality is an inherent property of the plasma, a potential (i.e. sheath) is developed to impede the flow or loss of electrons in order to maintain the quasineutrality.
At 0 Pa the electrons have a higher effective velocity ( ) compared to at 1 Pa and a higher sheath potential (−4.91 V) is thus required to retard the electron flow to the Langmuir probe (see figure 8). At 1 Pa the effective velocity of electrons decreases by 42% compared to at 0 Pa and thus a low sheath potential of −0.65 V is sufficient to impede the flow of electrons toward the probe.
4.3. Effects of N2 pressure on ion population
In the absence of N2 gas the cathode spot can be expected to have the type 2 behavior [24] that has a characteristic feature of a longer duration (slower velocity) of the cathode spot compared to type 1 [25]. Due to this longer duration, the area around the cathode spot tends to reach a higher temperature and more metal neutrals are thus expected to be emitted [26]. In such a plasma the charge exchange collision reaction Ti2+ + Ti → Ti1+ + Ti1+ is likely to occur, which promotes the generation of Ti1+. In the presence of N2 gas, the cathode surface forms a nitride layer [9, 10] where the cathode spot is expected to have the type 1 behavior [24] (i.e. a high velocity [25]) that leads to a reduction in the emission of metal neutrals [26], and thus the Ti2+ + Ti → Ti1+ + Ti1+ reaction becomes less probable. This explains how the dominant Ti ion species transition from Ti1+ to Ti2+ as the N2 pressure is increased from 0 Pa to 0.07 Pa (see figures 2 and 4). This transition is also manifested by a sudden increase in the average charge state of Ti ions between 0 and 0.07 Pa (see figure 4(b)).
Another observation of the impact of N2 pressure is on the population of Al2+ in the plasma. The stark decrease in the Al2+ signal with increasing N2 pressure (see figures 2 and 4) can be understood from the fact that Al2+ has an ionization energy of 18.82 eV [27], which is sufficient to ionize N2 (ionization energy of 15.58 eV [27]) and N (ionization energy of 14.53 eV [27]), while Ti2+ has a lower ionization energy of 13.57 eV [27].
Studies of single element cathodes show that Al ions have a wider angular spread than Ti ions [28]. The angular spread of Al ions becomes even wider when a compound Ti–Al cathode is used since lighter species in the plasma from a dual element cathode tend to have a wider spread compared to its angular spread from a single element cathode [29]. One can thus expect the Al ions to have a substantially wider angular spread in front of the cathode compared to that of Ti ions in the plasma from a Ti-50 at.% Al cathode. This wider angular spread of Al ions causes a decrease in the density of Al ions and a lower flux of Al ions is thus expected to be collected by the MEA probe. This is also the reason for the apparent dearth of Al ions in the present work (see figure 5).
4.4. Differences in plasma and coatings compositions
The ion composition of the plasma in the presence of N2 and at 700 mm away from the Ti-50 at.% Al cathode consists of Ti ions (the majority species), Al ions and a small fraction of TiN, N2 and N ions (see figure 5). However, the coatings deposited with such plasma contain almost an equal atomic percentage of Ti and Al with a significant fraction of nitrogen (see figure 12) which suggests that significant flux of Al and N (and possibly Ti) neutrals reaches the substrate and contributes to the growth of coatings (see figure 12).
A significant source of neutrals in the cathodic arc plasmas is the surfaces inside the deposition chamber [30]. Due to low sticking coefficient of cathodic arc plasma ions, the ions colliding with the surfaces do not stick and return to the plasma as neutral vapor [31, 32]. As stated earlier that Al ions have a wider spread compared to Ti ions, it can be expected that these Al ions when striking the walls of the chamber return to the plasma as Al neutrals and contribute to the growth of TiAlN coatings. Other sources of Al neutrals can be hot craters left by cathode spots (due to a lower boiling point of Al compared to Ti, it is more easily evaporated), evaporating macroparticles [33], and sputtering from the cathode [34].
As stated earlier the plasma species suffer more inelastic collisions as the N2 pressure is increased. This increase in number of inelastic collisions and the fact that Al and N2 have similar masses lead to the reduction in the Al flux at the coatings growth front. This is the reason why a slight decrease in Al content is observed in the coatings deposited at higher N2 pressures (see figure 12).
4.5. Impact of ion energies on coatings microstructure
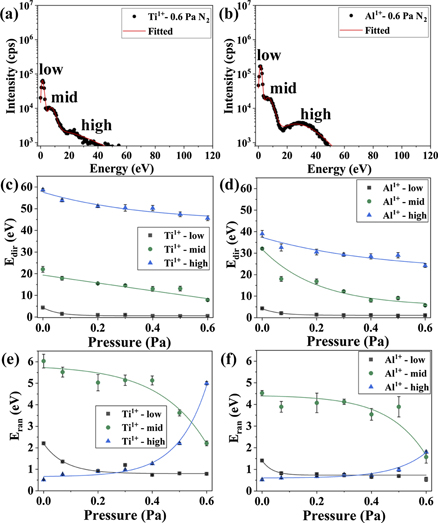
The IEDFs of the metal ions show three distinguishable distributions, which become indistinguishable with increasing N2 pressure (see figures 3 and 13(a) and (b)). These distributions can be categorized as low, mid and high energy distributions. The low energy distribution in the IEDFs (figures 13(a) and (b)) represents a thermalized ion flux with a peak ion energy roughly corresponding to the plasma potential (see figure 8). The high energy distribution in the IEDFs may represent ions that did not suffer any significant energy loss before reaching the analyzer. The origin of these high energy ions (⩾30 eV for Al, ⩾55 eV for Ti, for 0 Pa [35]) is explained by Anders [36] and Tanaka et al [37] as a combination of two factors: (i) the effective depletion of electrons in the vicinity of the cathode spot causes a double layer or a potential hump to form which accelerates the ions into the chamber (potential hump model); (ii) the high density in the cathode spot generates a pressure gradient with the surroundings, and this pressure gradient plus electron–ion coupling contribute to the high energy attained by ions (gas-dynamic model). The mid energy distribution in the IEDFs stems from charge-exchange collisions. Since a range of different charge-exchange collisions may occur, multiple peaks can be seen in the IEDFs [38, 39]. The charge-exchange collisions are expected to yield ions whose energy is higher than the completely thermalized ions but lower than the ions generated inside the cathode spot.
Figure 13. (a) and (b) show IEDFs of Ti1+ and Al1+ for 0.6 Pa N2, the solid line represents the fitting by shifted-Maxwellian distribution function; three distinct distributions in the IEDFs are also labeled as low, mid, and high. (c) and (d) represent the directional energy (Edir i.e. center of mass of the distribution) and (e) and (f) illustrate random energy (Eran i.e. full width at half maximum of the distribution) calculated from the fitting parameters of IEDFs of Ti1+ and Al1+. (c)–(f) The solid lines are the fitting of these plots by exponential function.
Download figure:
Standard image High-resolution image
To observe the relative changes in the three distributions of Ti1+ and Al1+, a shifted-Maxwellian function, as used by Bilek et al [21] and Atiser et al [40], is fitted to the distributions. The shifted-Maxwellian function  is:
is:
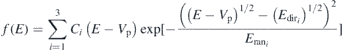
where Ci
is a scaling constant for the ith distribution, Vp is the plasma potential (measured by Langmuire probe) close to the entrance of the analyzer,  is the directional energy (center of mass of the distribution) of the ith distribution, and
  is the random energy (full width at half maximum of the distribution) of the ith distribution. The best fits of
  to the IEDFs recorded at 0.6 Pa are shown in figure 13(a) and (b). The directional (Edir) and random (Eran) energies of all the distributions are plotted as a function of N2 pressure in figures 13(c)–(f). The exponential functions fitted to the Edir and Er data, shown by solid lines, are intended to highlight the trends. With an increase in N2 pressure, the directional energy of all the three distributions of Ti1+ and Al1+ portrays a decreasing trend. The random energy of both Ti1+ and Al1+ decreases with increasing N2 pressure for the low and mid energy distributions, but an increasing trend is visible for the high energy distribution with the change in N2 pressure.
The shifts of the directional energies (Edir) for low, mid, and high energy distributions (see figures 13(c) and (d)) toward lower energies is an indication of increasing inelastic collision rates with increasing N2 pressure. An increase in N2 pressure results in a decrease in the random energies (Eran) for the low and mid energy distributions, however it increases Eran for the high energy distribution (see figures 13(e) and (f)). These changes indicate that the high energy distribution suffers more collisions and a significant portion of this distribution is transformed into the mid and low energy distributions.
The aforementioned loss of a significant fraction of the high energy distributions to the mid and low energy distributions at higher pressures of N2 influences the microstructure of deposited coatings. An energetic ion flux is known to favor a 220 growth texture in TiN coatings since this surface has the lowest resputtering yield compared to other crystallographic orientations [41]. At 0.2 Pa, the ion flux consists of a considerable fraction of the high energy ion distribution compared to 0.4 and 0.6 Pa. Thus, the coating's growth front in the case of 0.2 Pa experiences bombardment by a higher energy flux compared to the coatings deposited at 0.4 and 0.6 Pa, which results in a 220-texture and a higher compressive stress (see figure 11). When the N2 pressure increases or the energetic bombardment decreases, a 111-texture becomes favorable (see figure 11).
5. Conclusion
Varying the N2 pressure during the DC arc evaporation of Ti-50 at.% Al cathode leads to changes in plasma properties close to the growth front of the coating. The changes in the plasma properties ultimately lead to the changes in the microstructure of the TiAlN coatings. The results presented here show that an increase in N2 pressure reduces the mean free path of plasma species and thus leads to a decrease in the effective electron temperature which causes the electron density to increase. Moreover, the ionization of N is enhanced at the expense of Al2+ ions. In addition, the ion population in the plasma is dominated by Ti ions, while the fraction of N ions is marginal. Furthermore, significant amounts of Al and N neutrals contribute to the growth of the TiAlN coating. Finally, the increase in the N2 pressure increases the inelastic collisions among plasma species and thus reduces the flux of energetic ions which shifts the TiAlN growth texture from 220 to 111.
Acknowledgments
The authors acknowledge the financial support from VINN Excellence Center in Research and Innovation on Functional Nanoscale Materials (FunMat-II; Grant Number 2016-05156). JR acknowledges support from the Knut and Alice Wallenberg (KAW) Foundation for a Fellowship Grant and Project funding (KAW 2015.0043), and from the Swedish Government Strategic Research Area in Materials Science on Functional Materials at Linköping University (Faculty Grant SFO-Mat-LiU No 2009 00971). The authors would like to thank Babak Bakhit for assistance with Tof-E-ERDA analysis.