
Abstract
The influence of fin-shaped rod (FSR) with different installation positions on wind-induced vibration and energy harvesting of a cylinder-based aeroelastic energy harvester are studied by experiments and simulations. Two FSRs are installed symmetrically on the surface of a circular cylinder, and the coverage angle of each FSR is 20°. The installation position of FSRs on the cylinder is represented by the placement angle, θ, which varies in the range of ±160°. And the tested wind speed range is 0–6.8 m s−1. The results show that FSRs change the position of the separation point of the boundary shear layers, further affect the formation and shedding of vortices. Then the force on the cylinder changes, which causes the energy harvester to produce different vibration responses and energy outputs. When 0° < θ < 70°, back-to-back vortex-induced vibration (VIV) and galloping can be observed for FSR-cylinder, and the output power increases with the increase of wind speed, the maximum output voltage and power reach 18.1 V and 1.645 mW. For 70° ⩽ θ < 120°, the vibration of FSR-cylinder is suppressed, which is not conducive for energy harvesting. When 120° < θ ⩽ 160°, the vibration of FSR-cylinder firstly experiences VIV and then galloping occurs after reaching the critical wind speed.
Export citation and abstract BibTeX RIS
Nomenclature
| A (mm) | Amplitude of FSR-cylinder |
| C (Ns m−1) | Damping of system |
| CD | Drag coefficient |
| CL | Lift coefficient |
| Cp (nF) | Capacitance of PZT |
| D (mm) | Diameter of cylinder |
| FD (N) | Drag force |
| FL (N) | Lift force |
| H (mm) | Height of FSR |
| K (N m−1) | Spring stiffness per unit length |
| L (mm) | Length of FSR-cylinder |
| M (g) | Mass of FSR-cylinder |
| P (mW) | Output power of FSR-cylinder |
| R (kΩ) | Load Resistance |
| U (m s−1) | Wind speed |
| Vrms (V) | Root mean square voltage |
| fv (Hz) | Main frequency of vibration |
| fn (Hz) | Natural frequency of system |
| α (degree) | Covered angle of FSR |
| θ (degree) | Installation angle of FSR |
| ζ | Damping ratio |
| ρ (kg m−3) | Fluid density |
1. Introduction
In recent years, wireless sensor networks (WSNs) has developed rapidly as a key technology in the emerging computational field. WSNs have a wide range of applications, including environmental monitoring, fire detection, target tracking, Vehicular Ad hoc Networks, and body area networks. Because a great deal of sensor nodes are deployed in difficult and harsh terrain or environment, when the energy of node is exhausted, it will no longer be able to work efficiently unless the energy source is replaced or some energy harvesting technologies are introduced to supply the energy. The battery power, which is one of the main energy sources used by sensor nodes, has some properties such as limited energy density, environmental pollution, and difficult to recycle. These limitations make the traditional batteries can no longer meet the functional requirements of WSNs. Meanwhile, with the rapid development of large-scale integrated circuit and micromation of electronic component, the power consumption of electronic devices such as sensors has been continuously reduced to the level of milliwatt or even microwatt. Therefore, in order to achieve the purpose of compact and high-performance energy supply, self-powered technology that harvests energy from the environment is widely concerned [1–3]. The energy which can be collected in environment includes wind, thermal, acoustic, solar energy and so on. Among them, wind energy is abundant in nature, which is the clean and renewable energy [4][5]. It is one of the earliest energy sources developed by human beings, and the wind energy harvesting is one of the most important research fields for self-powered technology. Among various wind energy harvesting methods, the wind-induced vibration energy harvester has the advantages of simple processing and easy miniaturization, which is one of the hotspots in the research of miniature wind energy harvesters [6–8]. Wind-induced vibration is a typical fluid–solid interaction problem [9–11][12]. The working principle of the energy harvesting device based on wind-induced vibration is as follows. First, the wind energy is converted into mechanical vibration energy by the mechanisms including vortex-induced vibration (VIV) [13–15][16], galloping [17–21], and flutter [2, 22]. Then, the transduction of mechanical vibration energy into electrical energy is realized by piezoelectric [23–26][27], electromagnetic [28, 29], or electrostatic [30] technologies. However, the electrostatic generator requires a separate voltage source and is relatively large in scale, while small-scale electromagnetic energy harvesters are expensive. Piezoelectric energy harvesters have the advantages of high energy density and a wide range of energy collection frequency, and are more suitable for practical applications [31]. Therefore, the piezoelectric technology is considered in this study. Figure 1 shows a typical cylinder-based piezoelectric energy harvester. The cylinder is mounted on the free end of the cantilever beam. When the cylinder undergoes wind-induced vibration, the vibration energy can be converted into electrical energy by piezoelectric effect. In order to further increase the output power of the wind-induced vibration energy harvester, this work introduces fin-shaped attachments to control the vibration of the cylinder, and explores measures to strengthen the flow-induced vibration of the bluff body and methods for increasing energy density of wind-induced vibration system.
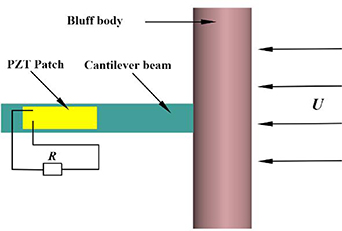
Figure 1. Cylinder-based piezoelectric energy harvester.
Download figure:
Standard image High-resolution imageVIVACE (vortex induced vibration aquatic clean energy) converter is a representative flow-induced vibration energy harvesting device [32]. The minimum working flow velocity in water can be as low as 0.25 m s−1. In order to further improve the energy conversion efficiency of VIVACE, the VIVACE group carried out a series of research on the factors affecting flow-induced vibration, including the surface roughness of cylinder [33, 34], the cross section shape of cylinder [35], and the number of cylinders [36–38], system damping and stiffness [39], etc. VIVACE converter realizes the harvesting of low-speed hydrokinetic energy using electromagnetic technology. The use of piezoelectric materials to collect fluid-induced vibration energy has a wider range of applications, including water and atmospheric environments. Taylor et al [40] first proposed an 'eel' type energy harvesting device in 2001, which uses the wake of bluff body to drive a flexible piezoelectric film to deform and harvest electrical energy. Li et al [41] proposed a bionic blade-type piezoelectric energy harvester. The blades are made of polyvinylidene fluoride. They found that when the wind speed is 8 m s−1, the maximum power can reach 296 μW. Eugeni et al [2] analyzed the performance of a piezoelectric energy harvester based on flag-flutter and maximum power output of 1.12 mW was obtained at optimal resistance of 66.6 kΩ.
Another form of harvesting fluid-induced vibration energy by piezoelectric effect is the cantilever beam type, which uses the vibration of a bluff body to cause high-frequency vibration of the cantilever beam, thereby deforming the piezoelectric layer mounted on the cantilever beam, as shown in figure 1. Because of its simple structure, the cantilever beam structure is widely used in self-powered systems of mini-sensors, and has obtained a certain economic benefit [6]. For cantilever beam structures that use VIV for energy harvesting, the range of synchronization region is critical to improve the efficiency of energy harvesting. Zhang et al [42] installed two small magnets with repulsive force at the bottom of cylinder and the bottom of supporting part, respectively. By changing the relative position of the two magnets, the natural frequency of the energy harvesting device changes significantly, which causes the synchronization region to move, and the energy conversion efficiency of the VIV acquisition system has been successfully improved. In addition, the outstanding characteristic of galloping is the aerodynamic instability, which is easy to induce large vibration. This phenomenon is beneficial for piezoelectric energy harvesting because the voltage generated by the piezoelectric harvester is related to the oscillatory amplitude. Mahadik and Sirohi [43] studied the harvesting of galloping energy using a cantilever beam structure with D-shaped cross section. The maximum output power can reach 1.14 mW when the wind speed is 4.7 m s−1. Based on this result, Sirohi and Mahadik [44] also proposed a galloping energy harvesting structure with triangle-cantilever beam. At a wind speed of 5.2 m s−1, it was found that the output power can reach 50 mW, and this level of power can meet the requirements of most commercial wireless sensors. It is worth noting that the square cylinder is a bluff body which is prone to aerodynamic instability. The galloping energy harvester with a square cantilever structure has also attracted a large number of scholars to carry out research. Abdelkefi et al [45] focused on the effects of the Reynolds number on the aerodynamics, onset velocity of galloping, and output power of the square energy harvester. Wang et al [46] analyzed the influence of the load resistance on the displacement, aerodynamic and power of square energy harvester. They found that VIV can be utilized to harvest energy at low wind speed and more energy can be collected by galloping at high wind speeds.
An important method to enhance the vibration or to excite the galloping of structure is to adopt passive control [47, 48]. For example, adding roughness strips on the surface of smooth cylinder, the flow-induced vibration can be strengthened or suppressed by changing the roughness or the installation position of the strips [49]. Zhu et al [50–52] studied the performance of the hydrokinetic energy harvester which is a oscillatory cylinder with fin-shaped attachments. They found that the maximum energy conversion efficiency can be obtained at the VIV upper branch or the onset of galloping, and the maximum energy density could reach 441 W m−3 in ocean current when the harvesters are arranged in stagger. Hu et al [53, 54] experimentally studied the performance of circular cylinder-based wind energy harvester with two small-sized rod-shaped attachments. The rod-shaped attachments have three shapes which are circular, triangular, and square. The results showed that the triangle-shaped attachment is better than the other two rod types for energy harvesting. Although lots of studies on wind-induced vibration energy harvesting has been reported, the energy conversion efficiency is generally low. The passive control method used for improving the efficiency of energy harvesters has attached much attention.
In order to understand the various factors that affect the vortex shedding of the cylinder with passive control, explore measures to strengthen the flow-induced vibration of the cylinder and increase the energy density of the aeroelastic energy harvester, the bionic structure which is fin-shaped attachment is introduced as the passive control measure in this paper. Ding et al [55] introduced the concept of utilizing fin-shaped attachment to strengthen wind-induced vibration of cylinder, and have presented the preliminary results of model experiment. They found that fin-shaped attachment can effectively improve the energy conversion efficiency of the cylinder-cantilever energy harvester. This article conducted a more thorough experimental test and numerical simulations were carried out to understand the internal mechanism of vibration. The wind-induced vibration characteristics of the cylinder are analyzed in detail by experimental test and numerical simulation, and the influences of the installation position of the fin-shaped attachment on the wind-induced vibration response and energy output of the structure are discussed.
2. Physical model and experimental setup
The physical model and experimental setup of the aeroelastic system are shown in figure 2. Different from the model of Hu et al [53, 54], the bionic structure of fish fin is used as the rod in this work. Fish can change the flow field around itself by moving the fins actively. Based on this phenomenon, fin-shaped rod (FSR) was introduced to control the vibration of the cylinder, which is the passive control measure. Two FSRs are installed symmetrically on the circular cylinder surface, as shown in figures 2(a) and (b). The diameter D and length L of the cylinder are 30 mm and 150 mm, respectively. The FSR is made by 3D printing and the material is high-density foam. For each FSR, the height is H, the angle of the covered circumferential surface area on the cylinder is α, the installation angle is θ, and the arc surface faces the incoming flow direction. The FSR-cylinder is fixed in the wind tunnel by a cantilever beam made of stainless steel. The size of the cantilever beam is 125 mm × 15 mm × 0.5 mm (length × width × thickness). The cantilever beam is driven by the cylinder in wind-induced vibration and the kinetic energy is converted into electrical energy by piezoelectric effect. The PZT piezoelectric layer is fixed at the root of cantilever beam, and the size of PZT is 46 mm × 6.4 mm (length × width). PZT is encapsulated in a polymer material, which can shield the influence of the external environment on piezoelectric performance, extend the life of PZT and improve its reliability. In addition, the external load resistance of the aeroelastic energy harvester is R. The detailed parameters of the aeroelastic system are listed in table 1. It should be noted that the geometric parameters of FSR in this paper are different from those in the previous work [55]. The coverage angle and the height of each FSR are different. This paper studies the effect of FSRs position on the energy conversion of the device, and the selected installation angle (θ) varies from 0° to ±160°. The present work focuses on the influence of installation position of FSR on vibration response and power harnessing of wind energy harvester. The height of FSR is considered as a constant which is 6 mm [52–54, 56].

Figure 2. (a) Physical model of FSR-cylinder; (b)sketch of FSRs attached on the cylinder; (c) experimental setup of aeroelastic energy harvester.
Download figure:
Standard image High-resolution imageTable 1. The detailed parameters of aeroelastic system.
| Parameter | Symbol (Unit) | Value |
|---|---|---|
| Diameter of cylinder | D (mm) | 30 |
| Length of cylinder | L (mm) | 150 |
| Mass of FSR-cylinder | M (g) | 6 |
| Height of FSR | H (mm) | 6 |
| Covered angle of FSR | α (°) | 20 |
| Installation angle of FSR | θ (°) | 0–160 |
| Load resistance | R (kΩ) | 100–1000 |
| Capacitance of PZT | Cp (nF) | 70 |
| Dielectric constant of PZT |
 33 33
| 1700 |
| Spring stiffness per unit length | K (N m−1) | 27.6 |
| Damping (ratio) of system | C (Ns m−1) (ζ) | 0.0246 (0.0303) |
| Natural frequency | fn (Hz) | 10.8 |
The experiments were conducted in the wind tunnel of the Key Laboratory of Low-grade Energy Utilization Technologies and Systems of Ministry of Education of China in Chongqing University. The maximum wind speed of the wind tunnel can reach 30 m s−1. The cross section of the test section is rectangular with dimension of 0.34 m × 0.42 m (width × height). The test section is made of plexiglass, which is convenient for non-contact measurement of parameters such as displacement. The displacement of FSR-cylinder is measured by the laser displacement sensor (IL300 by Keyence). The measurement range of IL300 laser displacement sensor is 160–450 mm, the accuracy is 0.1 mm, and the sampling frequency is 3000 Hz. The output of the laser displacement sensor and the voltage output of the piezoelectric layer are collected by a data acquisition instrument.
3. Numerical approach
3.1. Governing equations
In order to further analyze the experimental results and discuss the mechanism of flow-induced vibration of aeroelastic structure, numerical simulations of corresponding experimental cases were carried out in this work. The flow is assumed to be two-dimensional and unsteady, and the fluid is incompressible. The flow field is solved using unsteady Reynolds-averaged Navier–Stokes equations together with the k-ω SST turbulence model [57]. The governing equations are:
where xi are the Cartesian coordinates, ui are the corresponding velocity components, μ is the dynamic viscosity, ρ is the fluid density, t is the time.
The numerical calculation in this paper is based on the finite volume method by Fluent together with user-defined function. The continuity and momentum equations are solved using the pressure-based coupling algorithm. A second-order Gauss integration scheme with a linear interpolation for the face-centered value of the unknown is used for the divergence, gradient, and Laplacian terms in the governing equations. The second-order backward Euler method is adopted for time integration [47, 58]. In this work, the dimensionless time step ΔtU/D is 0.1813, which satisfies the Courant–Friedrichs–Lewy condition (ΔtU/D ⩽ t) [59].
In this work, the vibration system is simplified into a mass-spring-damping model, as shown in figure 2(b). On one hand, the width of the cantilever beam is only 1/10 of the FSR-cylinder length, so the physical model ignores the cantilever beam in the numerical calculation. On the other hand, when the FSR-cylinder reaches the maximum amplitude, the displacement of the FSR-cylinder in the flow direction is very small. Thus, the displacement in the flow direction can be ignored in the simulations. Therefore, the vibration system of this work is simplified as a classic mass-damping-spring system. The motion equation of the FSR-cylinder is

where M is the mass of the FSR-cylinder, Ffluid,y
is the lift force acting on the cylinder, C( ) is the system damping, K(
 ) is the elastic coefficient. The system damping C is composed of structural damping and energy harvesting damping. The damping and elastic coefficient can be obtained by free attenuation experiment. The system parameters are listed in table 2. The motion equations of the FSR-cylinder can be discreted by the method of fourth-order Runge–Kutta, the detailed description of numerical solution can be found in our earlier work [58].
Table 2. Mesh independence study.
| Grid (background | Relative error | |||
|---|---|---|---|---|
| + overset) | CL-RMS | CD-m | CL-RMS | CD-m |
| Fine (128 559 + 24 944) | 0.9688 | 1.3593 | — | — |
| Medium (91 179 + 18 908) | 0.9548 | 1.3469 | 1.4% | 0.9% |
| Coarse (53 799 + 13 644) | 0.9454 | 1.3279 | 0.98% | 1.4% |
3.2. Computational domain and grid generation
Figure 3 shows the computational domain and its size is 50 D× 40 D (length × height). The center of the cylinder is 20 D from the inlet boundary and 20 D from the upper and lower boundaries (Top and Down). The blocking ratio is less than 5%. The inlet boundary condition is considered as uniform velocity and the outlet is a pressure outlet. The top and down boundaries are set as symmetrical boundary conditions. And the non-slip boundary condition is applied for the cylinder.
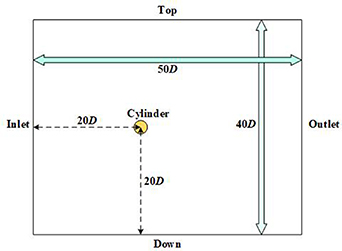
Figure 3. Computational domain.
Download figure:
Standard image High-resolution imageThe numerical simulation of this study uses the overset grid technology, as shown in figure 4. The overall mesh consists of two parts, including the background mesh and the component mesh (a circular area with a diameter of 3 D) that accompanies the motion of the cylinder. The background grid is generated at first to discretize the entire computational domain, while the component grid is used to deal with the cylinder and generated on the top of the background grid. The gradient grid is used for the background mesh to improve computational efficiency. As shown in figure 4(b), the component mesh is a circular area with a diameter of 3 D, and the local mesh refinement is considered for the near wall of the cylinder. The overset grid can improve the update efficiency of mesh and avoid grid deformation, which can better capture the characteristics of the flow field. The data exchange of the overlapping parts of the grid can be realized by interpolation. In order to improve the efficiency and correctness of the numerical method, three levels of grids with different densities were studied for grid independence verification. The results of force coefficient are shown in table 2, where CL-RMS is the root-mean-square value of the lift coefficient and CD-m is the time-averaged value of drag coefficient. It should be noted that the definitions of lift and drag coefficients are CL= Ffluid,y /(0.5 ρU2 DL) and CD = Ffluid,x /(0.5 ρU2 DL), where Ffluid,x is the drag force acting on the FSR-cylinder. The maximum difference between the results obtained by different grids is only 1.4%, which meets requirement of the calculation accuracy. Therefore, the grids with medium densities were selected for numerical calculations in this work. In addition, the numerical simulation results have been verified by experiment, and the comparative analysis of experiment and simulation can be found in sections 4.2 and 4.3.
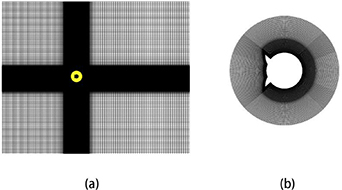
Figure 4. (a) The whole mesh and (b) component mesh.
Download figure:
Standard image High-resolution image4. Results and discussion
4.1. External load resistance
The load resistance is an important factor affecting the output power of the aeroelastic energy harvester. It should be noted that the load resistance is the external resistance connected to the output circuit of the wind energy harvester, as shown in figure 2. The optimal resistance is affected by many factors, including aeroelastic structure, wind speed, vibration mode, etc. Even a slight change in the installation angle of the FSR will affect the optimal resistance. In order to obtain the optimum load resistance for this work, the influence of the load resistance on the output power of FSR-cylinder energy harvester under different wind speeds was firstly tested. Figure 5 shows the output power of the FSR-cylinder under different wind speeds and load resistances, where the wind speed range is 0–6.8 m s−1 and the load resistance range is 100 kΩ–1 MΩ. The parameters of the FSR in experiments for load resistance influence study are H= 6 mm, α= 20°, and θ= 40°. It can be observed from figure 5 that the output power increases as the wind speed increases. Due to galloping of FSR-cylinder occurs, the maximum output power reaches 1.4 mW. At the same wind speed, as the load resistance increases, the output power firstly rise and then drops, and the power reaches a maximum value at 200kΩ. The optimal load resistance depends on the capacitance of piezoelectric film and natural frequency of the oscillatory system, which is determined by Gauss law [55, 60]. In this experiment, the capacitance of PZT is 70nF which can be measured by a digital capacitance meter, the natural frequency of the aeroelastic energy harvester is 10.8 Hz which is obtained by the free attenuation method, and the theoretical optimal value of load resistance is 215kΩ. It can be seen that the optimal load resistance obtained from the experiment agrees with the theoretical value. Therefore, the optimum external load resistance of other experiments in this work is considered to be 200 kΩ.
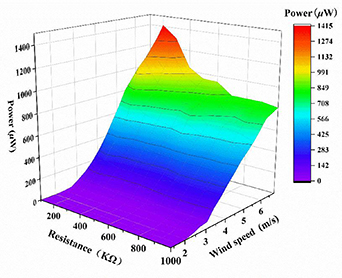
Figure 5. The output power of FSR-cylinder with different load resistances.
Download figure:
Standard image High-resolution image4.2. Amplitude response
In order to discuss the influence of the position of the fin-shaped attachment on the wind-induced vibration characteristics of the cylinder, this section analyzes the amplitude response of the FSR-cylinder under different conditions. In the experiment, the height H of FSR is 6 mm, the coverage angle α is 20°. The installation angle θ varies in the range of ±160°, and the interval is 10° in the experiment. Figure 6 shows that the dimensionless amplitudes (A/D) of the cylinder vary with wind speed at different installation angles, where the amplitude A is the average value of the maximum displacement of the cylinder over multiple vibration cycles. Figure 6(a) presents the results for the some representative cases that the interval of θ is 20° and figure 6(b) is the amplitude contour plotted based on all experimental results. Meanwhile, figure 6(a) shows the experimental results of smooth circular cylinder and the numerical results of representative cases for comparison. The numerical (CFD) results of amplitude responses match well with the experimental data, this verifies that the numerical method in this paper is effective. With increasing wind speed, the amplitude of smooth circular cylinder increases first and then decreases. When the wind speed exceeds 3.5 m s−1, the amplitude of smooth cylinder is extremely low, and the vibration is completely suppressed. The oscillation response of the smooth cylinder in the tested wind speed is consistent with the VIV. For the cylinder in VIV, the amplitude is very small when the cylinder starts to vibrate. As the wind speed increases, the vibration frequency of the cylinder approaches the natural frequency, and resonance occurs, that is 'synchronization'. As the wind speed further increases, the vibration amplitude decreases rapidly and enters the 'desynchronization' region. The phenomenon of VIV has been observed in many earlier works [61, 62]. In combination with figures 6(a) and (b), compared to the smooth circular cylinder, the amplitude of the FSR-cylinder increases with increasing wind speed when the installation angle of the fin attachment is 0° < θ< 70° (Region I). For the case of θ= 60°, when the wind speed exceeds the critical velocity, the amplitude of FSR-cylinder increases sharply with the increase of the wind speed, galloping occurs and the maximum amplitude can reach 2.17 D. When the installation angle is located in 70° ⩽ θ < 120° (Region II), it can be seen that the vibration of FSR-cylinder is very weak and the amplitude is almost zero. When the installation angle is 120° < θ ⩽ 160° (Region III), the amplitude response curves of FSR-cylinder is similar to the VIV of smooth cylinders. When the wind speed reaches the critical velocity at which galloping occurs, the amplitude of the cylinder increases sharply. It is worth noting that when the installation angle is 0° or 120°, the obvious vibration can be observed only when the wind speed increases to a large value, and then the amplitude gradually increases. This phenomenon indicates that the large wind speed is required for achieving aerodynamic instability of these two structures.

Figure 6. The amplitude ratios of FSR-cylinder at different installation angles.
Download figure:
Standard image High-resolution image4.3. Frequency ratio
Figure 7 shows the vibration frequency ratios (fv/fn) of FSR-cylinder with different installation angles vary with wind speed. It should be noted that, because the frequency variation trends of different cases in the same region of installation angle are similar, in order to facilitate the analysis, some representative frequency results are selected and plotted. The results shown in figure 7 include the cases of θ = 40° in Region I, θ = 80° in Region II, θ = 160° in Region III, and the cases of θ = 120° and the smooth cylinder. In addition, the simulation results agree well with the experiments for the frequency response shown in figure 7.
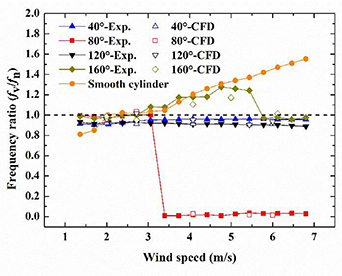
Figure 7. Frequency ratios of FSR-cylinders with different installation angles.
Download figure:
Standard image High-resolution imageThe dimensionless frequency (fv/fn) in figure 7 is the ratio between the main frequency (fv) of the vibration and the natural frequency (fn) of the system. When the vibration of smooth circular cylinder occurs, the frequency ratio first increases with the increase of wind speed, and then stabilizes around 1.0. When the wind speed exceeds 3.40 m s−1, the frequency ratio further increases with the increase of wind speed. The variation trend of frequency for smooth cylinder corresponds to the VIV initial branch, synchronous region (also known as locked-in or upper branch), and desynchronized region (also called lower branch). It is worth noting that the wind range where the vibration frequency is locked at the natural frequency is the best region of energy harvesting for smooth cylindrical by wind-induced vibration, but this range is relatively narrow. For FSR-cylinder, when the installation angle is 40°, as the wind speed increases, the vibration frequency increases first and then decreases, but the amount of change is small, and the vibration frequency of the cylinder is slightly lower than the natural frequency. In conjunction with figure 6, it can be seen that galloping occurs for FSR-cylinder at θ = 40°, and the galloping is a low-frequency and high-amplitude vibration response. When θ = 80°, the frequency ratio of FSR-cylinder is maintained near 1.0 at low wind speed. However, when the wind speed exceeds 3.4 m s−1, the vibration frequency drops sharply to nearly zero, the cylinder is in a stable state and has almost no vibration at this time. When θ = 120°, the vibration frequency of FSR-cylinder is similar to that of θ = 40°. The differences are that the vibration frequency of θ = 120° is smaller and the amplitude is much lower than those of θ = 40°. When the installation angle is 160°, the vibration of FSR-cylinder shows a VIV phenomenon in the range of low wind speeds. When the wind speed reaches the critical velocity, the vibration frequency of the cylinder drops sharply and falls to a value near the natural frequency. This is the phenomenon that as the wind speed increases, galloping occurs after the vibration of cylinder is desynchronized.
4.4. Energy harvesting
The experimental results of power harnessing of the aeroelastic energy harvester are shown in figure 8. The output voltages (Vrms) is the root mean square voltage which is usually used to analyze the output performance of the wind energy harvester. It is observed that the output voltage and harvested power (Ph) of the smooth cylinder first increase and then decrease with increasing wind speed. For FSR-cylinder, when the installation angle is in Region I, such as θ =20°, θ =40°, and θ =60° in figure 8, the Vrms and Ph of FSR-cylinders increase continuously with the increase of wind speed, and the maximum voltage and power reach 18.1 V and 1.645 mW at U= 6.8 m s−1. The maximum power of FSR-cylinder is 42 times as high as that of a smooth circular cylinder system. In addition, when the wind speed is the same, the larger the installation angle, the greater the energy output of the FSR-cylinder. Especially when the wind speed is high, the Vrms and Ph of the case at θ =60° is much higher than that of θ =20°, as shown in figure 8. When the FSR installation angle is in zone II, such as θ =80° and θ =100°, the Vrms and Ph of FSR-cylinder are almost zero in the tested wind speed range. The energy conversion characteristics of the FSR-cylinder in this region are poor. When θ =140° and θ =160° (Region III), as the wind speed increases, the Vrms and Ph of FSR-cylinders first increase and then decrease. After reaching the critical wind speed, both the Vrms and Ph increase sharply. The energy response of the FSR-cylinder is similar to the amplitude response (figure 6(a)), because the energy output of the piezoelectric film is closely related to the oscillation amplitude and frequency of FSR-cylinder. From the above analysis, it can be known that when the installation angle is in the Region I, the FSR-cylinder will gallop at higher wind speeds, which can better convert wind energy into vibration energy, and achieve the optimum effect of energy harvesting for the aeroelastic system, especially for the case of θ = 60°.
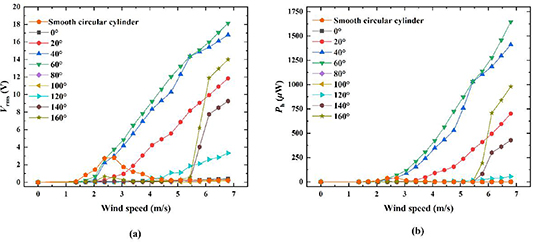
Figure 8. The energy output of the FSR-cylinders with different installation angles: (a) output voltage; (b) harvested power.
Download figure:
Standard image High-resolution image4.5. Force coefficient
The above contents are the experimental results of this work. In order to analyze the mechanism of wind-induced vibration of FSR-cylinder, numerical simulation was performed for the relevant experimental cases. The following contents are the simulation results of this work. The force analysis of structure is helpful for deep understanding the phenomenon of wind-induced vibration. However, it is difficult to test the force of FSR-cylinder experimentally due to it will affect the energy output of the aeroelastic energy harvester. Therefore, this study uses numerical methods to analyze the force of FSR-cylinder. Figure 9 shows the time histories of the force coefficient of FSR-cylinder at different installation angles, where the lift coefficient and drag coefficient are CL and CD, respectively. The time history curves of lift and drag coefficients are obtained by numerical calculation.
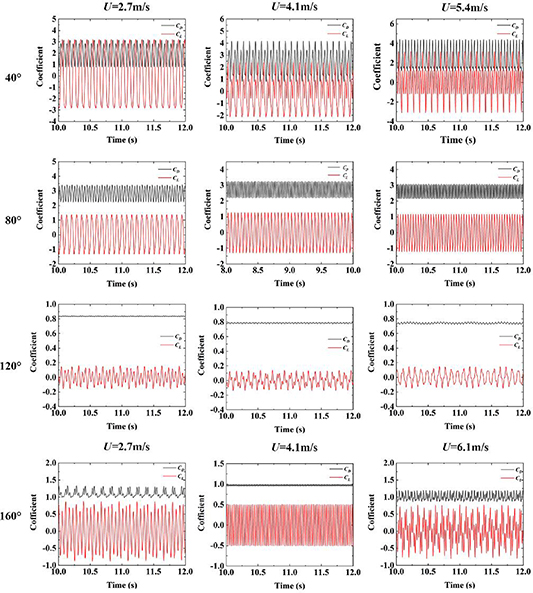
Figure 9. The time history of lift and drag coefficients.
Download figure:
Standard image High-resolution imageAs shown in figure 9, when the installation angle is 40°, the amplitude of the FSR-cylinder is high, and the force acting on the cylinder is relatively large. The peak values and frequencies of the lift and drag coefficients increase with the increase of the wind speed. The magnitudes of lift and drag forces are close. When the wind speed is 2.7 m s−1, the lift and drag coefficients change sinusoidally with time. When the wind speeds are 4.1 m s−1 and 5.4 m s−1, the time histories of lift and drag coefficients present multi-cycle characteristic, which contains multiple differences peaks. When the installation angle is 80°, the time histories of lift and drag coefficients show the regular sinusoidal change, but the values of CL and CD do not change much with the wind speed. And the drag coefficient is obviously larger than the lift coefficient when θ =80°. According to the theoretical criteria given by Den Hartog [63], the structure is stable in vibration and is not prone to instability, so the amplitude is smaller at θ =80°. When the installation angle is 120°, although the time histories of lift and drag coefficients also show a multi-cycle phenomenon, the peak values of the force coefficients are small. When θ =160°, the time histories of the force coefficients have a multi-cycle phenomenon when the wind speed is 2.7 m s−1. As the wind speed rises to 4.1 m s−1, the curve shows a regular sinusoidal change. And a multi-cycle trend is observed again when the wind speed increases to 6.1 m s−1. It can be seen from figures 6 and 9, when the amplitude of the cylinder is large, the time histories of lift and drag coefficients present a multi-period change phenomenon; when the amplitude is small, the time-history curves of the force coefficients show a regular sinusoidal variation trend.
4.6. Near-wake structure
The near wake of the cylinder can help to analyze the response mechanism of the cylinder in wind-induced vibration. This section selects one period of vorticity contours of the FSR-cylinder with four different installation angles for analysis, as shown in figure 10. Time t corresponds to the equilibrium position of the cylinder, and T is the vibration period of the cylinder. The selected wind speeds are 2.7 m s−1, 4.1 m s−1 and 5.4 m s−1 (except θ =160°). In combination with the previous analysis, the FSR-cylinder is in galloping state at 6.1 m s−1. In order to further analyze the galloping response of the FSR-cylinder when θ =160°, the case with wind speed of 6.1 m s−1 was selected in figure 10(c).

Figure 10. The near-wake structures of FSR-cylinder with different placement angles: (a) U= 2.7 m s−1; (b) U= 4.1 m s−1; (c) U= 5.4 m s−1(θ =40°, 80°, 120°) and U= 6.1 m s−1 (θ = 160°).
Download figure:
Standard image High-resolution image
For the installation angles of 40°, 80° and 120°, the separation points of the shear layers are located at the sharp corners of the FSRs. However, when the installation angle is 160°, the separation point of the shear layer is at the leeward position of the cylinder. It is worth noting that the separation point of the smooth circular cylinder is around 76° [64]. This phenomenon shows that the introduction of the fin-shaped attachment changes the position of the separation point of the shear layer on the cylinder, and when the installation angle is small, the separation point is fixed at the sharp corner of FSR. When the installation angle is large, the separation point moves downstream and approaches the stagnation point of the cylinder. When the installation angle is 40°, the cylinder oscillation has a large amplitude. At the three wind speeds shown in figure 10, the vortex patterns present the 2P mode [65], that is, two vortices shed from both sides of the cylinder in one vibration cycle. With the increase of wind speed, the stronger the entrapment ability of the shear layer, the greater the fluid force acting on the cylinder caused by the vortex shedding, and the vibration of the cylinder is strengthened. When the installation angle is 80°, the vortex pattern shows the 2S mode which indicates two single vortices shed per vibration cycle [65]. This pattern is similar to that of smooth cylinder, and the FSR-cylinder has a poor vibration effect for θ =80°. When the installation angle is 120°, the near-wake structure of the FSR-cylinder is also 2S mode. The difference is that the shear layer is relatively narrow and elongated at θ =120°, and the FSR-cylinder receives less lift and lower amplitude. This is because the separation point is fixed at the sharp corner by the FSR, which further causes the shear layer to be stretched, and the formation and shedding of the vortex moves downstream. For θ =160°, when the wind speeds are 2.7 m s−1 and 4.1 m s−1, the vortex patterns are 2S mode. However, when galloping occurs (the wind speed reaches 6.1 m s−1), the vortex pattern becomes more difficult to capture, which is similar to the 2P mode (four vortex shedding in one cycle), but the vortex pattern is not fixed for this case. The reason is that the separation point is no longer fixed at the sharp corner of the FSR, but is transferred to the surface of the circular cylinder. When the wind speed is small, the cylinder first undergoes VIV, and after the wind speed reaching a critical velocity, galloping occurs. In addition, when the FSR-cylinder is in galloping, the number of vortices shedding during one vibration cycle increases, and the frequency of vortex shedding and the structural vibration frequency is no longer a simple linear relationship.
5. Conclusions
This work studies the effects of FSR at different installation locations on wind-induced vibration and energy harvesting of a circular cylinder. The optimal load resistance of aeroelastic energy harvester was determined through experiments at first, the vibration response and energy output of FSR-cylinder at different wind speeds were obtained. In order to further investigate the vibration response, the fluid force acting on the FSR-cylinder and the near wake structure were analyzed by numerical simulations. The main conclusions are as follows:
- (a)The optimal load resistance of the FSR-cylinder harvester in wind-induced vibration is 200 kΩ under the conditions studied in this paper. When the FSR installation angle is 60°, the maximum output voltage and power of the harvester can reach 18.1 V and 1.645 mW at U = 6.8 m s−1.
- (b)When the FSR is introduced to control the wind-induced vibration of the circular cylinder, the vibration characteristics of the cylinder can be divided into three regions: 0° < θ < 70°(Region I), 70° ⩽ θ < 120° (Region II), 120° < θ ⩽ 160°(Region III). For the cases in Region I, the amplitude of FSR-cylinder increases with the increase of wind speed, the frequency ratio is slightly lower than the natural frequency of the vibration system, and back-to-back VIV and galloping can be observed. For Region II, the vibration of FSR-cylinder is suppressed. For Region III, the vibration of FSR-cylinder firstly experiences the initial branch, synchronization, and desynchronization area of VIV, and galloping occurs after reaching the critical wind speed.
- (c)When the amplitude of the FSR-cylinder is large, the time histories of lift and drag coefficients present a multi-period variation phenomenon; when the amplitude is small, force coefficients of the FSR-cylinder changes sinusoidally.
- (d)The introduction of FSR changes the position of the separation point of shear layer on the circular cylinder. When the FSR is installed in Region I, the separation point is fixed at the sharp corner of FSR. As the wind speed increases, the entrapment ability of the shear layer is strengthened, the fluid force acting on the cylinder is increased, and the vibration of FSR-cylinder is enhanced. For Region II, the vortex pattern 2S can be captured. For Region III, the separation point of the shear layer is transferred to the surface of circular cylinder. When galloping occurs, the number of vortex shedding in one vibration cycle increases.
Acknowledgments
The authors gratefully acknowledge the support from the National Natural Science Foundation of China (Grant Nos. 51776021 and 51977196), Natural Science Foundation of Chongqing (Grant No. cstc2020jcyj-msxmX0813), Fundamental Research Funds for the Central Universities (Grant No. 2020CDJ-LHZZ-045) and 111 Project (Grant No. B18062). We are also grateful to Dr Aaron Persad from Massachusetts Institute of Technology for his helpful grammatical edits.