

Abstract
Low-speed wind energy has potential to be captured for powering micro-electro-mechanical systems or sensors in remote inaccessible place by piezoelectric energy harvesting from vortex-induced vibration. Conventional theory or finite-element analysis mostly considers a simple pure resistance as interface circuit because of the complex fluid-solid-electricity coupling in aeroelastic piezoelectric energy harvesting. However, the output alternating voltage should be rectified to direct voltage to be used in practical occasions, where the theoretical analysis and finite-element analysis for complex interface may be cumbersome or difficult. To solve this problem, this paper presents an equivalent circuit modeling (ECM) method to analyze the performance of vortex-induced energy harvesters. Firstly, the equivalent analogies from the mechanical and fluid domain to the electrical domain are built. The linear mechanical and fluid elements are represented by standard electrical elements. The nonlinear elements are represented by electrical non-standard user-defined components. Secondly, the total fluid-solid-electricity coupled mathematical equations of the harvesting system are transformed into electrical formulations based on the equivalent analogies. Finally, the entire ECM is established in a circuit simulation software to perform system-level transient analyses. The simulation results from ECM have good agreement with the experimental measurements. Further parametric studies are carried out to assess the influences of wind speed and resistance on the output power of the alternating circuit interface and the capacitor filter circuit. At wind speed of 1.2 m s−1, the energy harvester could generate an output power of 81.71 μW with the capacitor filter circuit and 114.64 μW with the alternating circuit interface. The filter capacitance is further studied to ascertain its effects on the stability of output and the settling time.
Export citation and abstract BibTeX RIS
1. Introduction
With large-scale applications of wireless sensors and internet of things placed in remote areas, intensive research efforts have been devoted to continuous power supply technology including micro energy acquisition and self-powered systems in recent years [1, 2]. Due to the disadvantages of traditional chemical batteries such as bulky volume, chemical pollution and costly replacement in remote areas, converting ambient vibration or aeroelastic vibration energy into usable electrical energy through energy harvesting technology for powering small sensors has attracted much attention [3–6]. The mechanisms of energy harvesting from environmental vibration contain electrostatic [7–9], triboelectric [10–12], electromagnetic [13, 14], piezoelectric [15, 16] transductions and the combinations of the above [17, 18]. The piezoelectric transduction has received much attention because of its intrinsic characteristic of high power density. Practical applications of piezoelectric energy harvesting include structural health monitoring [19], heart pacemaker power supply [20, 21] and wireless transmission [22]. Plenty of research has been conducted on energy harvesting from base excitations [23–27].
Fluid exists ubiquitously in nature and researchers have explored ways to harvest energy when fluid brings some object movement. The fluid-solid coupled vibrations can be classified as galloping [28–30], flutter [31, 32], wake interaction [33] and vortex-induced vibration (VIV) [34, 35]. Due to the characteristics of simple configuration and easy construction, designing piezoelectric energy harvester applied to natural environment for powering wireless sensors and low-power electronics has attracted much attention [36]. In terms of harvesting energy from VIV, Barrero-Gil et al [37] proposed a spring-mounted circle to extract energy and identified the effects of mass ratio, mechanical coupling coefficient and Reynolds number. Gao et al [38] presented a piezoelectric cantilever with cylinder extension and the experiment showed their energy harvester had better performance in turbulent flow than in laminar flow. Dai et al [39] established a nonlinear distributed-parameter model for harvesting energy from VIV. Song et al [40] proposed an upright piezoelectric energy harvester applied in water and pointed out that lighter mass and larger diameter produced better performance. Wang et al [41] presented a model to solve the coupling problem with restriction of different cross-section shapes and built identification to confirm the semi-empirical parameters. Shan et al [42] designed a dual underwater system composed of two identical piezoelectric energy harvesters. The influence of spacing distance on coupling effect was studied and the output power was significantly improved. In respect of multi-directional energy harvesting, Su and Lin [43] proposed an U-shaped energy harvester for wind flow in orthogonal bi-directions. Wang et al [44] proposed a cross-coupled dual-beam energy harvester, which could cover broader operation wind speed range. Gong et al [45] designed a direction-adaptive energy harvester with a guide wing to solve directional sensitivity problem in varying flow environment. Zhang et al [46] designed an asymmetric magnetic-coupled bending-torsion piezoelectric energy harvester, which could increases output power and lower the resonance frequency.
Because of the difficulty in modeling fluid-solid-electric governing equations which include nonlinear aerodynamic force, structural vibration, piezoelectric mechanism and interface circuit, analytical method model or finite element analysis (FEA) could be unattainable or cumbersome [47]. Although the intricate structure of piezoelectric energy harvester can be simulated in finite element software, the finite element software can hardly deal with the complex nonlinear circuit. For convenience, the external interface circuit has been largely considered as pure resistance, especially in flow energy harvesting. To overcome this difficulty, equivalent circuit modeling (ECM) was put forward to connect the fluid-solid interaction domain and the interface circuit domain. Yang and Tang [48] proposed ECM for energy harvesting considering multiple modes under base excitation. The ECM parameters were obtained from theoretical analysis or FEA. The ECM was built in circuit simulation software and the accuracy of output power was validated. Tang and Yang [49] studied synchronized charge extraction with various combinations of electromechanical coupling and frequencies. The results showed the synchronized charge extraction could improve energy harvesting efficiency. Wang et al [50] developed multi-mode ECM for the segmented electrodes and the results demonstrated the output power could be increased near the second mode with segmented electrode configuration compared with the conventional configuration.
In terms of ECM in aeroelastic energy harvesting, Tang et al [51] presented an equivalent circuit representation for galloping energy harvesters and the aerodynamic force was represented by a non-standard user-defined component. The entire system was under analog simulation and the results were verified by experiment. Zhao and Yang [29] proposed the analytical solutions of alternating current circuit, standard circuit and synchronized charge extraction circuit. Abdelmoula and Abdelkefi [52] used capacitance and inductance for controlling the output voltage and the onset speed of galloping. Zhao et al [53] investigated synchronized switch harvesting interface circuit and the results showed this circuit could enhance power especially in higher wind speed condition. It is noted that little effort has been put into ECM on energy harvesting from VIV. Wang et al [54] presented ECM based on the Scanlan–Ehsan aerodynamic force model. However, the variable parameter of this model only contains the displacement of cylinder, thus the VIV interaction force was expressed in a simplified way. Compared with the Scanlan–Ehsan model, the van der Pol nonlinear wake oscillator model [55] containing the displacement of cylinder and the behavior of the near wake could describe the VIV interaction force more accurately and has been widely applied in academic research and engineering application. However, due to the nonlinear parameters in this model, fluid-solid bidirectional coupling and complex governing equation, the establishment of ECM becomes complicated.
To the best of our knowledge, no equivalent circuit is available for energy harvesting from VIV using the van der Pol wake oscillator model. This paper presents a VIV based piezoelectric energy harvester (VIVPEH) modeling approach through the double loop feedback circuit based on the van der Pol wake oscillator model. The nonlinear aerodynamic force and mechanical components are represented by user-defined or standard electrical elements. The analogy between the mechanical domain and the electrical domain is built to guide the transformation from governing equations into electrical equivalents. Then the total equivalent circuit equations are built in circuit analysis software and system-level simulation is conducted for transient analysis. The simulation results are in good agreement with the theoretical analysis and experimental results, which validates the proposed ECM. The influences of external resistance and wind velocity on output power performance for direct current circuit and alternating current circuit are further studied.
2. Conventional modeling method for VIVPEH
VIV is a kind of self-excited vibrations and it occurs when fluid flows through a non-rigid structure with certain shape such as cylinder and generates periodic force on the surface of the structure. Such vibration generated by fluid-structure interaction force could be transformed into electrical energy by applying the piezoelectric transduction mechanism. Figure 1 shows a typical composition of the VIV energy harvesting system. A VIVPEH consists of a cantilever beam with one end fixed and a tip cylinder at the free end. Piezoelectric layers are bonded close to the root of the cantilever and connected to an external load resistor. The voltage across the resistor is measured and calculated to obtain the output power of energy harvester.
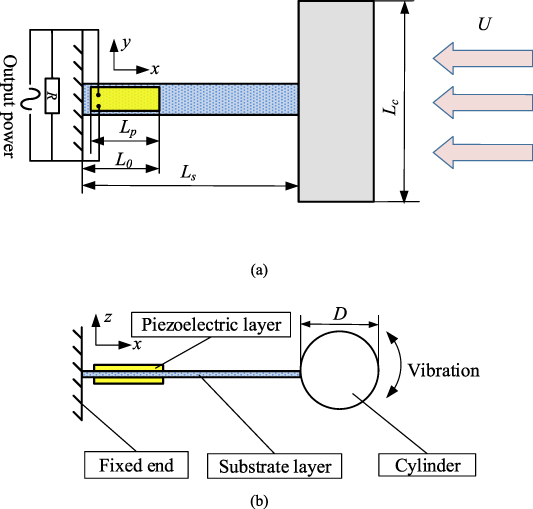
Figure 1. Schematics of VIV energy harvesting system: (a) front view; (b) top view.
Download figure:
Standard image High-resolution imageTo establish a mathematic model, the piezoelectric cantilever is usually assumed to follow the Euler–Bernoulli beam theory. A common method for modeling the VIV energy harvesting system utilizes the distributed parameter model considering the first mode of vibration based on mode shape discretization [56, 57]. Compared with the single-degree-of-freedom lumped parameter model, the distributed parameter model considers the distribution of piezoelectric layers and the rotational inertia of the attached cylinder and thus has higher accuracy. Through the Lagrange method, the fluid-solid-electricity coupled governing equations for VIVPEH with pure load resistance are given by:
where r(t) is the modal coordinate and φ(x) is the mode shape of the first mode. ζ is the damping coefficient and could be obtained by free vibration test; ω is the natural angular frequency of the first mode; RL is the value of the load resistance and V(t) is the output voltage across the load resistance RL. CD is the fluid drag coefficient. ρf is the density of air and U is the wind velocity. D and Lc represent the diameter and the length of attached cylinder, respectively. Ls is the length of the substrate layer. Cp is the capacitance of the piezoelectric layer. θ is the electromechanical coupling coefficient given by:
where e31 is the piezoelectric dielectric constant and bp is the width of the piezoelectric layer. hp and hs are the thickness of the piezoelectric layer and the substrate layer, respectively. Lp and L0 are the length of the piezoelectric layer and the distance from the clamped end to the far-end of the piezoelectric layer, respectively. In equation (1), f(t) is the periodic lift force caused by vortex shedding on the attached cylinder, which is expressed as:

where CL0 is the vortex shedding lift coefficient. q(t) is the parameter describing the wake behavior around the cylinder based on wake oscillator model, which is given by:
where St represents the Strouhal number, and A and  are constants.
3. ECM approach for VIVPEH
The above conventional modeling method can only predict the output power with an external circuit of pure resistance that is often utilized for evaluating performance of other types of energy harvesters as well. However, due to the output characteristics of high sinusoidal voltage and low current, it is not suitable to directly connect a harvester with an electrical load. On the other hand, the practical interface circuit is often more complex than a pure resistance, the output sinusoidal voltage must be rectified to direct form for powering small electronic components. Through the conventional modeling method, it is difficult or cumbersome to build the mathematical formulation and theoretical analysis of the areo-electro-mechanical coupling system and the complicated interface circuit. As a result, ECM method for VIVPEH is proposed to solve this problem.
First, the mechanical parameters and aerodynamic force are represented by electrical parameters through analogies between the mechanical domain and electrical domain, as shown in table 1. The basic mechanical parameters include mass, spring and damping. Mass and spring are energy storage components, and damping is energy dissipation component. The basic electrical parameters include resistance, inductance and capacitance. Inductance and capacitance are energy storage elements, and resistance is energy dissipation element. Thus, damping can be equivalent to resistance. The voltage on the capacitor is proportional to its charge and the voltage on the inductance is proportional to the second derivative of its charge with respect to time. Therefore, the mass term is analogous to the equivalent inductance and the spring term is analogous to the equivalent capacitance.
Table 1. Analogy between mechanical domain and electrical domain.
| Mechanical parameters | Electrical parameters |
|---|---|
| r(t) dr(t)/dt | Charge: Q1(t) Current: i1(t) |
| q(t) | Charge: Q2(t) |
| dq(t)/dt | Current: i2(t) |
| 1 | Inductance: L1, L2 |
| 2ζω + η | Resistance: R1 |
| 2πSt(q2(t) − 1)/D
| Resistance: R2 |
| 1/ω2 | Capacitance: C1 |
| D2/4π2St2 | Capacitance: C2 |
| θ f(t) g(t) | Turn ratio: N Voltage: VA1(t) Voltage: VA2(t) |
The parameter η represents the air drag force coefficient expressed as:
The big challenge for ECM is the representation of nonlinear aerodynamic force from VIV. In the previous ECM for base excitation or galloping, there are only two governing equations. One is the vibration equation of cantilever beam and the other one is the circuit equation based on the Kirchhoff law. According to the analogy between mechanical parameter and electrical parameter [50], the force f(t) can be represented by a voltage source. For energy harvesting from base excitation, the voltage source is a simple periodic sinusoidal wave. For galloping energy harvesting, the aerodynamic force is established by polynomial expansion from experimental results, and the voltage source could be represented as a self-defined arbitrary source with mathematical formulation. As a result, two equivalent circuit equations can depict the energy harvesting system. However, for VIV energy harvesting, the van der Pol wake oscillator model is widely used for describing vortex force in practice. As shown in equations (4) and (5), another parameter q(t) is introduced to express the wake behavior, which causes the periodic vortex shedding. From equations (1) and (4), the modal coordinate r(t) is determined by the force f(t), which is related to q(t). On the other hand, from equation (5), the displacement q(t) depends on the generalized force g(t), which contains r(t). In a word, in the process of VIV energy harvesting, the two parameters r(t) and q(t) are nonlinear terms coupled in two equations and influence on each other. Each parameter changes as the other one changes. After a period of time, r(t) and q(t) reach steady state, and the output of VIVPEH reaches the limit cycle oscillation.
Next, f(t) and g(t) are further represented by arbitrary sources VA1(t) and VA2(t), respectively. For a given VIVPEH under a certain wind velocity, the expression a1 (the front part of f(t), refer to equation (4)) is constant since φ(x) is determined by the structure of energy harvester. As shown in table 1, q(t) (the latter part of f(t)) is rewritten in the form of charge Q2(t). As the charge cannot be obtained from simulation software during transient analysis, Q2(t) can be rewritten as Q2(t) = C2 VC2(t), where VC2(t) is the associated voltage on C2. Finally, VA1(t) is expressed as:
In equation (5),  = d2
r/dt2 = d(dr/dt)/dt= di1(t)/dt. In simulation software, it is difficult to calculate the derivative of current. To solve this problem, we let di1(t)/dt
=
L1di1(t)/dt = VL2(t) as L1 is equal to 1 in the analogy.
= d2
r/dt2 = d(dr/dt)/dt= di1(t)/dt. In simulation software, it is difficult to calculate the derivative of current. To solve this problem, we let di1(t)/dt
=
L1di1(t)/dt = VL2(t) as L1 is equal to 1 in the analogy.  is represented by the voltage on the inductance L1. Therefore, VA2(t) is given by:
The equivalent resistance R2 is used to represent the nonlinearity of VIV in the second term of equation (5). R2 is given as:

From the above equation, the resistance R2 is proportional to the square of the voltage on C2. Since there is no accessible way to define such a customized nonlinear resistance in system-level simulation software, a self-defined voltage source VR2(t) is introduced to solve this nonlinear problem as the voltage source can be defined as a combination of several electrical components such as current through itself. Then R2 is transformed as VR2(t)/IR2, where IR2 is the current across R2. The voltage source VR2(t) is expressed as:
Finally, the governing equations (1)–(3) can be rewritten in circuit equation form as:


Figure 2 shows the equivalent circuit diagram of VIV energy harvesting system based on equations (11)–(13). There are three circuit diagrams that correspond to the three circuit equations. Each of the aerodynamic force and the wake oscillator force has their own input interface and output interface. The input interface of aerodynamic force can obtain the voltage on C2 and the in interface of wake oscillator force can derive the voltage on L1. It should be mentioned that the input interfaces have no effect on the loop circuit. The out interfaces are regarded as voltage sources to produce alternating voltages based on the customized expressions and the input interfaces in equations (7) and (8).
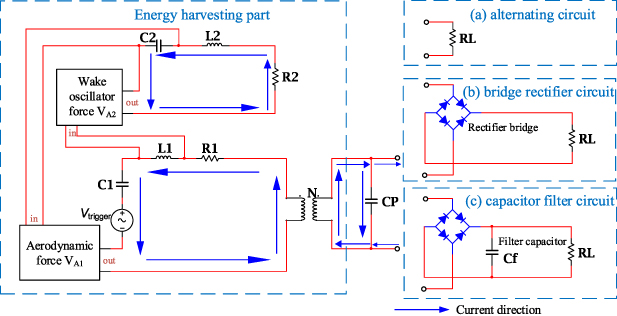
Figure 2. Equivalent circuit diagram of VIV energy harvesting system with various interfaces.
Download figure:
Standard image High-resolution imageIn circuit simulation software, the analysis mode is set as transient analysis. The initial currents through inductors are set to 0 A, and the initial voltages on capacitors are set to 0 V. The total simulation time is 30 s and the maximum time step in the simulation process is 0.0001 s.
Additionally, VIV is a form of self-excited vibrations caused by small initial disturbance pressure difference on the two sides of attached cylinder. To express this disturbance pressure difference as the initial vibration source at the beginning of VIV, Vtrigger(t) is introduced as trigger voltage source in equivalent electrical circuit to represent this mechanical disturbance on energy harvesting system. Vtrigger(t) should be quite small since it is only a power trigger. The Vtrigger(t) is set as  . The root-mean-square of Vtrigger(t) is 0.00001 V, which is quite small compared to the output voltage of energy harvester.
4. ECM validation with theoretical and experimental results
In order to verify the accuracy of the proposed ECM for aeroelastic VIV energy harvesting, the system-level circuit simulation results from the ECM are compared with theoretical numerical calculation and the experimental results from Akaydin et al [58]. Figure 3 shows the experimental setup platform. The VIVPEH consists of a cantilevered beam with a hollow cylinder attachment at the free end. The cantilever is made of aluminum with four PZT patches bonded on its two sides. There is a slight gap from energy harvester to the clamp. The external interface is a simple resistance. The physical properties of energy harvester are listed in table 2. Based on the analogy in table 1 and the parameters of energy harvester, figure 4 shows the circuit diagram in simulation software when wind speed is 1.19 m s−1. VA1(t), VA2(t) and VR2(t) are three self-defined voltage sources and each of them has four voltage input channels and two current input channels. The voltage input channels V(1) and V(2) on VA1(t) could obtain the voltage on C2 while V(1) and V(2) on VA2(t) get the electric potentials at the two ends of L1, which represents the double cycling coupling relationship between the aerodynamic vibration of energy harvester and wake oscillator. The current input channel on VR2(t) detects the current value by itself. V(2) and V(3) on VR2(t) acquire the voltage VC2(t). The transient simulation is applied to calculate the time-varying electric potential difference on load resistance RL. The average output power is calculated through equation P = V2 MAX/2RL, where VMAX is the maximum voltage on resistance at the steady state.

Figure 3. Experimental setup platform [58].
Download figure:
Standard image High-resolution image
Figure 4. Circuit diagram in simulation software when wind speed is 1.19 m s−1 with alternating circuit.
Download figure:
Standard image High-resolution imageTable 2. Physical properties of energy harvester [58].
| Parameters | PZT | Substrate | Cylinder |
|---|---|---|---|
| Length Lp, Ls (mm) | 31.8 | 267 | 203 |
| Width bp, bs (mm) | 25.4 | 32.5 | — |
| Thickness hp, hs (mm) | 0.267 | 0.635 | — |
| Density ρp, ρs (kg m−3) | 7800 | 2730 | — |
| Diameter D (mm) | — | — | 39.6 |
| Young's modulus Ep, Es (GPa) | 66 | 73 | — |
| Piezoelectric constant d31 (pm V−1) | −190 | — | — |
| Capacitance Cp (nF) | 10.15 | — | — |
The time-varying output voltage on load resistance in transient analysis is shown in figure 5. The wind speed is chosen to be 1.19 m s−1, which is close to 1.192 m s−1 in the experiment. The load resistance is set to 2460 kΩ, which is the same as the experiment. The output voltage starts to rise with time. After a period of about 15 s, the output voltage becomes a stable sinusoidal wave. The maximum output voltage is 22.26 V from ECM at 1.19 m s−1, which is very close to 22.181 V from the experimental measurement.
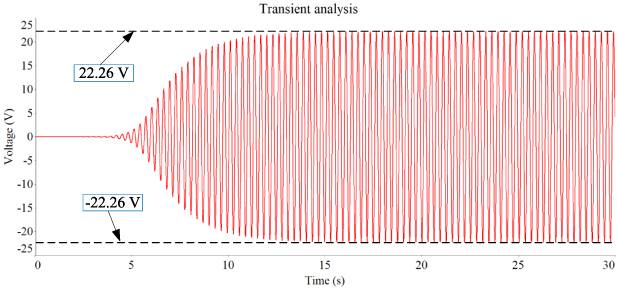
Figure 5. Time-varying output voltage on load resistance RL at 1.19 m s−1.
Download figure:
Standard image High-resolution imageFigure 6 shows the comparison of wind speed U versus the output power P from theoretical analysis, ECM simulation and experimental results. Some electrical parameters are related to the wind speed and thus they vary with the wind speed. As the wind speed goes up, the output power first increases to a maximum value then drops to almost zero. The maximum power obtained by ECM is 100.17 μW at 1.2 m s−1, which is very close to 100 μW at 1.192 m s−1 from experiment, and 100.34 μW at 1.19 m s−1 from theoretical analysis. It could be found that the onset and the peak of resonance region of ECM simulation are consistent with the experimental results. The results from ECM simulation agree well with the theoretical ones and the trend of ECM results is similar to the tendency of experiments results, which validates the proposed ECM method.
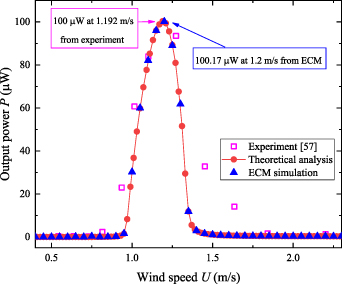
Figure 6. Comparison of theoretical analysis, ECM simulation and experiment results [58] on output power versus wind speed.
Download figure:
Standard image High-resolution imageThe comparison of output power P from theoretical analysis, ECM simulation and experiment versus load resistance R is shown in figure 7. The output powers from ECM simulation and numerical analysis are calculated at the wind speed of 1.19 m s−1. The maximum output power is 115.6 and 114.87 μW at RL= 5 MΩ from ECM simulation and theoretical analysis, respectively. As expected, the ECM simulation results agree well with the theoretical calculation. In the experiment [58], the VIVPEH generated an output power of 100 μW at RL = 2.46 MΩ, while from ECM simulation, the corresponding value is 100.9 μW.

Figure 7. Theoretical calculation, ECM simulation and experimental results of output power P versus load resistance RL.
Download figure:
Standard image High-resolution imageIt should be mentioned that ECM is derived from the transformation of mathematical governing equations to equivalent circuit equations. Therefore, the mathematical governing equations and the circuit equations are the different representations of one energy harvesting system and they are supposed to generate consistent results. The advantage of ECM is that it could deal with complex external circuits, which are difficult to be described by theoretical formulas.
The impact of trigger voltage Vtrigger(t) on output power should be taken into consideration. Thus, the equivalent circuit with only trigger voltage source is further simulated and studied. Other voltage sources VA1(t) and VA2(t) are removed, and Vtrigger(t) is retained as the only voltage source. C2, L2 and R2 are also moved away. The wind speed is set to 1.19 m s−1 and the load resistance is set to 2460 kΩ. Figure 8 gives the output voltage on load resistance with only trigger voltage source. The output voltage becomes a stable sinusoidal waveform at about the sixth second. The maximum voltage is 0.62 mV and the corresponding output power is 7.8 × 10⁻⁸ μW, which is negligible.

Figure 8. Output voltage on load resistance with only trigger voltage source.
Download figure:
Standard image High-resolution image5. ECM simulation with standard alternating circuit interface
The VIVPEHs with different kinds of electrical circuit interfaces are further investigated with the proposed ECM simulation. In this section, the standard alternating circuit interface is studied to explore the effects of load resistance and wind speed on the output power. Figure 9 shows the output power versus load resistance at different wind speeds for the alternating circuit interface. With the increasing of load resistance, the output power rises first and then decreases at all three wind speeds. There exists an optimal load resistance where the output power reaches the maximum for all three wind speeds. The maximum output power is 114.64 μW at 1.2 m s−1, 92.22 μW at 1.1 m s−1 and 65.85 μW at 1.05 m s−1 when the external load resistance is 5 MΩ, which is the optimal load resistance for this alternating circuit interface.
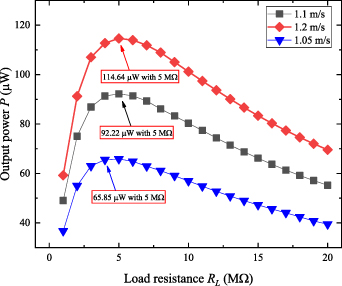
Figure 9. Output power versus load resistance for alternating circuit interface.
Download figure:
Standard image High-resolution imageFigure 10 shows the output power versus wind speed with various resistances for the alternating circuit interface. The load resistances are set to be 1, 2, 5 and 10 MΩ. For a given load resistance, the output power rises until the maximum value then drops to almost zero. The reason is that the frequency of vortex shedding deviates from the natural frequency of energy harvester when the wind speed is too high or too low. The VIVPEH generates power in a specified speed range, which is called the lock-in region. The bandwidth of the lock-in region for this energy harvester is about 0.6 m s−1, starting from 0.8 m s−1 and ending at 1.4 m s−1. The optimal wind speed is 1.2 m s−1 for all four load resistances. Thus, the maximum power could be obtained at 1.2 m s−1 with 5 MΩ load resistance.
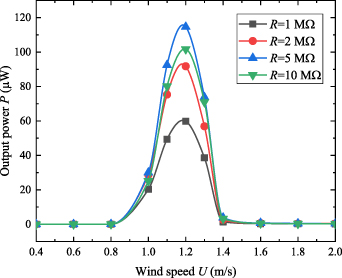
Figure 10. Output power versus wind speed with various resistance for alternating circuit interface.
Download figure:
Standard image High-resolution image6. ECM simulation with rectifying direct circuit interface
The direct circuit power supply is generally needed in the actual occasions for powering small electronic devices and sensors. Therefore, the voltage needs to be rectified before it is exported to the external circuit. In this section, the rectifier bridge circuit and the capacitor filter circuit are utilized as external interfaces to investigate the output performance through ECM simulation.
Figure 2(b) shows the diagram of bridge rectifier circuit interface. This interface consists of four diodes and an external resistor. The intention is to ensure that the direction of voltage on the load resistance is kept consistent. The wind speed is 1.19 m s−1 and the load resistance is set to 5000 kΩ. Figure 11 shows the output voltage on load resistance before rectification and after rectification. It can be observed that the voltage before rectification is an alternating sine wave, and the voltage after rectification is a direct wave in one direction. The maximum value of output voltage before rectification is 35.05 V while that after rectification is 33.30 V. The reason for this voltage loss about 1.75 V is the voltage drop by two diodes.

Figure 11. Time-varying output voltage before rectification and after rectification.
Download figure:
Standard image High-resolution imageAlthough the output voltage of rectifier bridge circuit is in a single direction, it contains relatively large alternating component, which is incompatible with many small sensors or external electrical circuits. Therefore, a filter circuit is needed to transform the pulsating direct voltage into smooth direct voltage. Figure 2(c) shows the diagram of capacitor filter circuit. It contains a full-wave rectifier, a load resistor and a filter capacitor Cf.
The output voltage of the capacitor filter circuit is shown in figure 12. After filtering, the output voltage still has small fluctuations. Umax, Umin and Uav are the maximum, minimum and average values of voltage on load resistance during the steady state, respectively. Uav is given by:

Figure 12. Output voltage of the capacitor filter circuit versus time.
Download figure:
Standard image High-resolution imageFigure 13 illustrates the variations of Umax, Umin and Uav as a function of the filter capacitor Cf. As Cf changes from 0.1 to 10 μF, Umax decreases from 20.889 to 19.8292 V and Umin increases from 17.925 to 19.861 V. The reason for this phenomenon is that a bigger filter capacitance results in higher stability of output voltage. The filter capacitor Cf has little impact on the Uav, which rises slightly from 19.812 to 19.881 V. The ripple factor S is introduced to describe the fluctuation of the output voltage, expressed as:
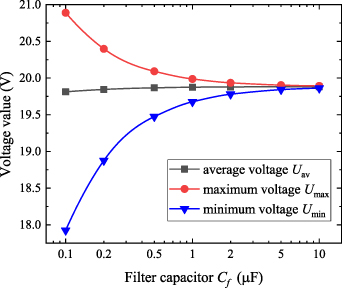
Figure 13. Variation of voltage value as a function of filter capacitor.
Download figure:
Standard image High-resolution imagewhere U1 is the peak value of the fundamental wave based on the Fourier harmonic analysis. A bigger ripple factor S expresses a greater voltage fluctuation. Figure 14 shows the influence of filter capacitor Cf on the ripple factor S. The ripple factor S drops from 0.0635 to 0.0006 as Cf varies from 0.1 to 10 μF. This illustrates that a larger filter capacitance is beneficial to the stability of output voltage. However, there is a drawback associated with a larger capacitor. Figure 15 shows the influence of filter capacitor on the settling time Ts when the voltage reaches the steady value. Ts is 15 s with 0.1 μF Cf while it is 320 s with 10 μF Cf. The steady-state time of output voltage has positive relationship with the filter capacitance, specifically it increases sharply with the filter capacitance.
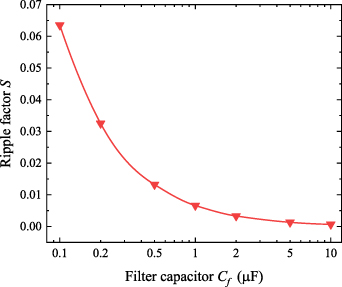
Figure 14. Influence of filter capacitor on ripple factor.
Download figure:
Standard image High-resolution image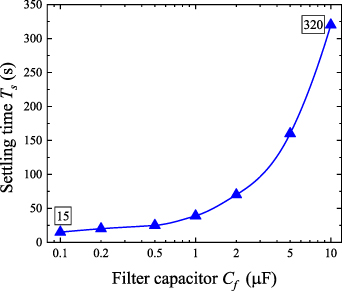
Figure 15. Influence of filter capacitor on the settling time.
Download figure:
Standard image High-resolution imageFigure 16 illustrates the effect of load resistance on the output power with capacitor filter circuit interface. The wind speed is set to 1.10 m s−1 and the filter capacitance is chosen to be 10 μF. The load resistance varies from 1 to 60 MΩ to cover a wide range. The output power first increases to a peak value and then drops as the load resistance increases, which is similar to the results in the alternating circuit interface. The maximum output power is 60.80 μW, which is less than that in the alternating circuit interface. The optimal resistance is 10 MΩ for the capacitor filter circuit while it is 5 MΩ for the alternating circuit. This is because the extra filter capacitor leads to the variation of the optimal resistance.
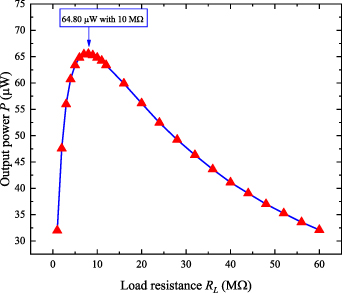
Figure 16. Output power of capacitor filter circuit versus load resistance.
Download figure:
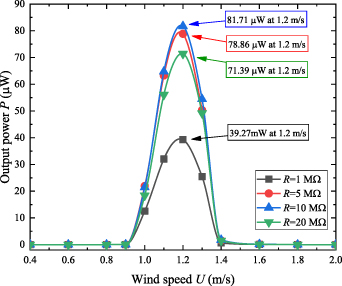
Standard image High-resolution imageFigure 17 shows the output power versus wind speed with different load resistances in the capacitor filter circuit. The filter capacitance is set to 1 μF. The load resistance is chosen as 1, 5, 10 and 20 MΩ. The capacitor filter circuit with 10 MΩ generates more output power than other load resistances. This conclusion is consistent with that in figure 16. For different external load resistance, the wind speed of 1.2 m s−1 is always the optimal value for power generation, which is also applicable to the alternating circuit interface. The maximum output power is 81.71 μW at 1.2 m s−1 with 10 MΩ resistance. The bandwidth of the lock-in region is 0.5 m s−1.
Figure 17. Output power versus wind speed with different load resistances for capacitor filter circuit.
Download figure:
Standard image High-resolution image
7. Conclusion
This paper presents an ECM method for studying the mechanism of piezoelectric harvesting energy from VIV. The analogy between the mechanical domain and electrical domain is built and the mechanical components are replaced by electrical elements in circuit simulation. The aerodynamic force of the van der Pol wake oscillator model is represented by a dual oscillating circuit system through self-defined voltage sources. The theoretical governing equations are represented by the circuit formulas based on the equivalent analogy. Then the proposed ECM is built in an electrical simulation software for system-level study of the harvester behavior. The initial instability of VIV is expressed as a small trigger voltage source. The effectiveness of ECM is validated by previous experimental results. Performances of VIVPEH based on ECM with the standard alternating circuit and the capacitor filter circuit are further analyzed through parametric studies. The optimal wind speed is found at 1.2 m s−1 for both circuits. The optimal resistance is determined to be 5 MΩ for the alternating circuit and 10 MΩ for the capacitor filter circuit. This difference was due to the filter capacitance, which changes the matching impedance. The maximum output power of 81.71 and 114.64 μW is attained by the capacitor filter circuit and the alternating circuit interface, respectively. For the capacitor filter circuit, a larger filter capacitance could lead to a more stable output but longer settling time. The proposed ECM method provides a practically helpful approach for designing and analyzing VIVPEH with various external interfaces.
Acknowledgments
This work is financially supported by the National Natural Science Foundation of China (Grant No. 51875116), the National Natural Science Foundation of China (Grant No. 51677043) and the China Scholarship Council (Grant No. 201706120129). The supports are gratefully acknowledged.
Data availability statement
All data that support the findings of this study are included within the article (and any supplementary files).
Conflict of interest
The authors declare no conflict of interest.