


Abstract
The second-order correlation function g(2)(τ = 0), input–output curves and pulse duration of the emission from a microcavity exciton–polariton system subsequent to picosecond-pulsed excitation are measured for different temperatures. At low temperatures a two-threshold behaviour emerges, which has been attributed to the onset of polariton lasing and conventional lasing at the first and the second threshold, respectively. We observe that polariton lasing is stable up to temperatures comparable with the exciton binding energy. At higher temperatures a single threshold displays the direct transition from thermal emission to photon lasing.
Export citation and abstract BibTeX RIS

Content from this work may be used under the terms of the Creative Commons Attribution-NonCommercial-ShareAlike 3.0 licence. Any further distribution of this work must maintain attribution to the author(s) and the title of the work, journal citation and DOI.
1. Introduction
Microcavity exciton–polaritons are quasiparticles arising from the normal-mode coupling (NMC) between a microcavity mode and a quantum-well exciton. Their bosonic nature allows them to undergo Bose–Einstein condensation (BEC), which has been intensively investigated in recent years [1–6]. Despite the inherently non-equilibrium nature of the polariton system, several textbook phenomena of BEC and superfluidity have been observed, in particular quantized vortices [2], linearized Bogoliubov excitation spectra [3, 4] and persistent currents [5]. In terms of applications, a peculiar quality of polariton condensates is the spontaneous emission of coherent light. Thus, they act as lasers without the need to meet the Bernard–Duraffourg inversion condition [7]. Consequently, they can operate at low excitation densities compared to vertical-cavity surface-emitting lasers (VCSELs) containing the same number of quantum wells [8].
The light polariton mass allows, in principle, condensation and accordingly inversionless lasing operation at room temperature. However, it has already been shown that material parameters place an upper limit on the possible range of temperatures over which gain in terms of bosonic final state stimulation can be achieved [9]. First of all, the regime of NMC has to be maintained at high charge carrier densities, where the exciton oscillator strength may bleach [10]. In this context, the probably most important parameter is the exciton binding energy Eb: once the thermal energy becomes comparable with Eb, the dissociation of excitons into free carriers is expected to set in. The linear optical response of the dissociated system is not significantly altered in this regime as is indicated by the persistence of the NMC regime in GaAs-based polaritonic systems even at thermal energies far beyond Eb and even up to room temperature4, as evidenced by electroluminescence measurements [11, 12]. In these GaAs-based systems, typical values of Eb ∼ 10 meV correspond to an exciton dissociation temperature of roughly 100 K. However, exciton dissociation also means that the predominant carrier species turns from composite bosons into fermions. Accordingly, degenerate population of the ground state and bosonic final state stimulation are suppressed, condensation becomes difficult to achieve and the emission of a macroscopic number of coherent photons is only possible by driving the system into the weak coupling regime and inverting it, thus turning it into a VCSEL.
In this paper, we investigate the transition from NMC to weak coupling and the mechanisms suppressing polariton lasing at elevated temperatures. To this end we performed temperature-dependent studies of the input–output (IO) curves, the emission energy, the second-order correlation functions and the pulse durations of the emission from a planar microcavity system. While recent experiments on the temperature dependence of polariton lasing in GaAs-based microcavities were performed using continuous-wave excitation lasers [13, 14], in our work we investigate the cavity emission subsequent to picosecond-pulsed non-resonant excitation. Also, we focus here on the main emission mode with the strongest intensity, showing characteristic signatures of a polaritonic laser for intermediate excitation powers at low temperatures.
2. The sample and the experimental setup
The investigated microcavity sample is the same as that used in earlier publications [4, 15]: it consists of a λ/2 cavity with three sets of four GaAs/AlAs quantum wells. The cavity layer is sandwiched between 16 and 20 alternating GaAlAs/AlAs distributed Bragg reflector layers acting as the top and bottom mirrors, respectively. This results in a vacuum Rabi splitting of about 14 meV. Detailed information about the design of the sample can be found in [3].
The sample was kept in a helium-flow cryostat allowing for easy temperature regulation by heating a resistor. As the cavity is wedge shaped, it was possible to carry out all measurements with nominally zero detuning between the cavity mode and the exciton by changing the position on the sample correspondingly. A pulsed Ti–sapphire laser with a pulse duration of 1.5 ps and a repetition rate of 75.39 MHz was used to excite the sample. The pump was focused to a spot approximately 20 μm in diameter on the sample at an angle of 45° from normal incidence. For non-resonant excitation the pump laser was tuned to ≈744 nm, which coincides with the first sideband minimum of the Bragg stopband. A microscope objective with a numerical aperture of 0.26 was used to collect the emission of the sample from the central area of the excitation spot. To investigate the far-field emission of the cavity, the Fourier plane of the objective was imaged onto the entrance slit of a 0.5 m monochromator and detected with a nitrogen-cooled charge-coupled device camera.
The photon correlations of the cavity emission were measured using a streak camera with an additional horizontal deflection unit. This method offers a time resolution of 2 ps, which is adequate for the fast processes in semiconductor microcavities. Details of this technique have been reported elsewhere [16, 17]. A particular wavelength range of the emission was selected using an interference filter with a 1 nm wide transmission window. By using a filter with this spectral window it is guaranteed that the effective time resolution of the streak camera setup remains at 2 ps. The exclusive collection of photons with in-plane momentum of k∥ ≈ 0 was achieved with a pinhole in the detection path.
3. Results and discussion
3.1. Angular resolved spectroscopy
Exemplary dispersions at various temperatures are shown in figure 1. The curves were measured at excitation powers just above the first nonlinearity observed, as will be discussed below. As can be seen from figure 1(f), the LP branch can be observed at temperatures up to T = 110 K. Thus, the regime of NMC persists over the whole temperature range over which zero detuning can be achieved on our sample. This behaviour is in agreement with other investigations [11, 12, 18]. In order to identify the polariton and photon lasing thresholds at different temperatures, we apply the two-threshold criteria presented in [15]. We first discuss the results obtained in the spectral domain, and compare these with the emission's temporal behaviour.

Figure 1. Dispersion curves at the first threshold observed at the indicated temperatures (linear colour scale). The excitation power at this first threshold was Pth1 = (a) 3.7, (b) 5.1, (c) 8.9, (d) 17, (e) 37, (f) 63 mW. The lines indicate the dispersion of the LP (solid black), bare exciton X (solid white) and bare cavity photon C (dashed white). In panel (d), further lines have been introduced: the solid blue line (LPBS) has been obtained by shifting the LP into the blue, while the dashed red line (CRS) has been obtained by shifting the cavity mode into the red. All dispersion maps are normalized, as shown by the linear colour scale at the top. In panel (d), the measured signal at large k∥ values has been magnified, as indicated correspondingly. It should be noted that the observation of both the LP mode and emission from blue-shifted polaritons in panels (a)–(d) is due to the particle density changing in time after the impact of an excitation pulse: the density first increases, then reaches a maximum and finally decreases again. The same holds for panels (e) and (f), in which emission from both the LP mode and the cavity mode can be seen.
Download figure:
Standard image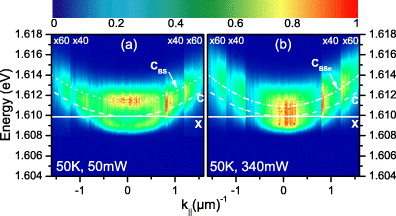
Figure 2. Dispersion curves at 50 K above the second threshold (a) and for very high excitation powers (b). The solid white (dashed white) line gives the dispersion of the bare exciton X (bare cavity photon C). The dotted white (dash-dotted white) line shows a blue-shifted cavity mode CBS (blue-shifted cavity photon mode CBSn including a change in the refractive index). The refractive index in CBSn has been changed in order to match the data. All dispersion maps are normalized, as shown by the linear colour scale at the top. The measured signal at large k∥ values has been magnified, as indicated correspondingly.
Download figure:
Standard imageFrom the dispersion curves shown in figure 1, the integrated intensity as well as the energetic position of the emission with zero in-plane momentum ( ) were extracted. The evolution of both quantities in relation to the excitation power is shown in figures 3 and 4 for different temperatures up to 110 K. Let us focus first on the temperature range up to 50 K. Here, mainly three different regimes can be identified: first, starting at low excitation powers, the emission intensity increases linearly. At these polariton densities, only the thermally populated LP branch is seen, and the emission energy remains almost constant. Further, when the power is increased, a strongly nonlinear behaviour is observed in the integrated intensity, followed by a regime of sub-linear increase. In the emission energy, a distinct blue shift is observed at this first threshold Pth1, followed by a further continuous blue shift and a regime of almost constant spectral position. Note that this intermediate continuous blue shift is not that pronounced at 50 K. Further, the shape of the dispersion is observed to change at this excitation power Pth1: the dispersion curve is mainly flat in this regime [15, 19]. This first nonlinear change in intensity, energy and dispersion shape is attributed to the onset of pulsed polariton lasing.

Figure 3. Emitted intensity from the strongest emission mode (|k∥| ⩽ 0.16 μm−1) versus the excitation power plotted for various temperatures. The intensities are normalized by accounting for the integration time used to measure the dispersion at the lowest excitation power. The vertical dashed lines mark the two thresholds, as indicated in panel (a).
Download figure:
Standard image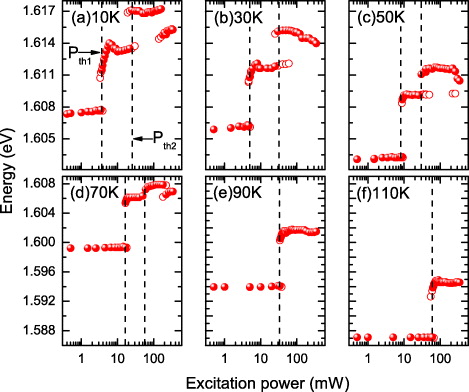
Figure 4. Energy of the strongest emission mode (|k∥| ⩽ 0.16 μm−1) versus the excitation power plotted for various temperatures. Open circles mark emission modes with weaker intensity. The vertical dashed lines mark the two thresholds, which occur at the same excitation power as in figure 3.
Download figure:
Standard imageAt higher density, denoted by Pth2 in figure 3(a), the intensity starts to increase again at least linearly, while the energy undergoes another considerable blue shift. The emission then comes predominantly from a slightly blue-shifted cavity photon mode (CBS). This is shown exemplarily for T = 50 K in figure 2(a). Here, the system has changed to the weak coupling regime and operates as a conventional photon lasing device. Interestingly, the microcavity shows a tendency for another shift of the emission energy into the red at very high excitation powers. The emission occurs then mainly from the bare cavity mode, as can be seen in figure 2(b). However, this red shift is of the order of the emission linewidth at these densities, which is roughly 2 meV. Note also that the true linewidth of the microcavity emission is only accessible in low-noise continuous-wave measurements. Nevertheless, a non-negligible part of the emission still occurs at a blue-shifted spectral position. Moreover, for larger k∥ values, the dispersion follows mainly that of a blue-shifted cavity mode (CBSn), which was calculated considering a different refractive index. This change in the refractive index is known to be related to high charge carrier densities [20].
At an increased temperature of 70 K the situation is somewhat unclear: the blue shift of roughly 5.5 meV that occurs at the first threshold is comparable with half the Rabi splitting, which would suggest that the system has changed to the weak coupling regime. This can be seen in figure 1(d): the emission mode is rather close to the bare cavity mode. Also, the shape of the dispersion at larger k∥ values is not unambiguous, as it lies between a blue-shifted LP (labelled LPBS) and a red-shifted cavity photon mode (labelled CRS). While a blue-shifted LP would be a hint of the persistence of NMC, a red-shifted cavity mode would point to photon lasing [21]. This would, however, be inconsistent with the blue shift of the cavity mode that we observe at excitation powers above the second threshold for T⩽50 K. Also, at higher excitation powers a second jump in the emission energy of ⩾1 meV is observed. It is only at this stage that the system is definitively in the weak coupling regime, and the emission then agrees perfectly with the cavity photon dispersion.
When going to even higher temperatures, in our experiments 90 and 110 K, only a single threshold can be seen in the accessible excitation power range. It is accompanied by a nonlinear increase in the intensity as well as by a large blue shift of 7 meV, which is half the Rabi splitting of our sample. As depicted in figures 1(e) and (f), the emission comes from the bare cavity photon mode. Contrary to the behaviour at lower temperatures, the emission energy seems to remain constant at very high emission powers at these high temperatures; the dispersion follows strictly the cavity parabola. Further, the jump in intensity at the photon lasing threshold is more prominent than the jumps at both thresholds for T ⩽ 70 K. This is expected and can be explained as follows. As shown in figure 3, the intensity of the LP below threshold decreases with temperature as non-radiative recombination processes become more relevant. However, in the regime of photon lasing, we assume that non-radiative recombination becomes negligible as radiative recombination dynamics should become faster, which results in a more pronounced jump. Note also that the reduction in photon lasing threshold excitation power at 90 K compared to the value at 70 K is in good qualitative agreement with [14].
Thus, two thresholds at excitation powers Pth1 and Pth2 have been observed in angular resolved measurements at temperatures up to 70 K. They are manifested in the clear changes in the integrated intensity as well as in the emission energy.
Let us briefly discuss the different energy shifts. At the transition to polariton lasing, the emission shifts into the blue. This blue shift is generally attributed to repulsive polariton–polariton interactions. However, another effect may also play a role. Recently, it has been shown that the ac Stark shift may induce a shift of the polariton modes into the blue [22]. Considering the magnitude of that blue shift and the necessary pump powers, the effect should certainly play only a minor role in our experiment. Further, as mentioned above, the emission just above Pth2 stems from a slightly blue-shifted cavity mode. A shift of a similar magnitude was observed in a multiple quantum-well structure and is attributed to a Stark-shifted exciton resonance [23]. However, the role of the exact spectral position of the exciton resonance in the high-particle-density regime above Pth2 should be negligible. Finally, we note that a red shift similar to the one we observe at very high excitation densities has been attributed to the electronic Kerr effect [24]. It is, however, difficult to compare these results with the present work, as the experimental conditions were quite different.
Another interesting quantity is found in the relative positions of the two thresholds, ρP = Pth1/Pth2, as depicted in figure 5, where all IO curves are plotted on a comparable scale. To realize comparability we express the excitation densities in fractions of the lasing threshold Pth2. Therefore, as mentioned above, we assume that in the photon lasing regime the dynamics become so fast that non-radiative recombination becomes negligible and the emitted intensity therefore becomes directly proportional to the inserted carrier density independent of temperature. While at 10 K the relative excitation density ratio of the first to the second threshold takes on a value of 0.16, it slightly decreases to 0.13 at 30 K (figure 5, inset). This finding agrees with previous studies showing that a slightly increased lattice temperature tends to lower the polariton condensate threshold for not too positive detunings. However, the exact range of detunings where this decrease of the threshold occurs was shown to vary from sample to sample and probably also depends on the excitation conditions [13, 25]. Generally, previous studies have shown the polariton bottleneck to become more efficiently suppressed at around 30 K due to beneficial phonon scattering [26].
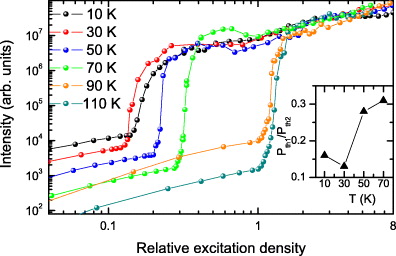
Figure 5. Emitted intensity from the ground state versus the relative excitation density plotted for various temperatures. Relative excitation densities are given in fractions of the (temperature-dependent) photon lasing threshold Pth2. The curves are shifted in intensity to allow a direct comparison of their evolution. The inset shows the ratio of Pth1 to Pth2. The lines are a guide to the eye.
Download figure:
Standard imageAt even higher temperatures, ρP increases up to a value of 0.31 at 70 K. To some degree this increase for T > 30 K is expected and can be explained as follows: on the one hand, the Mott transition basically occurs either due to wave function overlap of the inserted carriers or due to an ionization catastrophe [27], causing screening and thus further ionization when a certain number of carriers are inserted into the system. In both cases the transition carrier density—which is assumed to coincide with Pth2—is not expected to show a significant temperature dependence unless very low temperatures way below 10 K are investigated for Eb ∼ 10 meV considered here [28]. On the other hand, it is known that the scattering rate from the exciton reservoir towards the bottom of the LP branch is inversely proportional to the exciton temperature, thus increasing also the excitation power necessary for polariton condensation [29]. Both effects lead to an increase of ρP.
3.2. Photon statistics and pulse duration
Following [15], we now compare the spectroscopic data discussed so far with the results obtained in the temporal domain. Therefore, we monitored the equal-time second-order correlation function

where  and
and  denote photon creation and annihilation operators of the mode of interest, as well as the emission pulse duration in relation to the excitation density. The signatures of spontaneous emission in the thermal regime and photon lasing are values of g(2)(0) equal to 2 and 1, respectively, corresponding to the emission of thermal light below threshold and coherent light in the photon lasing regime. The temporal evolution of the emission pulse and thus the emission pulse duration can be derived from the same data set as used to quantify photon correlations [15]. To quantify the pulse duration, the Gaussian standard deviation has been chosen in order to facilitate correction of jitter-influenced errors at short pulse lengths [17].
Photon correlations and emission pulse durations at various temperatures are shown in figures 6 and 7, respectively. At temperatures up to 70 K two thresholds corresponding to the onset of polariton and photon lasing can be identified. At T = 10 K, the pulse duration shortens to 5 ps when approaching the first threshold and then increases again in the polariton lasing regime to approximately 17 ps. Beyond the second threshold the emission pulse duration decreases to the bare cavity lifetime of approximately 2 ps. The corresponding g(2)(0) shows a decrease from the thermal regime value of 2 towards a value close to 1 at the first threshold, reflecting thus a high degree of second-order coherence. This is followed by an increase towards values around 1.3. This increase in g(2)(0) can be explained considering scattering processes between polaritons with wave vector k∥ = 0 and polaritons with k∥ ≠ 0 [30, 31]. These processes increase above the threshold to polariton lasing, acting thereby as a noise source for the mode around k∥ = 0. Consequently, this results in a loss of second-order coherence, thus increasing the g(2)(0) values at excitation powers between the two thresholds.
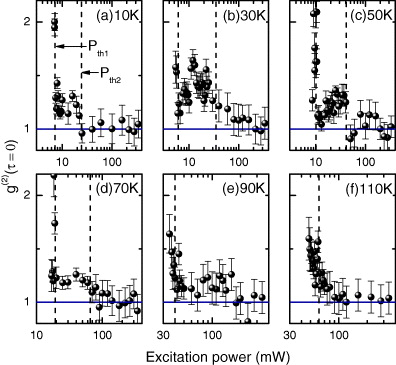
Figure 6. Excitation power dependences of the equal-time correlation function g(2)(0), measured at different temperatures. The horizontal line indicates the coherent state g(2)(0) = 1 and the vertical dashed lines represent the thresholds as in figures 3 and 4.
Download figure:
Standard image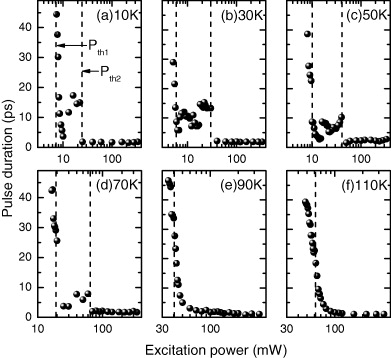
Figure 7. Excitation power dependences of the emission pulse duration, measured at different temperatures. The vertical dashed lines represent the thresholds as in figures 3 and 4.
Download figure:
Standard imageAbove the second threshold, g(2)(0) reduces to unity, indicating the Mott transition and the onset of standard photon lasing. So far the data agree with the results presented in [15].
The positions of the two thresholds are also in good accordance with the positions of the nonlinearities in the IO curve shown in figure 3. At elevated temperatures up to 50 K, the situation is similar. Also for these temperatures, the evolution of the pulse duration and the equal-time correlations g(2)(0) show a two-threshold behaviour. However, in the polariton lasing regime the increase in pulse durations tends to decrease with increasing temperature. We interpret this behaviour in terms of an acceleration of the relaxation dynamics of the non-resonantly excited carriers towards the polariton dispersion, as discussed above. Again, the results obtained at 70 K do not allow for a clear distinction between two thresholds: while the pulse duration exhibits a small increase at intermediate powers, g(2)(0) basically decreases monotonically from a thermal to a coherent value.
At even higher temperatures the situation changes significantly. At 90 and 110 K only a single threshold is visible in both the pulse duration and the g(2)(0). It occurs at a threshold excitation density 3–10 times higher than the first threshold evidenced at lower temperatures, and roughly coincides with the excitation densities at the second threshold seen there. Therefore, we consider it a reasonable assumption to link this single threshold to the onset of standard photon lasing.
4. Summary
In conclusion, we have shown that a two-threshold behaviour in the emission of a GaAs-based microcavity can be observed at temperatures up to 70 K. These two thresholds are attributed to the onset of polariton lasing and the transition to photonic lasing at high excitation densities.
At a first glance, one possible reason for the non-appearance of polariton lasing at temperatures above 70 K might be because of the increase of the exciton linewidth with increasing temperature. This change in the exciton linewidth would directly affect the Rabi splitting. However, this can be disproved by dispersion measurements at very low excitation power, from which we deduce a Rabi splitting of roughly 13.7 meV at 110 K. This is in agreement with [32], which states that the linewidth of quantum-well excitons does not increase significantly for temperatures below 100 K.
Following the analysis of the relative position of the observed two threshold, the suppression of polariton lasing at higher temperatures can be explained by thermal ionization of excitons which effectively reduces the available number of polaritons. However, it should be noted that our results do not exclude the possibility that the breakdown of NMC may be explained in terms of Coulomb-correlated electron–hole plasma systems [33, 34].
Therefore, further theoretical calculations are necessary to clarify the nature of this transition.
Acknowledgments
The Dortmund group acknowledges support from the Deutsche Forschungsgemeinschaft through the research grant DFG 1549/19-1. The group at Würzburg University acknowledges support from the State of Bavaria.
Footnotes
- 4
At those high temperatures, NMC has been observed as the Rabi splitting was still larger than the difference of the linewidths of the exciton and the cavity mode.