


Abstract
The production of W bosons in association with two jets in proton–proton collisions at a centre-of-mass energy of  has been analysed for the presence of double-parton interactions using data corresponding to an integrated luminosity of 36 pb−1, collected with the ATLAS detector at the Large Hadron Collider. The fraction of events arising from double-parton interactions, f(D)DP, has been measured through the pT balance between the two jets and amounts to f(D)DP = 0.08 ± 0.01 (stat.) ± 0.02 (sys.) for jets with transverse momentum pT > 20 GeV and rapidity |y| < 2.8. This corresponds to a measurement of the effective area parameter for hard double-parton interactions of σeff = 15 ± 3 (stat.) +5−3 (sys.) mb.
Export citation and abstract BibTeX RIS
GENERAL SCIENTIFIC SUMMARY Introduction and background. In theoretical calculations for the production of energetic final states in proton–proton collisions studied at the Large Hadron Collider (LHC), the inner structure of the proton is described in terms of partons, quarks and gluons. This approach incorporates universal parton distribution functions that express the probability of finding a single parton with a given momentum fraction of the proton. Factorization describes the interaction of a single pair of partons in a single proton–proton scatter. Since protons are extended objects, containing a potentially large number of partons, some proton–proton collision may consist of more than one such elementary interaction. In this case, the factorization picture is insufficient, and a deeper understanding of the interactions in terms of double-parton scattering (DPS) effects is required, driven by new measurements.
Main results. We report on the first measurement of DPS at the LHC, using interactions involving the simultaneous production of a W boson and two jets. The jets consist of collimated sprays of particles that originate from partons produced either in the same scattering process as the W boson or in a secondary scatter. The relative size of the DPS contribution to the production cross-section for this final state was extracted by a fit to the measured correlation of the two jets in transverse momentum space and amounts to a fraction, fDP, equal to 0.08 ± 0.01 (stat.) ± 0.02 (sys.).
Wider implications. DPS processes constitute an important background to many signals for new physics, such as the production and decay of supersymmetric particles or the Higgs boson. This measurement gives the first experimental constraint on the size of these effects at the LHC.
 Figure. Distribution of the absolute value of the difference between the transverse momenta of the two jets accompanying the W boson, Δjets, in the data (dots) compared to the expectations from the best fit of the DPS fraction fDP (green histogram). Data and the overall fit have been normalized to unity, with template A representing the single-parton scattering contribution, and template B representing the double-parton scattering contribution.
1. Introduction
Double-parton interactions (DPI) in hadron-initiated processes have been discussed in theoretical studies since the first days of the parton model [1–3]. These studies have subsequently been refined and reformulated in the framework of perturbative quantum chromodynamics for a variety of processes such as double Drell–Yan production, four-jet production, and W production associated with two jets [4–10]. Potential correlations in colour and spin space have been analysed theoretically [11], and evolution equations for multi-parton distribution functions have been derived [12]. The formalism [7, 8] to deal with DPI in hadronic interactions at a centre-of-mass energy  may be summarized, assuming perturbative factorization, by

where  is the differential double-parton interaction cross section for the inclusive production of a combined system Y +Z at a given
  , and the
  is the differential partonic cross section for the production of a system Y or Z in the collision of partons k1 and k2. The symmetry factor m is equal to one if Y =Z and equal to two if Y ≠Z. The fij(xi, xj, μF) are the double-parton distribution functions (DPDFs) evaluated at a specific factorization scale, μF. The integration over the momentum fractions xi and xj of the two partons from the same proton is constrained by energy conservation such that xi + xj ⩽ 1. A summation over all possible parton combinations is implicitly assumed. Typically, the DPDFs are expressed in terms of the conventional single parton distributions using a factorized ansatz [7, 8], namely

where the factor (1 − xi − xj)Θ(1 − xi − xj) implements the kinematic constraint and Θ(x) is the Heaviside step function. The effective area parameter for DPI, σeff(s), is defined at the parton level and, in the formalism outlined here, is independent of the process and of the phase-space under consideration. Naively, it can be related to the geometrical size of the proton, leading to an estimate of σeff ≈ πR2p ≈ 50 mb, where Rp is the proton radius. Alternatively, σeff can be connected to the inelastic cross section, which would lead to σeff ≈ σinel ≈ 70 mb at  [13, 14].
A number of measurements of σeff(s) have been performed in pp or  collisions at centre-of-mass energies of 63 GeV [15], 630 GeV [16], 1.8 TeV [17, 18] and 1.96 TeV [19]. The measured values range from about 5 mb at the lowest energy to about 15 mb at Tevatron energies. Attempts to understand these values have used non-trivial correlations between the two scattering systems to explain the differences between these measured values [20, 21].
In the scientific programme of the Large Hadron Collider (LHC), issues related to multi-parton interactions have attracted increasing attention [22–35]. This surge of interest is due to the higher centre-of-mass energy leading to enhanced parton densities and therefore to an anticipated larger impact of such effects on a multitude of physics signatures. The high energy and high luminosity available at the LHC also implies that multiple interactions should occur at higher transverse momentum, pT, offering the possibility to further study these interactions in a variety of processes. This paper presents a measurement of σeff in pp collisions at  performed with the ATLAS detector [36], using events with two jets produced in association with a W boson.
2. Theoretical background
The quantity σeff parameterizes the double-parton interaction part of the production cross section for a composite system (Y +Z) in hadronic collisions. Assuming no correlations between the two systems, the differential cross section  for the production of Y +Z consists of a direct part,
  , originating from single-parton interaction, and a double-parton interaction contribution,
  ,
,

where  and
and  correspond to the differential cross sections of processes Y and Z respectively and the symmetry factor m from equation (1) has been set equal to two.
After integrating the differential cross sections in equation (3) over the phase space defined by the selection cuts on the Y and Z systems as appropriate for the analysis and solving the equation for σeff,

With the exception of the direct component,  , for which theoretical input (for example in the form of a Monte Carlo (MC) event generator) needs to be employed, all quantities in equation (4) may be directly taken from data, provided that the simple factorization picture is applicable. This assumes that the proposed correlation in the DPDFs, the factor (1 − xi − xj) present in equation (2), is close to 1. There will be other effects which will eventually lead to a breakdown of this simple picture in some corners of phase space; for example total energy conservation, flavour conservation rules, or, more intricately, complicated interactions between the initial- or final-state partons [24, 37–40] which potentially correlate the two systems in a non-trivial way. However, for certain processes and selection cuts, such effects may turn out to be negligible. In the following, when referring to data and integrating over the hadronic final states,
  will be replaced by σ(s).
For the case of W + 2-jet production discussed in this paper, the cross sections at leading order are related to Feynman diagrams such as those depicted in figure 1. In general, calculations of the differential cross sections for the production of any system Y are inclusive. In particular, in the calculation of the leading-order W cross section, the production of additional jets is implicitly included. These extra jets may populate a phase space constrained from below by the factorization scale μF. In this study, in which jets are defined by a transverse momentum requirement of pT >20 GeV, this implies that the cross sections entering the calculation of σeff correspond to the production of a W boson with no accompanying jets, of a W boson accompanied by exactly two jets and a hadronic final state consisting of exclusive two jets.

Figure 1. Examples of leading-order Feynman diagrams for the direct (left) and double-parton interaction (right) components in the production of a W+ + 2-jet system. These contributions are defined in equation (3) with the identification Y →W+ and Z → 2 jets.
Download figure:
Standard image3. Strategy of the analysis
The cornerstone of the analysis is the extraction of the fraction of W + 2-jet events produced in pp interactions in which the jets originate from a hard DPI. This fraction is subsequently used to determine the value of σeff. The sample of W + 2-jet candidate events is selected from data recorded by the ATLAS detector with the W boson identified through its leptonic decays into eν and μν. The fraction f(D)DP, where the superscript D refers to detector level, of W + 2-jet events originating from DPI is defined by

where NW+2j is the total number of W + 2-jet events, NW2j is the number of events in which the production of the two jets is directly associated with the production of the W boson (single-parton interaction), and NW0j + 2jDPI is the number of events in which the production of the two jets originates from DPI. In order to extract f(D)DP, a minimization fit to the distribution of an observable is performed. The observable is chosen such that it shows good discriminating power between the direct production of a W boson with two jets (W2j) and the production of a W boson in association with zero jets in addition to another parton–parton scatter resulting in two jets (W0j + 2jDPI). The fit is performed to the normalized, detector-level, background-corrected data distribution of the observable using two normalized templates, denoted by A and B.
Template A represents the expected contribution to the distribution of the chosen observable from W2j events, and Template B that from W0j + 2jDPI events. The fit function is given by (1 − f(D)DP)·A + f(D)DP·B. The details of how the templates are constructed and how the fit is performed, together with supporting MC studies, are described in section 6. The relevant part of the equation defining σeff, equation (4), reads

Here, σW0j, σW0j + 2jDPI and σ2j are the production cross sections of W0j, W0j + 2jDPI and exclusive dijet (2j) events, respectively. These cross sections are related to the respective number of events N through the relation

where C denotes the corrections for unfolding to the particle level including reconstruction effects,  is the geometrical acceptance, ε is the trigger efficiency, and
  is the integrated luminosity. The assumption of factorization between the W boson and the 2j system leads to some simplifications. Firstly, the kinematics of the W boson does not influence the kinematic distributions of the DPI system, either at the detector level or at the hadron level, once corrections involving the impact of jets on W reconstruction and vice versa have been made. Secondly, the kinematics of the jets originating from DPI may be modelled by the kinematics of single-scatter dijet events. Therefore

Finally, the W0j + 2jDPI and W0j events are collected using the same trigger selection. Taken together, this results in luminosity and efficiency cancellations and σeff is given by

In a previous phenomenological study [10] it was suggested to use the transverse momentum of the W boson, pW T, as the key observable to distinguish double-parton scattering production of W + 2-jet events from the direct production channel. This observable suffers from experimental inaccuracies due to the fact that the kinematics of the W boson must be reconstructed from the missing transverse momentum, EmissT. Alternatively, one could try to use the pT distribution of the individual jets, but their discrimination power is limited by uncertainties stemming from the jet energy scale. This leaves correlations between the jets or between the jets and the kinematics of the W as further possibilities, one being the azimuthal correlation of the two leading jets in the transverse plane. In the picture of DPI production advocated here, the kinematics of the W boson and the dijet systems are decorrelated. Therefore, the momenta of the two jets must compensate each other in the transverse plane, orienting them back-to-back in azimuthal angle, rendering, in principle, this angular separation between the jets a useful observable. However, due to the distortion of this variable by various systematic effects, in particular multiple proton–proton interactions (pile-up) and the underlying event, in this analysis the balance in transverse momenta of the two jets is used instead, quantified by

where  and
and  are the transverse momentum vectors of the two leading jets. Anticipating a potentially large dependence of Δjets on the jet energy scale, another observable, the transverse momentum of the dijet system normalized by the sum of the individual transverse momenta, Δnjets, is constructed,

The distribution of Δnjets is employed to drive the fit from which f(D)DP is obtained, while the distribution of Δjets allows further checks.
4. The ATLAS detector
The ATLAS detector [36] comprises a superconducting solenoid surrounding the inner detector (ID), as well as electromagnetic and hadronic calorimeters and a large superconducting toroid magnet system instrumented with muon-detection chambers. The ID system is immersed in a 2 T axial magnetic field and provides tracking information for charged particles in a pseudorapidity range matched by the precise measurements of the electromagnetic calorimeter. The silicon pixel and microstrip tracking detectors cover the pseudorapidity1 range |η| < 2.5. The transition radiation tracker, which surrounds the silicon detectors, can perform tracking up to |η| = 2.0 and contributes to electron identification. The liquid-argon electromagnetic calorimeter is divided into one barrel (|η| < 1.475) and two end-cap components (1.375 < |η| < 3.2). It uses an accordion geometry to ensure fast and uniform response, and fine segmentation for optimum reconstruction and identification of electrons and photons. The iron/scintillator tile hadronic calorimeter consists of a barrel covering the region |η| < 1.0, and two extended barrels in the range 0.8 < |η| < 1.7. The muon spectrometer is based on three large superconducting toroids with coils arranged in an eight-fold symmetry around the calorimeters, covering a range of |η| < 2.7. Over most of this range, precision measurements of the track coordinates in the principal bending direction of the magnetic field are provided by monitored drift tubes. At large pseudorapidities (2.0 < |η| < 2.7), cathode strip chambers with higher granularity are used in the innermost station. The ATLAS detector has a three-level trigger system consisting of level-1, level-2 and the event filter (L1, L2 and EF). The L1 trigger rate at design luminosity is approximately 75 kHz. The L2 and EF triggers reduced the recorded event rate in 2010 to approximately 200 Hz.
5. Event selection
The dataset collected in 2010, corresponding to approximately 36 pb−1 of integrated luminosity, is used in this analysis. The rate of overlapping uncorrelated proton–proton interactions occurring within the same bunch crossing (also referred to as pile-up) gradually increased up an average of about two interactions per bunch-crossing throughout the data-taking period. The selection of W events is based on the leptonic W → eν and W → μν decay channels and follows the one already described in [41], where more details can be found. It differs in the requirements on the jet transverse momentum and rapidity. The objects required for the different samples and templates needed in the analysis were selected as described in the following.
To select electron candidates, clusters formed from energy depositions in the electromagnetic calorimeter are required with matched tracks in the ID, with the further requirement that the cluster shapes are consistent with electromagnetic showers initiated by electrons. Such electron candidates were required to have transverse momenta pℓT > 20 GeV and |η| < 2.47. Electrons reconstructed in the transition region between the barrel and end-cap calorimeters (1.37 < |η| < 1.52) or falling into inactive regions of the calorimeter were excluded. The standard isolation requirement on electron candidates [42] was applied to improve multi-jet background rejection.
Muon candidates were selected by requiring pℓT > 20 GeV and |η| < 2.4. They were reconstructed requiring both the muon spectrometer and the ID information. Additional requirements were applied to the number of hits used to reconstruct the track in the ID. Furthermore, the z-coordinate of the muon longitudinal impact parameter with respect to the interaction vertex was required to be less than 10 mm. A selection requirement was applied to the significance of the track transverse impact parameter to ensure that the muon was prompt. The standard isolation requirements were applied to the muons [43] to improve multi-jet background rejection.
To select events with a W boson, in addition to requiring exactly one lepton (e or μ) in the event, requirements were imposed on EmissT and the transverse mass, mT. The EmissT was calculated using the reconstructed physics objects, the remaining energy deposits in the calorimeter, and the ID tracking information. The mT is defined in terms of the missing transverse energy and the charged lepton transverse momentum as mT = [2pℓTEmissT(1 − cosΔϕℓ,EmissT)], where Δϕℓ,EmissT is the angle between the lepton transverse momentum and the missing transverse momentum. Events were required to have EmissT > 25 GeV and mT > 40 GeV .
Jets are defined using the anti-kt algorithm [44] with radius parameter R = 0.4. The jets were reconstructed from clusters built from calorimeter cells, initially not accounting for different calorimeter response to electrons and hadrons, and subsequently calibrated [45]. Jets were required to have pT > 20 GeV and |y| < 2.8. All jets within  of a selected electron or muon were removed from the analysis. The number of jets originating from pile-up interactions was reduced by applying a selection requirement on the jet-vertex fraction (JVF), which is defined for each jet in an event. After associating tracks to jets with a matching in ΔR(track, jet), requiring ΔR < 0.5, the JVF was computed for each jet as the scalar sum of the transverse momenta of all matched tracks from the interaction vertex divided by the total jet-matched track transverse momentum from all vertices. Jets were removed from the analysis if JVF < 0.75. This selection was not applied to jets that lie outside the acceptance of the ID or to those jets without matching tracks.
With these selections, the following samples have been constructed:
- W + 0-jet sample, consisting of events passing either the W → eν or W → μν selection and where no jets are found in addition to the W decay products;
- W + 2-jet sample, consisting of events passing either the W → eν or W → μν selection and where exactly two jets are found in addition to the W decay products;
- dijet sample, which consists of events recorded with exactly two jets. The selected events were taken using the Minimum Bias Trigger Scintillators and Zero Degree Calorimeters, which have been shown [46] to be unbiased and fully efficient for jet-based measurements. A subset of this sample with negligible pile-up, corresponding to the first 184 μb−1 of data taking, was used to calculate the N2j term described in equation (9).
6. Monte Carlo (MC) simulation
The treatment of MC simulation and background estimation is based on that described in [41]. The MC samples of events in this analysis were produced with CTEQ6L1 [49] parton distribution functions. The simulation of detector effects was performed with Geant4 [47]. These simulated event samples [48] were used for the background and signal estimates. They were reweighted such that they matched the data in the number of reconstructed vertices per event.
To simulate the W boson signal, samples of events were generated using Alpgen [50] with the MLM [51] matching scheme, interfaced with Herwig [52] v6.510 and Jimmy [53] v4.31 (AUET2 tune), together referred to as A + H + J samples. Sherpa [54] v1.3.1, with the CKKW [55] merging, and with the default underlying event tune, was also used to simulate W events.
MC generators populate the activity in a hard-scattering event with additional parton–parton scatters, the average number of which depends on the assumed lowest-pT threshold of additional soft partons and the available phase space. The extra scatters are commonly called multi-parton interactions (MPI). Some of the scattered partons will materialize as jets of hadrons above a certain pT threshold. Others will result in extra hadronic activity added to the original hard scattering in the event. In this analysis, a threshold on the pT of the scattered parton, pmaxT, is introduced, whose purpose is to separate these two classes of hard and soft scatters.
In the A + H + J simulation, a sample of events without DPI may be obtained by removing events with two or more additional 2 → 2 parton scatters with a parton-level pT above a preset pmaxT. In Sherpa, the MI_HANDLER switch is used to switch off the effects of DPI.
As for potential sources of physics background to the W signal, Pythia6 [56] was used to produce MC samples for the modelling of multi-jet and Z → ℓℓ physics contributions. Powheg [57] was used to model the  background contribution. MC@NLO [58] was used to provide MC samples for the modelling of single top quark and diboson contributions.
6.1. Sample composition
The contributions of electroweak backgrounds (Z → ℓℓ and diboson production), as well as W → τν,  and single top quark production to both channels are estimated using MC simulation. The absolute normalization is derived using the total theoretical cross sections and corrected using the acceptance and efficiency losses of the event selection. These backgrounds amount to about 5% of the selected events in the electron channel (dominated by the W → τν contribution), and about 8% in the muon channel (dominated by the Z → ℓℓ contribution). The contributions from non-physics backgrounds were considered to be negligible. The background contributions to the selected events can also come from multi-jet production processes in which a lepton is either produced through the decay of a hadron containing a heavy quark, the decay-in-flight of a light meson to a muon, or through a coincidence of hadronic signatures mimicking the characteristics of a lepton. The shape and normalization of the distribution of various observables in multi-jet backgrounds are determined using data-driven methods in both analysis channels. For the W → eν selection, the background shape is obtained by reversing certain requirements on shower shape in the calorimeter in the data selection procedure to produce a multi-jet enriched sample. Similarly, to estimate the multi-jet contribution to W → μν, the background shape is obtained from data by inverting the requirements on the muon impact parameter and its significance to produce a multi-jet enriched sample. These multi-jet-enriched samples give the shapes of the distributions of multi-jet background observables. Their normalization in the selected data sample is determined by fitting a linear combination of the multi-jet EmissT shape, and that for the leptonic contribution, to the observed EmissT distribution. The multi-jet background was thus estimated to contribute about 14% of the selected events in the electron channel and 6% in the muon channel in the selected W + 2-jet sample.
Figure 2 shows the distributions of the two key observables Δnjets and Δjets obtained in selected W + 2-jet events. The data are compared with the results from the Sherpa and A + H + J MC samples with their default MPI treatment, after adding the background contributions, which are also shown in the plots.
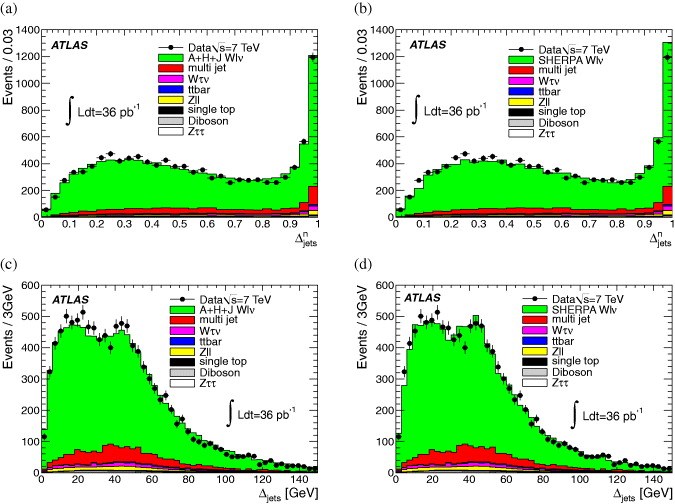
Figure 2. The (a), (b) Δnjets and (c), (d) Δjets distributions at detector level for events passing the W + 2-jet selection cuts. The distributions from data (dots) are compared with (a), (c) A + H + J and (b), (d) Sherpa signal MC (histogram) predictions. In addition, physics backgrounds, also shown, have been added in due proportion to the MC histogram.
Download figure:
Standard image6.2. Templates
The fit, from which f(D)DP is extracted, is performed by comparing the distribution of Δnjets at detector level in background-corrected data with two templates.
- Template A 'DPI-off'—normalized distribution of the discriminating variable for a sample in which the two jets originate from a primary scatter. The main sample for Template A was produced by A + H + J. To construct Template A, it is necessary to remove hard MPI candidate events from the generated sample. Relevant events contain the W boson as well as at least two outgoing partons, i.e., partons that stem from the hardest scatter, or that originate from a secondary scatter. Events containing two or more secondary partons above a defined cutoff scale, pmaxT = 15 GeV, are classified as DPI events and therefore rejected. The value of pmaxT and its impact on the analysis are further discussed in section 7.4.An alternative modelling of Template A was obtained using the Sherpa MC sample where MPI has been switched off altogether. This removes all secondary perturbative parton scatters, which effectively produce transverse momenta in the range pT > 3.5 GeV, but it retains the initial-state radiation off the incoming legs of the hard matrix element, the generation of intrinsic transverse momentum and the fragmentation of beam remnants.As an example, the distributions of Δnjets and Δjets for simulated W + 2-jet events are displayed in figure 3. These distributions were obtained from A + H + J, both inclusively and with DPI switched off (i.e. Template A). The distributions show sensitivity to the effect of double-parton scattering, especially at low values of Δnjets and Δjets.
- Template B 'DPI-only'—normalized distribution of the discriminating variable for a sample in which both jets originate from a DPI scatter. The dijet sample described in section 5 was used to approximate the DPI template. The fractional difference between the final results when using the dijet Pythia6 MC as Template B in place of dijet data was found to be well below the per cent level.
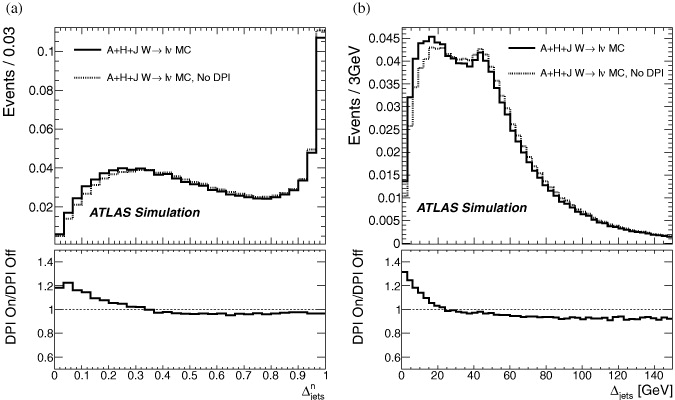
Figure 3. Comparison of the shapes of (a) Δnjets and (b) Δjets distributions, at detector level, for selected W → ℓν + 2-jet events as expected in A + H + J, with DPI on and off (Template A). The lower panels show the respective ratios of the DPI-on and DPI-off expectations.
Download figure:
Standard image7. Strategy validation
For the purpose of validation studies, the inclusive A + H + J sample was employed to mimic the data and its distribution was fitted as a combination of Templates A and B. As for the fits to the data distributions, Template A is based on the A + H + J sample with pmaxT = 15 GeV and Template B is based on the dijet data sample. The fitted value for f(MC)DP thus obtained, once corrected for pile-up effects, can be compared to the expected fraction of DPI directly extracted at the parton level from the event record of the A + H + J sample.
7.1. Double-parton interactions at detector level in the MC simulation
The fit of the combination of Templates A and B to the nominal A + H + J Δnjets distribution yields

In the fit to the distribution of Δnjets, events with Δnjets > 0.93 (corresponding to the last two bins of the fit) were ignored, since they represent configurations with two nearly parallel jets and therefore rather test the parton shower model. The fit minimization, when performed to the Δjets instead of the Δnjets distribution, resulted in a value f(MC)DP(Δjets) that was within 13% of f(MC)DP(Δnjets). The resulting description of the distributions in Δnjets and Δjets by the combination of the Templates A and B, using f(MC)DP(Δnjets), are shown in figure 4.
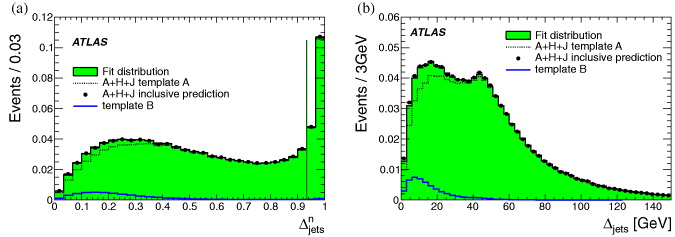
Figure 4. Distribution of (a) Δnjets and (b) Δjets in the inclusive A + H + J pseudo-data (dots) compared to the results of fitting Δnjets by a linear combination of Template A (dashed line) extracted from this sample and of Template B obtained from the dijet data (blue solid line). The result is shown as the green histogram. The bins to the right of the vertical dash-dotted line were excluded from the fit. The pseudo-data and the overall fit have been normalized to unity, Template A to 1 − f(MC)DP(Δnjets) and Template B to f(MC)DP(Δnjets).
Download figure:
Standard image7.2. Influence of pile-up
In order to account for the influence of pile-up, the extraction of f(MC)DP was repeated after selecting only events with the requirement of exactly one reconstructed vertex, imposed on both the inclusive A + H + J sample and Template A. A subset of dijet events from earlier data-taking periods, where the effects of pile-up were smaller, was used to model Template B. In this way, the fitted value of f(MC)DP represents the DPI rate that would be extracted in the absence of pile-up. The result is

which is in good agreement with that obtained from a fit to the Δjets distribution. The ratio, rpile-up, of the f(MC)DP value with the one-vertex requirement to that without the requirement, without accounting for the effect of correlations2, is rpile-up = 1.17 ± 0.15(stat.). A direct extraction of f(D)DP using only single pp interactions is not possible due to the small numbers of events in the data. For this reason, the ratio is used to correct f(D)DP to the result that would have been obtained in the case of single interactions. The statistical uncertainty on rpile-up is duly propagated as a systematic uncertainty whenever appropriate.
7.3. Transition from detector level to parton level
An important question, central to this analysis, is whether the σeff extracted at detector level can be related to the same quantity at the parton level. This is relevant because the value of σeff used in theoretical applications is typically defined at parton level only. This question can be translated into how close the DPI rate at parton level, f(P)DP, is to the extracted DPI rate at detector level in the MC samples, f(MC)DP. The parton-level DPI fraction is defined as

where the various NP are the number of corresponding events at parton level. Here, the jets are directly identified with outgoing partons, with a fiducial acceptance chosen such that it matches that of the jets at detector level,

where ℓ denotes charged leptons and P the partons, as recorded at the generator level. The parton-level counting of the quantities NP(W0j + 2jDPI) and NP(W2j) was performed in the inclusive A + H + J MC sample after selection of W + 2-jet events, and yielded

which is within 10% of the equivalent quantity at detector level, f(MC)DP.
7.4. Effect of pmaxT value
There could be sizable differences between the DPI-off samples provided by A + H + J and Sherpa. The origin of these differences has been identified as the difference in the extent to which softer MPI, at scales below the dijet transverse momenta, are included in the samples. In Sherpa, the only option is to switch off all such secondary interactions, while in A + H + J this can be steered through the pmaxT cut. In the A + H + J samples, events are removed from the inclusive sample if the pT in secondary parton–parton scatters is above pmaxT = 15 GeV. All softer MPI scatters are left in the sample. In contrast, in the DPI-off Sherpa sample, all secondary parton scatters are switched off, corresponding roughly to a pmaxT ≈ 3.5 GeV. To see how closely the two models can agree, pmaxT in A + H + J was reduced to 3.5 GeV. Despite intrinsic differences in the MPI modelling, this choice replicates the Sherpa results to within 10%, as is discussed in section 7.5.1.
In this particular analysis, it is desirable to include these soft MPI partons in both templates. In Template B they are present by default, and in Template A they must also be allowed as they do form a contribution to the direct production of W + 2-jet events in nature, which Template A is set up to model. However, there is also an upper constraint on this threshold, since W0j + 2jDPI events where the jets have pT above 20 GeV should not enter Template A. To determine the optimal pmaxT, alternative predictions for Template A with different pmaxT values were constructed from the inclusive A + H + J sample. Fits to Δnjets distributions with different values of pmaxT in the A + H + J sample forming Template A were obtained. At low pmaxT values, ⩽7.5 GeV, the fits do not show good agreement with the A + H + J distribution, since then partons from soft MPI are removed in Template A and the hard jets become more correlated. This leads to an underestimation of f(MC)DP. Conversely, at high pmaxT, genuine W0 + 2jDPI events are not removed when constructing Template A, also leading to an underestimation of the extracted f(MC)DP. These two competing effects are visible in figure 5, which shows f(MC)DP extracted as pmaxT is varied, along with the value of f(P)DP, as defined in equation (16). Therefore, the fit with the best agreement between f(P)DP and f(MC)DP determines the value of pmaxT = 15 GeV chosen as default for the construction of Template A in this analysis. In this case, the value of f(P)DP, as defined in equation (16) (and indicated by the dotted line in figure 5), is within 10% of the value f(MC)DP(Δnjets) = 0.059 ± 0.007 obtained from the templates fit. This implies that, when using the optimal pmaxT derived above, the value of f(MC)DP (and therefore f(D)DP) can be regarded as a measurement at the parton level with an associated 10% uncertainty.
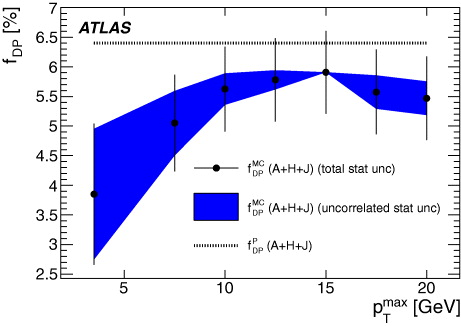
Figure 5. Variation of the extracted fraction of double-parton scattering from the Δnjets distribution in the A + H + J MC simulation, f(MC)DP (black points), as a function of the transverse momentum cut imposed on the scattered partons, pmaxT. The band illustrates the statistical component of the uncertainty of f(MC)DP, relative to the reference sample with pmaxT = 15 GeV, estimated by subtracting the statistical uncertainty of the reference sample in quadrature. The value, f(P)DP, of the fraction of double-parton scattering obtained directly at the parton level (see equation (16)) is also shown as a dashed line.
Download figure:
Standard image7.5. Model dependence of Template A
The effect of generator modelling is found by comparing the results for f(MC)DP, when Sherpa is used to provide Template A, f(S)DP, rather than A + H + J, f(AHJ)DP. In this case for the A + H + J sample, the pmaxT parameter was set to 3.5 GeV to keep the samples comparable. The results of these fits, after applying the pile-up correction rpile-up, are f(S)DP = 0.031 ± 0.008 and f(AHJ)DP = 0.034 ± 0.006. The quoted uncertainties are statistical and correlated between the two. However, the difference is smaller than either of the uncertainties and thus the results are consistent. The results of the two fits to the inclusive A + H + J sample are shown in figure 6.
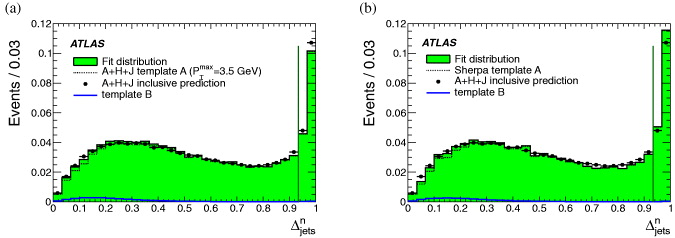
Figure 6. Distribution of Δnjets in the inclusive A + H + J pseudo-data (dots). (a) A + H + J with pmaxT = 3.5 GeV and (b) Sherpa were used to provide Template A. Other details are as in the caption to figure 4.
Download figure:
Standard image7.5.1. Extraction of f(D)DP
Turning now to the data itself, the backgrounds are subtracted using the MC and data-driven estimates of section 6.1. The parameter f(D)DP was extracted from a fit to the distribution of Δnjets in the data sample of W + 2-jet events after this physics background subtraction. After applying the pile-up correction rpile-up, this yields

with χ2/Ndof = 37/28. The result quoted above is in good agreement with the result of a fit to the distribution of Δjets. The resulting distributions obtained with f(D)DP(Δnjets) are shown in figure 7.

Figure 7. Distribution of (a) Δnjets and (b) Δjets in the background-subtracted data (dots) compared to the result from the best fit for f(D)DP(Δnjets). The result is shown as the green histogram. In (a), the bins to the right of the vertical dash-dotted line were excluded from the fit. Data and the overall fit have been normalized to unity, Template A (dashed line) to 1 − f(D)DP(Δnjets) and Template B (blue solid line) to f(D)DP(Δnjets).
Download figure:
Standard imageThe systematic uncertainties on this extracted value of f(D)DP are discussed in the following.
7.5.2. Theoretical uncertainty
The uncertainty due to generator modelling is estimated by comparing the results for f(S)DP with f(AHJ)DP. To be conservative, the statistical uncertainty on f(S)DP is propagated as a symmetric systematic uncertainty on f(D)DP due to the modelling. An additional uncertainty is due to the choice of pmaxT. The systematic uncertainty due to the variation of this value is obtained by demanding that f(MC)DP and f(P)DP are consistent within statistical uncertainties. From figure 5, upward and downward variations of pmaxT by 2.5 and 5 GeV, respectively, are deduced. The value of pmaxT was varied by these two amounts, resulting in a variation in f(MC)DP of 0.003. The two uncertainties discussed above were added in quadrature to estimate the total theoretical uncertainty of 0.004.
7.5.3. Jet energy scale and resolution
The overall impact of the jet energy scale on f(D)DP was determined by shifting the jet energy upwards and downwards in the MC samples by the jet energy scale uncertainty [46] and repeating the fit. The variations were found to be +0.009 and −0.008, respectively. The larger of these two was symmetrized to provide the systematic uncertainty on f(D)DP due to that on the jet energy scale. Similarly, the overall impact of the jet energy resolution on f(D)DP was determined by degrading the jet energy resolution in the MC samples by the jet energy resolution uncertainty, and re-performing the fit. The variation in f(D)DP in this case, assumed to be symmetric, was found to be 0.005.
7.5.4. Physics backgrounds and lepton response
The impact of both physics background modelling and lepton response was considered via a direct comparison of f(D)DP obtained separately in the W → eν and W → μν channels. Half of the obtained difference, which was at the sub-per cent level, was taken as a measure of the associated uncertainty. The uncertainty associated with background subtraction was also determined by varying the background normalization and shape. The multi-jet background shape was varied in both channels by using MC instead of data-driven methods to estimate it, with no reversal of cuts. The shift in f(D)DP in this case was −0.001. The normalization of the multi-jet background was varied in the W → eν channel by taking the relative normalization of the background contribution from two independent methods of background estimation—this led to a relative variation of about 50%. For the W → μν channel, in which multi-jet background is better understood, a fractional shift of 20% was assumed in the background normalization. The shift in f(D)DP when the multi-jet background normalization was increased was found to be +0.008. The uncertainty associated with the normalization of electroweak and top backgrounds was evaluated by increasing the predicted cross sections of these processes by their theoretical uncertainty of 5% [41], resulting in a +0.001 variation in f(D)DP. Symmetrizing and then adding these uncertainties in quadrature yields the total uncertainty due to physics backgrounds and lepton response on f(D)DP of 0.008.
7.5.5. Pile-up
The systematic uncertainty due to this effect was evaluated by propagating the statistical uncertainty on the pile-up correction, rpile-up, as determined in section 7.2, resulting in an uncertainty on f(D)DP of 0.010.
7.5.6. Impact of W + 1 jet
It was verified that the contribution of W + 1-jet configurations from the hardest scatter supplemented with a single jet from a secondary scatter formed a negligible contribution to the DPI rate at parton level, as well as in the modelling of Template A.
The individual contributions to the systematic uncertainty on f(D)DP are summarized in table 1. The contributions are added in quadrature, yielding

Table 1. Summary of the fractional uncertainties on f(D)DP.
| Systematic source | Uncertainty (%) |
|---|---|
| Theory | 10 |
| Pile-up | 13 |
| Jet energy scale | 12 |
| Jet energy resolution | 8 |
| Background modelling and lepton response | 11 |
| Total systematic | 24 |
| Total statistical | 17 |
The extracted value of f(D)DP is consistent with the value of f(MC)DP extracted in section 7, within the quoted uncertainties and hence with f(P)DP at the parton level, as discussed in section 7.3. This implies that the MC models studied in the analysis describe the rate and kinematics of the DPI contribution well.
8. Hadron-level studies
Since σeff and f(P)DP are intrinsically parton-level quantities, they are not directly observable. Conversely, f(D)DP contains residual dependencies on detector resolutions and efficiencies. This renders a direct comparison with theoretical models impossible. To allow the results of this study to be used for comparisons with MPI models in the future, the key distributions have been corrected for detector effects to the final-state hadron level. The hadron-level requirements mirror the selection described in section 5, except that cuts were applied to hadron-level quantities in MC simulation. Hadron-level jets were constructed by running the same jet finder as for the detector level, using all final-state hadron-level particles with lifetimes longer than 30 ps as input, with the neutrinos and the charged leptons originating from the decay of the W bosons being excluded. Jets were defined with the anti-kt algorithm with pT > 20 GeV, |y| < 2.8 and R = 0.4. In addition, jets within a distance of ΔR = 0.5 from the leptons were removed. Dijet events were required to contain exactly two jets, reconstructed using the same algorithm, input objects and kinematic selection as already described. The Δnjets and Δjets distributions in W + 2-jet data unfolded to the hadron level are shown in figure 8. The background-subtracted data has been corrected, using a Bayesian unfolding algorithm, to the hadron level using the RooUnfold package [59]. The response matrix used to unfold the data was trained on A + H + J predictions and two iterations were used to converge to the unfolded distributions, resulting in a smoother distribution than that seen at detector level. The unfolded results are compared with both A + H + J and Sherpa MC predictions directly obtained at hadron level.
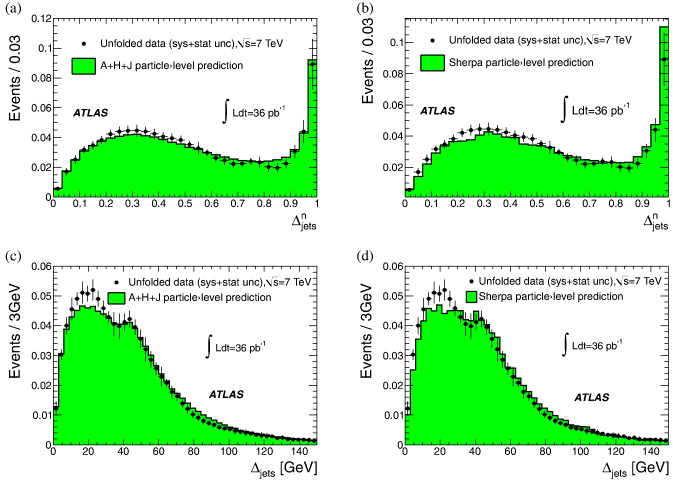
Figure 8. Distributions of (a), (b) Δnjets and (c), (d) Δjets in the data after unfolding to hadron level (dots) compared to MC expectations from (a), (c) A + H + J and (b), (d) Sherpa at the hadron level (green histogram). The error bars represent the quadrature sum of systematic and statistical uncertainties on each bin, and both histograms have been normalized to unity.
Download figure:
Standard imageThe systematic uncertainties on the Δnjets and Δjets distributions were obtained by repeating the studies outlined in section 7.5.1 with the exception of pile-up uncertainty. The latter was estimated by comparing the background-subtracted, corrected data distributions measured at hadron level with that obtained when rejecting all events other than those with exactly one primary vertex selected as described in section 5. The uncertainty due to the unfolding procedure itself was estimated as the shift in the corrected data distribution when Sherpa instead of A + H + J was used to train the response matrix. The overall uncertainty on the unfolded distribution was found, per bin of the distribution, by a quadrature sum of the uncertainties described above and is dominated by the pile-up uncertainty. For completeness, the unfolded Δnjets and Δjets distributions are compared with a linear combination of Template A from A + H + J and Template B from Pythia6, both at the hadron level, in proportions determined by the value of f(D)DP, as shown in figure 9. Perfect agreement between f(D)DP and its hadron-level equivalent is not expected as the phase space at hadron level, covered by the W + 2-jet sample at detector level used for the determination of f(D)DP, is not exactly the same as for the unfolded distribution. The value of f(D)DP determined directly via a fit at the hadron level was found to be within 10% of the value determined at detector level.

Figure 9. Distributions of (a) Δnjets and (b) Δjets in the data after unfolding to hadron level (dots) compared to the results of a linear combination with f(D)DP (green histogram) of Template A extracted from A + H + J hadron-level simulation (dashed line) and of Template B obtained from the Pythia6 hadron-level simulation (solid blue line). The error bars on the data represent the quadrature sum of the statistical and systematic uncertainties. Data and the overall fit have been normalized to unity, Template A to 1 − f(D)DP(Δnjets) and Template B to f(D)DP(Δnjets).
Download figure:
Standard image8.1. Determination of σeff
The value of σeff is related to f(D)DP through equation (9). The additional input of the exclusivity ratio, NW0j/NW+2j = 23, is evaluated from the event yields in the selected W + 2-jet and W + 0-jet samples. The associated statistical uncertainty is at the 2% level. Additionally, the number of dijet events N2j = 9488 is obtained from the event yield in the early period of 2010 data taking, corresponding to an integrated luminosity of  . In this period of data taking, the trigger selection for dijet events was measured to be fully efficient (ε2j = 1) [46]. A further correction to N2j was made for lepton–jet overlap removal, which was applied to the jets when constructing Template A but not in Template B. It was evaluated by applying overlap removal for jets in Template B, giving a correction factor of 0.96.
The systematic uncertainties are summarized in table 2, with the following breakdown of their origins:
- The uncertainties on f(D)DP—determined in section 7.5.1—are propagated asymmetrically to σeff.
- Physics backgrounds and response to leptons—the impact of the lepton energy response and background normalization uncertainties were considered by propagating the uncertainty on f(D)DP obtained for this effect. In addition, the impact of lepton scale and the background normalization uncertainties on the exclusivity ratio, NW0j/NW+2j, were included.
- Acceptance and response cancellation—equation (8) is the result of factorization which implies that the kinematics of the lepton and DPI system are not correlated, either in terms of geometrical acceptance or through detector response. Apart from the effect of lepton–jet overlap removal, which was discussed above, various sources of uncertainty on this assumption were considered and found to be negligible.
Table 2. Summary of fractional systematic uncertainties on σeff.
| Systematic source | Uncertainty (%) |
|---|---|
| f(D)DP | 24 |
| Background and lepton response | 5 |
| Luminosity | 3 |
| Total systematic | +33−20 |
| Total statistical | 17 |
The above leads to a measured central value of

Assuming factorization, this value of σeff is consistent with values previously measured in other experiments at lower centre-of-mass [15–19], as can be seen in figure 10.
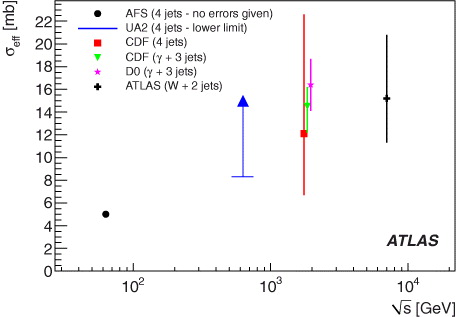
Figure 10. The centre-of-mass energy,  , dependence of σeff extracted in different processes in different experiments. An offset has been applied to the 1.8 TeV data points in order to distinguish them. The error bars on the data points represent the statistical and systematic uncertainties added in quadrature.
Download figure:
Standard image9. Conclusions
The double-parton interaction rate f(D)DP in events with a W boson and exactly two jets in the final state has been extracted in pp collisions at a centre-of-mass energy of  using data corresponding to an integrated luminosity of 36 pb−1. For jets with transverse momentum pT > 20 GeV and rapidity |y| < 2.8, in the ATLAS detector at the LHC, a central value of

is obtained. In terms of measured rate and kinematics of the dijet system there is good agreement with the predictions of the MC models studied in the analysis. The result for f(D)DP is used to extract the parameter σeff through the production of W + 2-jet events. The value extracted from data is

This value is consistent with values previously measured in other experiments at lower centre-of-mass energies.
Acknowledgments
We thank CERN for the very successful operation of the LHC, as well as the support staff from our institutions without whom ATLAS could not be operated efficiently. We acknowledge the support of ANPCyT, Argentina; YerPhI, Armenia; ARC, Australia; BMWF and FWF, Austria; ANAS, Azerbaijan; SSTC, Belarus; CNPq and FAPESP, Brazil; NSERC, NRC and CFI, Canada; CERN; CONICYT, Chile; CAS, MOST and NSFC, China; COLCIENCIAS, Colombia; MSMT CR, MPO CR and VSC CR, Czech Republic; DNRF, DNSRC and Lundbeck Foundation, Denmark; EPLANET, ERC and NSRF, European Union; IN2P3-CNRS, CEA-DSM/IRFU, France; GNSF, Georgia; BMBF, DFG, HGF, MPG and AvH Foundation, Germany; GSRT and NSRF, Greece; ISF, MINERVA, GIF, DIP and Benoziyo Center, Israel; INFN, Italy; MEXT and JSPS, Japan; CNRST, Morocco; FOM and NWO, Netherlands; BRF and RCN, Norway; MNiSW, Poland; GRICES and FCT, Portugal; MERYS (MECTS), Romania; MES of Russia and ROSATOM, Russian Federation; JINR; MSTD, Serbia; MSSR, Slovakia; ARRS and MVZT, Slovenia; DST/NRF, South Africa; MICINN, Spain; SRC and Wallenberg Foundation, Sweden; SER, SNSF and Cantons of Bern and Geneva, Switzerland; NSC, Taiwan; TAEK, Turkey; STFC, the Royal Society and Leverhulme Trust, UK; DOE and NSF, USA. The crucial computing support from all WLCG partners is acknowledged gratefully, in particular from CERN and the ATLAS Tier-1 facilities at TRIUMF (Canada), NDGF (Denmark, Norway, Sweden), CC-IN2P3 (France), KIT/GridKA (Germany), INFN-CNAF (Italy), NL-T1 (Netherlands), PIC (Spain), ASGC (Taiwan), RAL (UK) and BNL (USA) and in the Tier-2 facilities worldwide.
Footnotes
- 1
ATLAS uses a right-handed coordinate system with its origin at the nominal interaction point (IP) in the centre of the detector and the z-axis along the beam pipe. The x-axis points from the IP to the centre of the LHC ring, and the y-axis points upward. Cylindrical coordinates (r,ϕ) are used in the transverse plane, ϕ being the azimuthal angle around the beam pipe. The pseudorapidity is defined in terms of the polar angle θ as η = −ln tan(θ/2). The rapidity of a particle with respect to the beam axis is defined as
 .
. - 2
The impact of including the correlations is estimated to result in a maximum reduction of the statistical uncertainty on rpile-up to 0.12.
