


Abstract
This study proposes an integrated approach, framed in the emerging fields of network physiology and information dynamics, for the quantitative analysis of brain–heart interaction networks during sleep. With this approach, the time series of cardiac vagal autonomic activity and brain wave activities measured respectively as the normalized high frequency component of heart rate variability and the EEG power in the δ, θ, α, σ, and β bands, are considered as realizations of the stochastic processes describing the dynamics of the heart system and of different brain sub-systems. Entropy-based measures are exploited to quantify the predictive information carried by each (sub)system, and to dissect this information into a part actively stored in the system and a part transferred to it from the other connected systems. The application of this approach to polysomnographic recordings of ten healthy subjects led us to identify a structured network of sleep brain–brain and brain–heart interactions, with the node described by the β EEG power acting as a hub which conveys the largest amount of information flowing between the heart and brain nodes. This network was found to be sustained mostly by the transitions across different sleep stages, as the information transfer was weaker during specific stages than during the whole night, and vanished progressively when moving from light sleep to deep sleep and to REM sleep.
Export citation and abstract BibTeX RIS

Content from this work may be used under the terms of the Creative Commons Attribution 3.0 licence. Any further distribution of this work must maintain attribution to the author(s) and the title of the work, journal citation and DOI.
1. Introduction
Physiological systems under neural regulation, such as the cerebral, cardiac, circulatory, and respiratory systems, exhibit degrees of activity and interactivity which transiently change over time under different physiological states. A condition in which the interplay between different physiological systems is particularly evident is sleep. Indeed, it is well known that sleep modulates the activity of a variety of physiological systems, including the motor, cardiac, vascular, respiratory, and cerebral ones [1–6]. This is clearly shown by the physiological changes in motor control, blood pressure, heart rate, respiratory activity and EEG activity documented during sleep in healthy subjects. Stage organization of sleep also reflects modulations of the activity of the autonomic nervous system (ANS), with non-rapid eye movement (NREM) sleep associated with reduced sympathetic ANS activity and enhanced parasympathetic ANS activity, and REM sleep associated with irregular activation and deactivation of these functions [1]. Moreover, a strong interaction between autonomic cardiac activity and delta wave activity in the EEG has been documented [3, 7, 8].
Physiological interactions are commonly probed noninvasively by extracting information from the analyzed systems in the form of time series data, and then applying time series analysis methods in an attempt to elucidate the underlying mechanisms. Many studies in the literature provide strong evidence for the existence of a relation between the properties of biomedical time series and physiological function, although such evidence comes mostly from the analysis of dynamics within a single system (e.g. variability of the heart rate, activity and connectivity within the brain [9, 10]) or at most between two systems (e.g. cardiovascular, cardiorespiratory or brain–heart interactions [3, 11]). More recently, a system-wide integrative approach to the analysis of multiple time series measured from diverse systems has been introduced, paving the road to the development of the novel field of network physiology [12, 13]. With this approach, new information that could not be obtained from the study of individual systems was uncovered from the study of networks of the physiological systems [12]. Moreover, since each physiological system is itself composed of many interacting subsystems, the framework can be extended to the analysis of physiologic networks [13]. Overall, this view emphasizes the importance of looking at physiological interactions by considering each physiological system not only as an isolated network of regulatory subsystems, but also as a part of a broader network where diverse systems are closely connected with each other.
Nevertheless, identifying networks comprised of different interacting physiological systems, each with its own internal dynamics, is a considerable challenge that requires the development of methodological approaches that are able to tackle the complexity of the involved systems and to describe the different aspects of network activity and connectivity. For this reason, traditional time and frequency domain methods for time series analysis, though widely used, e.g. in the study of brain connectivity or cardiovascular interactions [10, 14], may not suffice to fully describe the time- and state-dependent changes in the architecture of complex physiological networks. The present study introduces a novel information domain approach for the description of physiological networks, framed in the emerging field of information dynamics [15]. Through the computation of entropy-based measures, the approach allows the decomposition of the information content of each studied system into amounts of information actively stored in the system, and transferred to it from the other systems in the network. The method is applied to the analysis of physiological networks describing sleep-related oscillations of the cardiac parasympathetic activity and the amplitude of several brain waves, performed on whole-night polysomnographic recordings acquired from healthy subjects. We show that the approach detects significant amounts of information stored in the heart and brain systems, as well as information transferred among these systems, and identifies a structured network of brain–brain and brain–heart interactions that is peculiar to the transitions across light sleep, deep sleep, and REM sleep.
2. Methods
2.1. Subjects and experimental protocol
Ten healthy young males (18–23 years old), with no current or previous somatic, psychiatric or sleep pathologies, and reporting a regular sleep–wake schedule, were considered for the study. Each subject stayed in the sleep unit and the first night was free of monitoring to allow adaption to the sleep unit. Full polysomnography was performed during the second night to exclude sleep pathologies and allow further adaptation. Then, monitoring was performed for two further consecutive nights without measurement of respiratory and leg movements, in order to not disturb sleep. Subjects were not allowed to sleep during the day, were asked to retire around 23:00, and were allowed to wake spontaneously in the morning.
During the analyzed night, polysomnography was recorded through a digital polygraph (Brainnet, Medatec, Brussels) acquiring electro-oculograms, submental electromyogram, three EEG channels (Fz-Ax, Cz-Ax, Oz-Ax, with Ax mastoid reference), and ECG activity. Signals were amplified, filtered, rectified and integrated to obtain an appropriate voltage, in accordance with the requirements of sleep stage determination, spectral analysis and heart rate variability measurement. For subsequent analysis, the EEG was stored at 100 Hz and the ECG at 200 Hz. A detailed description of the polysomnography protocol is reported in [3].
2.2. Data analysis and time series measurement
Sleep stage determination was performed in accordance with traditional classification criteria [16]. Each 20 s epoch of the Cz-Ax EEG derivation was visually scored as wake stage, sleep stage 1, 2, 3, or 4, or REM sleep. Stages 1–4 were classified as NREM sleep (1–2: light sleep; 3–4: deep sleep). EEG analysis was performed in the frequency domain by applying a fast Fourier transform to each consecutive 5 s window of the Cz-Ax signal. The spectrum power was evaluated inside the five conventional frequency bands (δ: 0.5–3 Hz; θ: 3–8 Hz; α: 8–12 Hz; σ: 12–16 Hz; β: 16–25 Hz) and then averaged every 60 s. The time series obtained from the brain system were the EEG power components expressed in normalized units (i.e. obtained as the ratio between the power value in each specific band and the full night mean power value in that band [17]).
The measurement of heart rate variability was performed according to a previously validated procedure [3]. Briefly, after upsampling the ECG to 400 Hz to improve the detection accuracy of the R peak, QRS complexes were automatically detected and RR intervals were measured as the time differences between consecutive R peaks. After the detection and correction of artifacts and ectopic beats, the RR interval series were interpolated and resampled regularly at 8 Hz; then, power spectral analysis was performed according to validated recommendations [9]. Spectral analysis was performed on consecutive windows of 120 s, overlapped by half. The time series obtained from the heart system was the power of the RR interval spectrum computed inside the high-frequency band (HF, 0.15–0.4 Hz), normalized to the total power in the range 0.04–0.4 Hz [3, 9]. An example of the heart and brain time series measured for a representative subject is shown in figure 1.
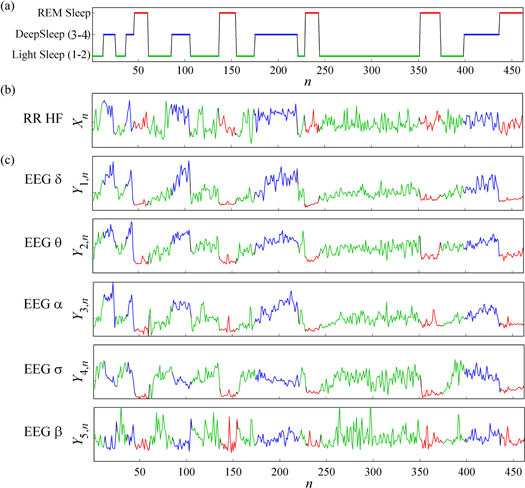
Figure 1. Example of brain and heart time series synchronously measured every 60 s during whole night polysmnography. (a) Sleep stage classification, evidencing periods of NREM sleep (light sleep: green; deep sleep: blue) and REM sleep (red); sleep arousals are not shown because their duration was always lower than the 60 s time scale. (b) Descriptive time series for the heart system X, quantifying the evolution over time of the normalized HF power of the cardiac RR interval. (c) Descriptive time series for the brain system Y, quantifying the evolution over time of the normalized EEG power within the δ, θ, α, σ and β bands. The six time series are synchronously measured every 60 s. Portions relevant to the different sleep stages are color coded according to (a).
Download figure:
Standard image High-resolution image2.3. Information domain analysis
The proposed time series analysis approach is based on the consideration of the physiological time series measured for each subject as realizations of stochastic processes descriptive of the behavior of a composite dynamical system. Specifically, we consider the overall observed physiological system S = {X, Y}, composed of the heart system X and the brain system Y. The states visited over time by system X are described by the stochastic process X, measuring the normalized HF variability of the cardiac RR interval. System Y is thought of as being composed of five subsystems described by the set of processes Y = {Yk, k = 1,...,5}, with each constituent process Yk measuring the normalized amplitude of a specific EEG wave (respectively δ, θ, α, σ, and β). Moreover, we denote Xn and Yk,n as the scalar random variables obtained by sampling the processes at the present time n, and Xn− = [Xn−1 Xn−2 ···] and Yk,n− = [Yk, n−1 Yk, n−2 ···] as the (infinite dimensional) vector variables describing the whole past of each system. In accordance with this representation, in the following we present an information–theoretic approach for the study of the dynamical dependencies of interacting processes in the brain–heart network.
Following the general analysis framework proposed in [18], the global dynamical information carried by the composite system S can be characterized by means of the multi-information measure MS = PX + PY, where PX and PY quantify the predictive information about the heart system and the brain system, respectively. The system predictive information quantifies the amount of information carried by the variable describing the present state of each system (Xn or Yk,n) that is explained by the set of the past states of the overall system (described by the vector variable Sn− = [Xn−⊕Yn−], with Yn− = [Y1,n−⊕···⊕Y5,n−]; ⊕ denotes vector concatenation). The predictive information about X and Y is defined as
where H(·) and H(·|·) denote respectively entropy and conditional entropy, and I(·;·) denotes mutual information. The quantities in (1) can be conveniently decomposed, exploiting the chain rule for conditional entropy [19], into a sum of contributions that put in evidence the physiologically relevant elements of information dynamics. In particular, predictive information about the heart system can be expressed as
where SX = I(Xn;Xn−) is a measure of the information storage [20, 21] in the heart system, and TY→X = I(Xn;Yn−|Xn−) quantifies the information transfer [22] from the brain system to the heart system. The overall brain-to-heart information transfer TY→X can be further expanded, with reference to the specific brain rhythm identified by the process Yk, as
where  = I(Xn;Yk,n−|Xn−) measures the information transfer from the kth brain subsystem to the heart system, and
  = I(Xn;Yn−\⊂Yk,n−|Xn−⊕Yk,n−) quantifies the contribution to the predictive information of the heart system brought by all of the remaining brain subsystems (\⊂ denotes subtraction from a set). In a similar way, the predictive information about the kth brain subsystem can be expressed as
where SYk = I(Yk,n;Yk,n−) measures the information stored in the kth brain subsystem,  = I(Yk,n;Xn−|Yk,n−) measures the information transfer from the heart system to the kth brain subsystem, and
  = I(Yk,n;Yn−\⊂Yk,n−|Xn−⊕Yk,n−) reflects the brain internal dynamics towards the kth subsystem (i.e. the transfer to the kth subsystem from all other subsystems).
While the decompositions in (2, 3) and in (4) are useful to explain how the system predictive information is expressed in terms of contributions from the constituents of the overall system, they do not put in evidence the direct transfer of information between pairs of subsystems within the observed network, i.e. the transfer not mediated by any of the remaining subsystems. The direct transfer is useful to infer the structure of the network of interacting processes. It is computed between two processes Si and Sj, taken as descriptives of single components of the overall system S = {S1,...,S6} = {X, Y1,...,Y5}, by means of the partial transfer entropy measure [23]
In the network representation, we identify links of the so-called brain–brain subnetwork when D is computed between two elements of the brain system Y (i.e.  , i, j = 1,...,5, i≠j), and links of the so-called brain–heart subnetwork when D is computed involving the heart system X (i.e.
  or
or  , k = 1,...,5).
2.4. Estimation approach
All of the measures of information dynamics presented in the previous subsection can be expressed as the difference between entropy terms or, equivalently, as (conditional) mutual information terms. Hence, the practical application of the proposed analysis framework presupposes the adoption of reliable estimates of conditional mutual information. While non-parametric methods may be recommended in the presence of relevant nonlinear effects [24–26], these methods are difficult to implement in practice. Especially in this study, the necessity to estimate entropies of high-dimensional vector variables starting from short data sets might make the utilization of model-free approaches unfeasible. For this reason, and for the sake of computational load, in this work we exploited the close connection between information theory and predictability, whereby conditional entropy is related to the error probability of a regression model [19, 27], and conditional mutual information—being the difference between two conditional entropies—is related to the ratio between the error probabilities of two regression models. In particular, the mutual information between the generic scalar variable Z and the vector variable V conditioned to the vector variable W can be expressed as

where Σ(Z|W) and Σ(Z|V⊕W) are the variances of the prediction errors resulting from a regression of Z on W and on V⊕W, respectively. Therefore, the predictive information, as well as each information storage or transfer term, can be computed as in (6) letting Z be the variable associated to the present state of the observed system (i.e. Xn or Yk,n, k = 1,...,5), and letting V and W be the vector variables associated to the considered past system states (i.e. a proper combination of Xn− and Yk,n−); in the computation of predictive information and information storage where the first entropy term is not conditioned, W is the empty vector so that (6) reduces to the mutual information I(Z;V), with Σ(Z) denoting the variance of Z.
In this study we used linear prediction models, so that the generic prediction error variance Σ(Z|W) is the variance of a linear regression of Z on W. This allowed us to compute the prediction error variance exclusively in terms of variances and covariance matrices as [28]

where Σ(Z), Σ(W) and Σ(Z, W) denote the variance of Z, the covariance matrix of W and the cross-covariance matrix between Z and W, respectively. For practical computation, the infinite dimensional vectors descriptive of the past system states were truncated at dimension p. When X is the observed system, this means that a linear regression of Xn on a proper concatenation of Xnp = [Xn−1···Xn−p] and  = [Yk,n−1···Yk,n−p] was performed to compute the conditional entropy. When the observed system is one of the Yk, the regression was performed using Yk,n as the predictee, and a concatenation of Yk,np = [Yk,n−1···Yk,n−p] and Xn+1p = [Xn···Xn−p+1] as predictors; in this case a zero-lag effect from the present state of the heart system to the present state of any brain system was allowed to account for the longer memory of the RR interval HF power compared to the EEG band powers imposed by the adopted measurement convention (i.e. the information represented by Xn was collected over 120 s, overlapped only for the second half with the 60 s used for the computation of Yk,n). The maximum lag p was selected according to the Bayesian Information Criterion (BIC) [29] applied separately to each performed linear regression.
Exploiting the analogy between entropy and predictability also has the advantage that it allows the solid evaluation of the significance of each estimated measure of information dynamics, based on the utilization of F-statistics. Indeed, assessing the statistical significance of any mutual information I(Z;V|W) expressed as in (6) can be conceived as being equivalent to comparing two regressions: a so-called unrestricted regression, where Z is predicted using the full set of predictors contained in V⊕W, and a restricted regression, where Z is predicted using only the reduced set of predictors contained in W. Accordingly, statistical significance is assessed by a parametric test performed over the residual sums of squares of the restricted model (RSSr) and of the unrestricted model (RSSu). The test statistic is F = ((RSSr-RSSu)/nr)/(RSSu/(N-ncoeff)), where N is the number of predicted points, nr is the number of restrictions, and ncoeff is the total number of coefficients for the unrestricted model. Then, the tested measure is taken as significantly larger than zero if F is larger than the critical value of the Fisher distribution with (nr, N-ncoeff) degrees of freedom computed for some prescribed significance level α (in this study, α = 0.01).
In the practical computation, the analysis of information dynamics was performed twice: first on the whole time series encompassing all sleep stages; and then considering only the light sleep state (stages 1–2), the deep sleep state (stages 3–4) or the REM state (periods of wakefulness corresponding to sleep arousals were ignored because their duration was too short when compared with the 1 min time scale of the analysis). State-specific analysis was executed by performing restricted and unrestricted linear regressions after pooling together the portions of the time series measured during the sleep epochs classified as belonging to each specific state (different colors in figure 1). Care was taken to prevent any realization of the predictee and of its corresponding set of predictors from encompassing different epochs; this means that in the computation of each scalar element of the covariance matrices used in (7), every covariance sample drawn from blocks of data identifying two different epochs was excluded from the estimation sum.
3. Results
The mean duration of NREM sleep was 338 ± 24 min (light sleep: 221 ± 27 min; deep sleep: 118 ± 31 min) and that of REM sleep was 106 ± 24 min (24% of total sleep time). These values were in line with previously reported results in healthy subjects [3, 30].
According to the F-test performed for the brain and heart time series, the predictive information was statistically significant in all subjects, both when computed for the full time series and for each single sleep stage. This indicates the existence of structured dynamics during sleep both for the RR interval HF component and for the amplitude of all EEG waves. The sources of information that determine these structured dynamics were investigated through the proposed decomposition strategies, resulting in the information dynamical quantities depicted in figures 2, 3 for the full night analysis, and in figures 5, 6 for the sleep stage analysis. Moreover, the direct transfer of information between pairs of constituent systems of the whole observed brain–heart physiological network was assessed by computing partial transfer entropies, resulting in the network representations depicted in figure 4 (full night) and figure 7 (sleep stages).

Figure 2. Information decomposition for the heart system during full night polysomnography (sleep stages 1–5). The predictive information of the heart system, PX (mean over 10 subjects, proportional to the area of the pie chart), is expanded as the sum of the information stored in the heart system, SX, and the information transferred to X from the brain system, TY→X. The information transfer is further decomposed into the transfer from the kth brain rhythm,  , and transfer from the remaining brain rhythms,
  , according to all five possibilities (k = 1,...,5). The number of statistically significant values (out of the ten subjects) is reported for each measure.
Download figure:
Standard image High-resolution image
Figure 3. Information decomposition for the brain system during full night polysomnography (sleep stages 1–5). The predictive information of each brain subsystem,  (k = 1,...,5, mean over ten subjects, proportional to the area of the pie chart), is expanded as the sum of the information stored in the subsystem,
  , the information transferred to the subsystem from the heart system,
  , and the information transferred from the other brain subsystems,
  . The number of statistically significant values (out of ten subjects) is reported for each measure.
Download figure:
Standard image High-resolution image
Figure 4. Dynamical interactions in the brain–heart physiological network during full night polysomnography. The six network nodes represent the cardiac HF dynamics (process X) and five different brain dynamics (processes Y1,...,Y5 related to the δ, θ, α, σ, β brain waves). Connecting arrows depict the direct information transfer, assessed by the measure D of equation (5). The values of D (mean over 10 subjects) are color-coded for the brain–brain subnetwork (blue color grades) and for the brain–heart subnetwork (red color grades); the arrow thickness is proportional to the number n of subjects for which D was detected as statistically significant; this number is also reported beside each arrow.
Download figure:
Standard image High-resolution imageThe decomposition of the predictive information about the heart system (figure 2) evidences significant amounts of information storage within the system, as well as information transfer from the brain system (SX and TY→X are statistically significant in all subjects). The decomposition of the information transfer evidences the brain system associated to the β rhythm as the one transferring the largest amount of information to the heart system, with values of  that were statistically significant in nine out of ten subjects. On the contrary, the transfer was low or negligible for the δ, θ, α and σ rhythms (
 , k = 1, 2, 3, 4, was significant in 0, 1, 2, and 3 subjects).
The predictive information about the brain subsystems (figure 3) was higher for the δ rhythm, and lower for the β rhythm, than for the θ, α and σ rhythms. Nevertheless, the predictive information  and the information storage
  were statistically significant in all subjects and for all rhythms. The information transfer from the heart system was substantial towards all brain subsystems (
 was significant in 9, 9, 8, and 10 subjects for k = 1, 2, 3, 5 respectively) but not for the σ rhythm (
 was significant in only 3 subjects). The transfer of information within the brain system, quantified by the measure
  , was considerable for the δ, θ, and α rhythms (significant in 10, 10, and 9 subjects respectively) while it was lower for the σ rhythm and especially for the β rhythm (significant in 5 and 3 subjects respectively).
The above results were confirmed in terms of direct information transfer computed between each pair of subsystems and depicted in the network representation of figure 4. While directed interactions originating from the heart system were detected toward each brain subsystem, the largest direct information transfer was identified toward the β node ( is of higher modulus and significant in nine out of ten subjects). For the opposite direction, from brain to heart, the direct transfer originates almost exclusively from the β node (
 is significant in 0, 0, 1, 3, 8 subjects for k = 1, 2, 3, 4, 5 respectively). As regards to the brain–brain subnetwork, it appears fully connected but with some features differentiating the different brain rhythms in terms of outgoing and incoming connections relevant to the corresponding network nodes (table 1). Indeed, nodes corresponding to the slower EEG waves (δ, θ, and α) receive more information than those sent out towards the other nodes, as documented by values >1 of the ratio between the number of incoming connections and that of outgoing connections. On the contrary, nodes describing σ and β activity are characterized by a small number of incoming links and a large number of outgoing links (ratio < 0.5).
Table 1.
Incoming and outgoing connections for the nodes of the brain–brain subnetwork. For each node of the brain–brain subnetwork (system Yk, k = 1,...5), values are the number of subjects for which a statistically significant direct information transfer was detected for the incoming connections ( , i≠k) and for the outgoing connections (
 , i≠k).
| k | rhythm | in | out | ratio |
|---|---|---|---|---|
| 1 | δ | 18 | 11 | 1.64 |
| 2 | θ | 21 | 10 | 2.10 |
| 3 | α | 21 | 11 | 1.91 |
| 4 | σ | 8 | 18 | 0.44 |
| 5 | β | 8 | 23 | 0.35 |
Computing the information theoretical measures on the portion of the time series measured during the different sleep stages led us to the results depicted in figures 5 and 6 for the information decomposition analysis, and in figure 7 for the network structure analysis. While the overall predictive information and the information storage relevant to each subsystem were significant in all subjects at each sleep stage, the transfer of information across the system underwent significant modifications when computed during specific sleep stages compared with the full night analysis. Figure 5 shows that the brain-to-heart information transfer, though being on average larger during the single sleep stages than for the full-night recordings, progressively lost significance going from light sleep to deep sleep and REM sleep (TY→X was statistically significant in 7, 5 and 2 subjects for stages 1–2, 3–4, and REM, respectively); this decreased significance was mirrored by the lower number of subjects showing significant transfer from the β EEG wave to the cardiac time series. As seen in figure 6, the transfer from the heart system to each brain subsystem was also less significant during single stages compared to the full night analysis, with a drop of statistical significance that was particularly evident during REM sleep. Figure 6 also documents that the information transfer internal to the brain–brain network went through a similar reduction in statistical significance, in particular during REM sleep. These findings were supported by the direct transfers depicted in figure 7, indicating a progressive decrease in strength and the number of network connections while moving from light sleep to deep sleep, and from deep sleep to REM sleep. Compared with the full night condition, during light sleep the brain–heart subnetwork was at least partly preserved (e.g. properties of the direct link from cardiac HF power to β wave power were substantially unchanged), while the brain–brain subnetwork showed more sparse and less strong connections. The consistency and strength of the direct information transfers were dampened further during deep sleep, and were almost totally lost during REM sleep.

Figure 5. Information decomposition for the heart system during different sleep stages: light sleep (a), deep sleep (b), and REM sleep (c). Symbols and colors are as in figure 2.
Download figure:
Standard image High-resolution image
Figure 6. Information decomposition for the brain system during different sleep stages: light sleep (a), deep sleep (b), and REM sleep (c). Symbols and colors are as in figure 3.
Download figure:
Standard image High-resolution image
Figure 7. Dynamical interactions in the brain–heart physiological network during different sleep stages: light sleep (a), deep sleep (b), and REM sleep (c). Symbols and colors are as in figure 4.
Download figure:
Standard image High-resolution image
4. Discussion
In this study, the complex network of dynamical brain–heart interactions that subserves human physiological variability during sleep was investigated, building on two relatively new and as yet in part unexplored fields, i.e. network physiology [12] and information dynamics [15]. The exploitation of an integrated analysis approach developed within these fields makes it possible to deal with the complexity and the diversity of the dynamical activity and connectivity of different physiological systems. Indeed, the framework of information dynamics provides a meaningful way to assess the predictive information carried by each considered physiological system, and to dissect this information into a part actively stored in the system, and a part transferred to the system from other physiological (sub)systems connected to it. With this approach, we documented the existence during sleep of a network of dynamical interactions between the strength of the cardiac vagal component and the amplitude of the different EEG waves, taken respectively as the descriptive variables of the heart and brain physiological systems. Interactions inside this network were described in terms of significant information transfers both within the brain–brain subnetwork and between this subnetwork and the heart system. In particular, we identified the EEG β rhythm as the hub of this complex network, i.e. the node which sends to the heart system the largest part of the information flowing from the brain–brain subnetwork and, at the same time, conveys to the other brain subsystems the information arriving from the heart system. Interestingly, the network was found to be sustained mostly by the transitions across different sleep stages, as the information transfer was weaker during specific stages than during the whole night, and diminished when moving from light sleep to deep sleep and to REM sleep.
4.1. Information dynamics approach to the study of sleep brain–heart physiological interactions
The most distinctive features of the information domain analysis presented in this study are that it is performed according to a fully multivariate perspective, and it allows the investigation of the sources determining the statistical structure of each observed dynamic process. The application to sleep data has revealed that all of the dynamic processes describing the activity of the heart system X and of the different brain subsystems (Y1,...,Y5) carry significant amounts of information that can be predicted from the knowledge of their own past (information storage), and from the past of the other processes (information transfer). The storage of information within a system may originate from internal memory mechanisms associated with the individual target process, but also from an apparent memory in the process caused by information storage lying in another (either observed or unobserved) element which is driving the target process [21]. In our study, the information storage observed within the heart system (figures 2, 5) may originate from fluctuations in the autonomic activity causing predictable dynamics in the overnight course of the HF component of HRV [31, 32]. In the brain system, the conspicuous information storage observed for all subsystems (figures 3, 6) is likely to result both from the known sleep-related modulation of individual EEG waves [33, 34], and from their well-described correlation [35–37]. The existence of a correlation between the time-courses of the amplitude of slow and fast EEG waves is confirmed by our analysis, and also by looking at the structure of the brain–brain subnetwork, which appears fully connected (figure 4, blue-coded arrows). In addition to revealing correlated activities, our analysis also allows the characterization of the patterns of directional connectivity within the brain–brain subnetwork. Our results lead to an interpretation of the negative correlation between slow and fast EEG waves observed in previous studies [35–37] as the result of directed interactions occurring from the fast σ and β rhythms to the slower α, θ and δ rhythms (figure 4, table 1).
Our analysis of information transfer between the heart and brain systems supported the findings of several previous studies documenting the existence of an interaction between HRV and the amplitude of the various EEG waves [3, 4, 6–8, 38–40]. While these studies were limited, from a methodological point of view, by the fact that they were based on bivariate and non-causal approaches, the extension towards a multivariate and causal perspective offered by the present work allowed us to investigate the nature of the observed brain–heart interactions in more detail. Our results indicate that the overnight physiological coupling between the cardiac vagal component and the EEG rhythms is bidirectional, as significant amounts of information transfer were detected along the heart-to-brain direction (X → Y) as well as along the brain-to-heart direction (Y → X). The analysis particularized to the different brain subsystems (Y1,...,Y5) allows the investigation of how each brain rhythm contributes to directing the information transfer to and from the heart system. In particular, both information decomposition and network structure analysis indicate that the EEG β oscillations play a pivotal role in mediating the brain–heart information transfer. Such a role is evidenced: (i) by the fact that the transfer from a single brain subsystem to the heart system is nontrivial only for the β waves (as shown in figure 2 using the bivariate measure  , and in figure 4 using the multivariate measure
  ); (ii) by the fact that the β node of the network receives the largest part of predictive information flow originating from the heart system X (see figure 4) and at the same time has the maximal outgoing capacity (see table 1). According to this interpretation, we suggest that brain–heart interactions, as measured by the coupling between EEG wave amplitude and cardiac vagal activity, occur firstly by means of direct reciprocal influences between the cardiac component and the EEG power in the β band, and are then extended to the other EEG wave oscillations through the connections of the brain–brain subnetwork. In addition to this novel interpretation, the analysis of information transfer also provided confirmation of previously reported findings. For instance, the unidirectional nature of the link between cardiac vagal activity and EEG δ power, observed in [3] measuring a negative cross-spectral phase shift (HF HRV precedes δ EEG), is detected in our study by the substantially absent information transfer from EEG δ power to HRV HF power (
 is never statistically significant in figure 2) and the contemporaneous detection of a strong information transfer from HRV HF power to EEG δ power (
 is always statistically significant in figure 3). With similar reasoning we also found that the HRV HF power drives the EEG θ power and the EEG α power in a unidirectional way, while its link with the EEG σ power is weak, and that with the EEG β power is strong and bidirectional. These results agree with, and partly explain, the values observed in [3] for the phase shifts between the cardiac vagal component and the EEG bands (i.e. negative shifts for θ and α, zero phase shift for σ, and phase opposition for β).
In order to elucidate the role played by the different sleep stages in sustaining the observed brain–heart and brain–brain interactions, the analysis was repeated particularizing the computation of the information domain measures to light sleep, deep sleep and REM sleep. Noticeably, while brain–heart and brain–brain information transfers were consistently detected across subjects when considering the full night recordings (figure 4), the links progressively lose consistence when moving from light sleep to deep sleep stages, and the interaction network broke down during REM sleep (figure 7). Thus, although this result may partly reflect a lower statistical power of the analysis performed on the shorter time series relevant to the specific sleep stages, it seems that the observed interaction network is peculiar to the dynamical changes encompassing several sleep cycles. Interestingly, the vanishing information transfer revealed by the stage-specific analysis was observed together with a preserved information storage at each node of the physiological network (figures 5, 6). The significant information storage in the heart and brain systems indicates the presence of structured dynamics that, at the time scales explored in this study, are probably reflecting the long-range correlations observable when looking at the temporal evolution of the heartbeat intervals [41] and of the brain waves [42]. Nevertheless, several important studies demonstrated that the long range fractal correlations of the cardiac dynamics differ significantly in wakefulness compared to sleep [43], and particularly in NREM sleep compared to REM sleep [44–46]. Thus, given that changes in the internal dynamics of a physiological system may alter its coupling with other systems, the modifications occurring in the long-range correlation structure of the cardiac dynamics with the transition from one sleep stage to another may contribute to explaining the decoupling of the heart system from the brain system components which we found during deep sleep and particularly REM sleep.
The essential role played by the sleep stage transitions in the formation of the observed physiological networks contributes to provide a physiological interpretation for the type of brain–heart and brain–brain interactions detected in the present study. In fact, it seems evident that the measured brain and heart dynamics are affected by the depth of sleep and by the transitions between NREM and REM sleep. On the one hand, the fluctuations in nocturnal autonomic nerve tone induced by sleep stage transitions are clearly reflected in the HRV spectrum, with the HF component representing a marker of vagal regulatory activity [9, 31]. On the other hand, it is well known that the depth of sleep modulates the EEG spectral profile in a way such that the amplitude of slow δ and θ waves increases, and the amplitude of faster rhythms decreases, when moving from lighter to deeper stages of sleep [34]. Therefore, we hypothesize that the network organization of the nocturnal oscillations of HRV and EEG wave amplitudes which we found in this study is sustained by the changes in autonomic activity induced by rhythmic variations of the sleep structure.
4.2. Perspectives and limitations
The time scale of the oscillatory activities for which we assessed regularity and connectivity is longer than the scale investigated in other recent studies performing a joint dynamic analysis of EEG and HRV time series [12, 47]. While in [12, 47] the time series samples were obtained with a one second resolution, our sampling period was of one minute. Moreover, the dynamic interactions among time series built in the same way as that used in this study were documented to occur with a maximal strength between brain and heart oscillations having a period greater than 15 min [3], while on the contrary several transitions in the strength of physiological interactions were observed in [12] within epochs of a few minutes. While investigating these different time scales, both our study and the study of Bashan et al [12] have demonstrated the existence of structured networks of physiological interactions describing the neuro-autonomic regulation of cardiac and brain dynamics during sleep. At a shorter time scale, well defined network topologies were observed for each specific sleep state, with higher network connectivity during waking and light sleep periods, intermediate connectivity during REM sleep, and low connectivity during deep sleep [12, 13]. At a longer time scale, we have found in this study that network connectivity is generally low for each individual sleep stage, with a strength progressively decreasing from light sleep to deep sleep and to REM. Most importantly, the observed network of interactions appears to be sustained by the state transitions themselves, as the analysis encompassing the transitions revealed a much higher connectivity. Overall, the comparison between our findings and those of previous studies [12, 13] suggests that different mechanisms of physiological coupling are evoked at different time scales, resulting in interaction networks which are structurally and topologically different. This observation is physiologically plausible, as demonstrated in a very recent study [48] in which brain, cardiac and respiratory interactions were studied across sleep stages employing several analysis tools and showing that integrated organ systems communicate through multiple mechanisms operating at different time scales. Thus, our results and those in [12, 13, 48] support the view that different physiologic systems may exhibit different forms of coupling, coexisting with each other and acting on different time scales. Future studies should be directed towards the further integration of quantitative measures into a multiscale, multivariate framework for physiological interaction analysis during sleep.
In addition to the possibility of exploring different time scales, the approach presented in this study may also be extended toward the identification of larger networks, either comprising different physiological systems or increasing the number of analyzed output variables for a single studied system. Indeed, on the one hand it is well known that systems other than the cardiac and cerebral are involved in the complex regulation of the human organism: for instance, circulation, ventilation and cerebral blood flow regulation have been often studied in terms of cardiovascular, cardiorespiratory and cerebrovascular time series analysis [11, 49–51]. On the other hand, the multivariate analysis of signals measuring the electrical activity of the brain and of the heart (recorded using multichannel EEG and ECG devices, for example) is commonly performed when these systems are viewed as spatially distributed systems devoted to the execution of specific functions (e.g. the processing of neural cognitive tasks or the mechano-electrical cardiac activity). In this perspective approaches like ours, developed in the framework of mapping a 'network of networks' [13], may be easily extended to provide a deeper understanding of how communications across integrated organ systems arise from the behavior of the physiological network describing the whole organism, as well as from the internal activity of each constituent sub-network.
In the present study, the practical implementation of the information-theoretic tools has been obtained under a linear approximation of the functional relations underlying the computation of entropy measures. Equation (6) constitutes an exact expression for conditional mutual information if the data under analysis are drawn from a joint Gaussian distribution [28]. In this case, it has been shown that the statistical dependencies in the data are fully captured by linear prediction models like those used in the present study [52, 53]. On the contrary, when the data depart from the joint Gaussian distribution, equation (6) becomes an approximate expression, and in such cases the adopted estimator may not be able to capture information transfers or structures of dependence originating from nonlinear dynamics. This may constitute a limitation, since signatures of nonlinear dynamical interdependence of HRV and EEG wave amplitudes have been revealed during sleep [8]. In the dataset studied in this work the null-hypothesis of joint Gaussian distribution was rejected (Royston's multivariate normality test [54]) in the majority of the considered subjects. However, assessing multivariate normality is not a trivial issue, inasmuch as the many available testing procedures often lead to opposing conclusions [55]. Most importantly, deviations from Gaussianity cannot be used to state the unsuitability of the linear estimation approach, because they do not imply the prevalence of nonlinear connectivity (e.g. interactions can be entirely linear even for non-Gaussian processes). The role played by nonlinear dynamics should be more properly assessed, comparing the information measures based on linear regression with those computed either from the parameters of the particular multivariate distribution that fits the observed data [56], or from the utilization of model-free approaches [25, 26, 57–59]. We aim to perform such a comparison in a future contribution, in order to determine the extent to which nonlinearities contribute to the generation of predictive information in brain–heart physiological networks during sleep.
5. Conclusion
The present study suggests that the complex network of dynamical interactions between the strength of the cardiac vagal component of HRV and the amplitude of the different EEG rhythms observed during sleep may be disentangled through the combined utilization of network physiology and information dynamics. The analysis of the dynamics of information within and between the overnight variability of the EEG and HRV power assessed in different bands contributes to a better understanding of the physiological mechanisms underlying the complex interaction between sleep and the cardiac autonomic control. In addition to the physiological insight, elucidation of the mechanisms sustaining brain–heart interaction networks during sleep may have significant medical and clinical implications. While the clinical significance of brain–heart interactions depending on the stage organization of sleep has been proven in specific pathologies like insomnia [40] or sleep apneas [39], the known profound impact of sleep on both cardiovascular and cerebral regulation mechanisms makes the system-wide approach proposed in this study eligible for the early diagnostic description of a variety of cardiovascular disorders.