


Abstract
This paper presents a measurement of the cross-section for high transverse momentum W and Z bosons produced in pp collisions and decaying to all-hadronic final states. The data used in the analysis were recorded by the ATLAS detector at the CERN Large Hadron Collider at a centre-of-mass energy of  and correspond to an integrated luminosity of
  . The measurement is performed by reconstructing the boosted W or Z bosons in single jets. The reconstructed jet mass is used to identify the W and Z bosons, and a jet substructure method based on energy cluster information in the jet centre-of-mass frame is used to suppress the large multi-jet background. The cross-section for events with a hadronically decaying W or Z boson, with transverse momentum
  and pseudorapidity
  , is measured to be
 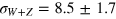 pb and is compared to next-to-leading-order calculations. The selected events are further used to study jet grooming techniques.
Export citation and abstract BibTeX RIS

Content from this work may be used under the terms of the Creative Commons Attribution 3.0 licence. Any further distribution of this work must maintain attribution to the author(s) and the title of the work, journal citation and DOI. Article funded by SCOAP.
This article was amended on 24 November 2014 to include SCOAP3 funding information.
1. Introduction
Many theories beyond the Standard Model (SM) predict new particles with masses at the TeV scale. Some of these heavy resonances can decay to final states with W or Z bosons. Because the masses of the W and Z bosons are an order of magnitude below that of their hypothetical parent states, such decays appear highly boosted in the laboratory frame. The hadronic decay products may be so collimated that they appear as single jets in the detector (hereafter referred to as  jets). The ability to recognize and reconstruct the W and Z bosons from such jets is important in extending the search sensitivity for new phenomena with the ATLAS detector at the Large Hadron Collider (LHC).
Because the W and Z masses are small compared to the centre-of-mass energy of 7 TeV at the LHC, the W and Z bosons produced in SM processes can also be highly boosted in the detector. An important first step in the study of boosted  jets is to demonstrate that they can be measured reliably using the ATLAS detector. Jets arising from the strong interactions of quarks and gluons (hereafter referred to as QCD jets) have production cross-sections many orders of magnitude greater than those of W and Z bosons; they are the dominant background to such a measurement and constitute the main difficulty.
In this paper, a measurement of the cross-section of hadronically decaying W or Z bosons with transverse momentum  and pseudorapidity
  produced in pp collisions at a centre-of-mass energy of 7 TeV is presented.221
The measurement is based on the invariant mass distribution of the reconstructed boosted
produced in pp collisions at a centre-of-mass energy of 7 TeV is presented.221
The measurement is based on the invariant mass distribution of the reconstructed boosted  jet candidates. The decay modes considered are
  and
and  , where
 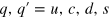 or b. In order to suppress the copious QCD jet background, a novel selection method [1] based on jet substructure is implemented. Because of the limited resolution for the jet mass, the measurement reported is for the sum of W and Z cross-sections, denoted by the
  cross-section
where σ is the production cross-section and  is the decay branching fraction. Previously, W and Z cross-sections have been measured up to
  using the leptonic decay modes [2–4]. The Z cross-section for
  has also been measured in the hadronic decay mode
  [5] at a centre-of-mass energy of 8 TeV .
The jet sample enriched in W and Z bosons that decay hadronically, obtained in this analysis, is used to study the performance of several jet grooming techniques [6–9] designed to reduce the effects of soft QCD radiation and multiple pp interactions per bunch crossing (pileup) on jet mass measurements.
2. The ATLAS detector
The ATLAS detector [10] at the LHC nearly covers the entire solid angle around the interaction region. It consists of an inner tracking detector comprising a silicon pixel detector, a silicon microstrip detector, and a transition radiation tracker, providing tracking capability within the pseudorapidity range  . The inner tracking detector is surrounded by a thin superconducting solenoid providing a
  axial magnetic field and by a calorimeter system placed immediately outside the solenoid. The electromagnetic calorimeters use liquid argon as the active detector medium with lead absorbers, and are divided into one barrel (
 ) and two end-cap components (
 ). The technology used for the hadronic calorimeters varies with η. In the barrel region (
 ), the detector is made of scintillator tiles with steel absorbers. In the end-cap region (
 )), the detector uses liquid argon and copper. A forward calorimeter consisting of liquid argon and tungsten/copper absorbers has both electromagnetic and hadronic sections, and extends the coverage to
  . The calorimeter system is surrounded by a muon spectrometer. Three layers of precision tracking chambers, consisting of drift tubes and cathode strip chambers, enable precise muon track measurements in the pseudorapidity range of
  , and resistive-plate and thin-gap chambers provide muon triggering capability in the range of
  .
.
The ATLAS trigger system uses three consecutive levels. The Level-1 triggers are hardware-based and use coarse detector information to identify regions of interest, whereas the Level-2 triggers are based on fast online data reconstruction algorithms. Finally, the Event Filter triggers use offline data reconstruction algorithms. This analysis uses a trigger that requires a jet with transverse momentum  at Level-1. At the Event Filter level, the scalar sum of the
  of all jets with
  and
and  is required to be larger than either
  or
or  , depending on the data-taking period. These triggers are fully efficient for the offline event selection used in this analysis.
3. Theoretical prediction
The cross-sections for W or Z bosons associated with jets are calculated at next-to-leading order (NLO) using the MCFM Monte Carlo (MC) program [11]. The calculation uses the CT10 parton distribution function (PDF) set [12]. The calculated W production cross-section is approximately three times that of Z production. The total W and Z production cross-sections are then multiplied by the hadronic W and Z branching fractions [13] to obtain the prediction for the hadronic  cross-section for
  and
and  of
of  , where the uncertainty of the calculation is described below.
For the theoretical prediction the renormalization and factorization scales are dynamically set to  of the event, where
  is defined as the scalar sum of the
  of the n particles in the final state. The systematic uncertainty in the predicted cross-section due to higher-order corrections is estimated by independent variation of the renormalization and factorization scales between 0.5 and 2.0 times the nominal scale. Uncertainties in the prediction due to PDF uncertainties are computed from the 52 CT10 eigenvectors at 68% confidence level. The contribution due to the uncertainty in the value of the strong coupling constant
  is negligible. The total uncertainty in the theoretical prediction is computed by summing in quadrature the scale and the PDF uncertainties.
Although the calculation is performed at NLO, the prediction does not include contributions from radiative emissions of the quarks that originate from the  boson decay or collinear W emission inside quark and gluon jets. The effect of a virtual photon is not included in the Z cross-section. The process
  is estimated to constitute a negligible background. The W bosons from top-quark decays as well as the
  bosons from diboson production are considered as background to the measurement.
4. Data sample and Monte Carlo simulation
The data sample studied in this paper was recorded with the ATLAS detector at a pp centre-of-mass energy of  in 2011, and corresponds to an integrated luminosity of
  fb−1 [14]. Only data taken with all relevant detector sub-systems operational are used. Following basic data-quality checks, further event cleaning is performed by demanding that jets used in the analysis do not originate from instrumental effects, such as large noise signals in one or several channels of the hadronic end-cap calorimeter, or coherent noise in the electromagnetic calorimeter, or from non-collision background. Events are also required to have a reconstructed collision vertex with at least three associated tracks, each with a transverse momentum greater than 400 MeV.
Simulated event samples of vector-boson production and of jets with large transverse momentum produced via strong interactions are used in the analysis. They are simulated utilizing different event generators, parton showering and hadronization models and various tunes of other soft model parameters, such as those of the underlying event, in order to compare to the features of the selected events.
The default simulated  signal events are generated using HERWIG 6.520 [15] interfaced to JIMMY 4.31 [16], using the modified MRST LO** PDF set [17, 18]. HERWIG 6.520 is based on a leading-order (LO) perturbative QCD calculation. The signal cross-sections are scaled by a K-factor of 1.25 to match the cross-section values predicted by an NLO perturbative QCD calculation using MCFM [11] with the CT10 PDF set [12] as quoted in section 3. For cross-checks and the study of systematic uncertainties, additional signal samples are generated using PYTHIA 8.153 [19] and PYTHIA 6.426 [20] with ATLAS Minimum Bias Tune 1 and 2B (AMBT1 and AMBT2B) [21]. PYTHIA 8.153 uses a LO CTEQ6L1 [22] PDF set and PYTHIA 6.426 uses a modified MRST LO** PDF set. The decay modes of the vector bosons included in the signal MC simulations are
  and
and  , where
  or b. The effect of virtual photon production is not included in the simulation of Z signal events.
The default QCD jet background events are generated with PYTHIA 8.153. Alternative background samples are also generated using HERWIG++ 2.6.3 [23], PYTHIA 6.426 with AMBT1, AMBT2B and PERUGIA 2011 [24] tunes and POWHEG 1.0 (patch 4) [25, 26]. HERWIG++ 2.6.3 uses a different hadronization model from HERWIG 6.520 and a modified MRST LO** PDF set. POWHEG 1.0 (patch 4) is based on an NLO calculation that is interfaced to the PYTHIA 6.426 showering routines; the CT10 NLO PDF set is used for the matrix element calculation and the CTEQ6L1 PDF set is used to generate the parton shower.
Top-quark pair events and single-top events in the  -channel are simulated with MC@NLO 4.03 [27] interfaced to HERWIG 6.520 and JIMMY 4.31 and using the CT10 PDF set. In addition, an alternative
  MC sample is generated using POWHEG 1.0 (patch 4). The top-quark pair production cross-section is scaled to match the calculated value from a next-to-next-to-leading-order calculation [28]. Single-top events in s- and t-channels are simulated with POWHEG 1.0 (patch 4). Simulation of diboson events (
 ,
,  ,
,  ,
,  and
and  ) is performed with HERWIG 6.520 with the MRST LO** PDF.
All simulation samples are generated with pileup by overlaying simulated minimum bias events on each generated signal and background event. The number of overlaid events is simulated such that the distribution of the average number of interactions per pp bunch crossing in the simulation matches that observed in the data. This average varies with data-taking period and ranges typically between 4 and 16. The generated samples are processed through the GEANT4 [29] simulation of the ATLAS detector [30] and the standard ATLAS reconstruction software.
5. Jet reconstruction and selection
Jets are reconstructed using the anti-kt algorithm [31] with a jet radius parameter R = 0.6. Topological clusters [32] of energy deposits in the calorimeters are used as input to the clustering algorithm. The topological clusters are calibrated to the hadronic energy scale [33, 34]. Selected jets are required to have transverse momentum  , pseudorapidity
  and reconstructed jet mass
  . Studies [7] show that for a hadronically decaying
  boson with
  , the angular separation of the decay products tends to less than R = 0.6. The jet mass is calculated from the energies and momenta of the jet constituents as
  where Ei and
  are the energy and three-momentum of the
  constituent. At detector level, the jet constituents are the topological clusters that are considered massless.
In this measurement, hadronically decaying boosted W and Z bosons are identified using their reconstructed jet mass. The W (Z) jet mass distribution peaks around the W (Z) mass value, while the jet mass distribution from QCD jet events has a much broader spectrum. However, the QCD jet production cross-section is several orders of magnitude larger than the SM  production cross-section. According to MC simulation, the data after the preselection consist almost entirely of QCD jets with a tiny fraction of signal events expected to be about 0.5%, and the jet mass alone does not provide sufficient discriminating power to distinguish
  jets from the large QCD jet background. A jet substructure method [1] based on cluster information evaluated in the jet centre-of-mass frame is used to suppress the QCD jet background while keeping most of the
  jets. The centre-of-mass frame (rest frame) of a jet is defined as the frame where the four-momentum of the jet is equal to
  .
.
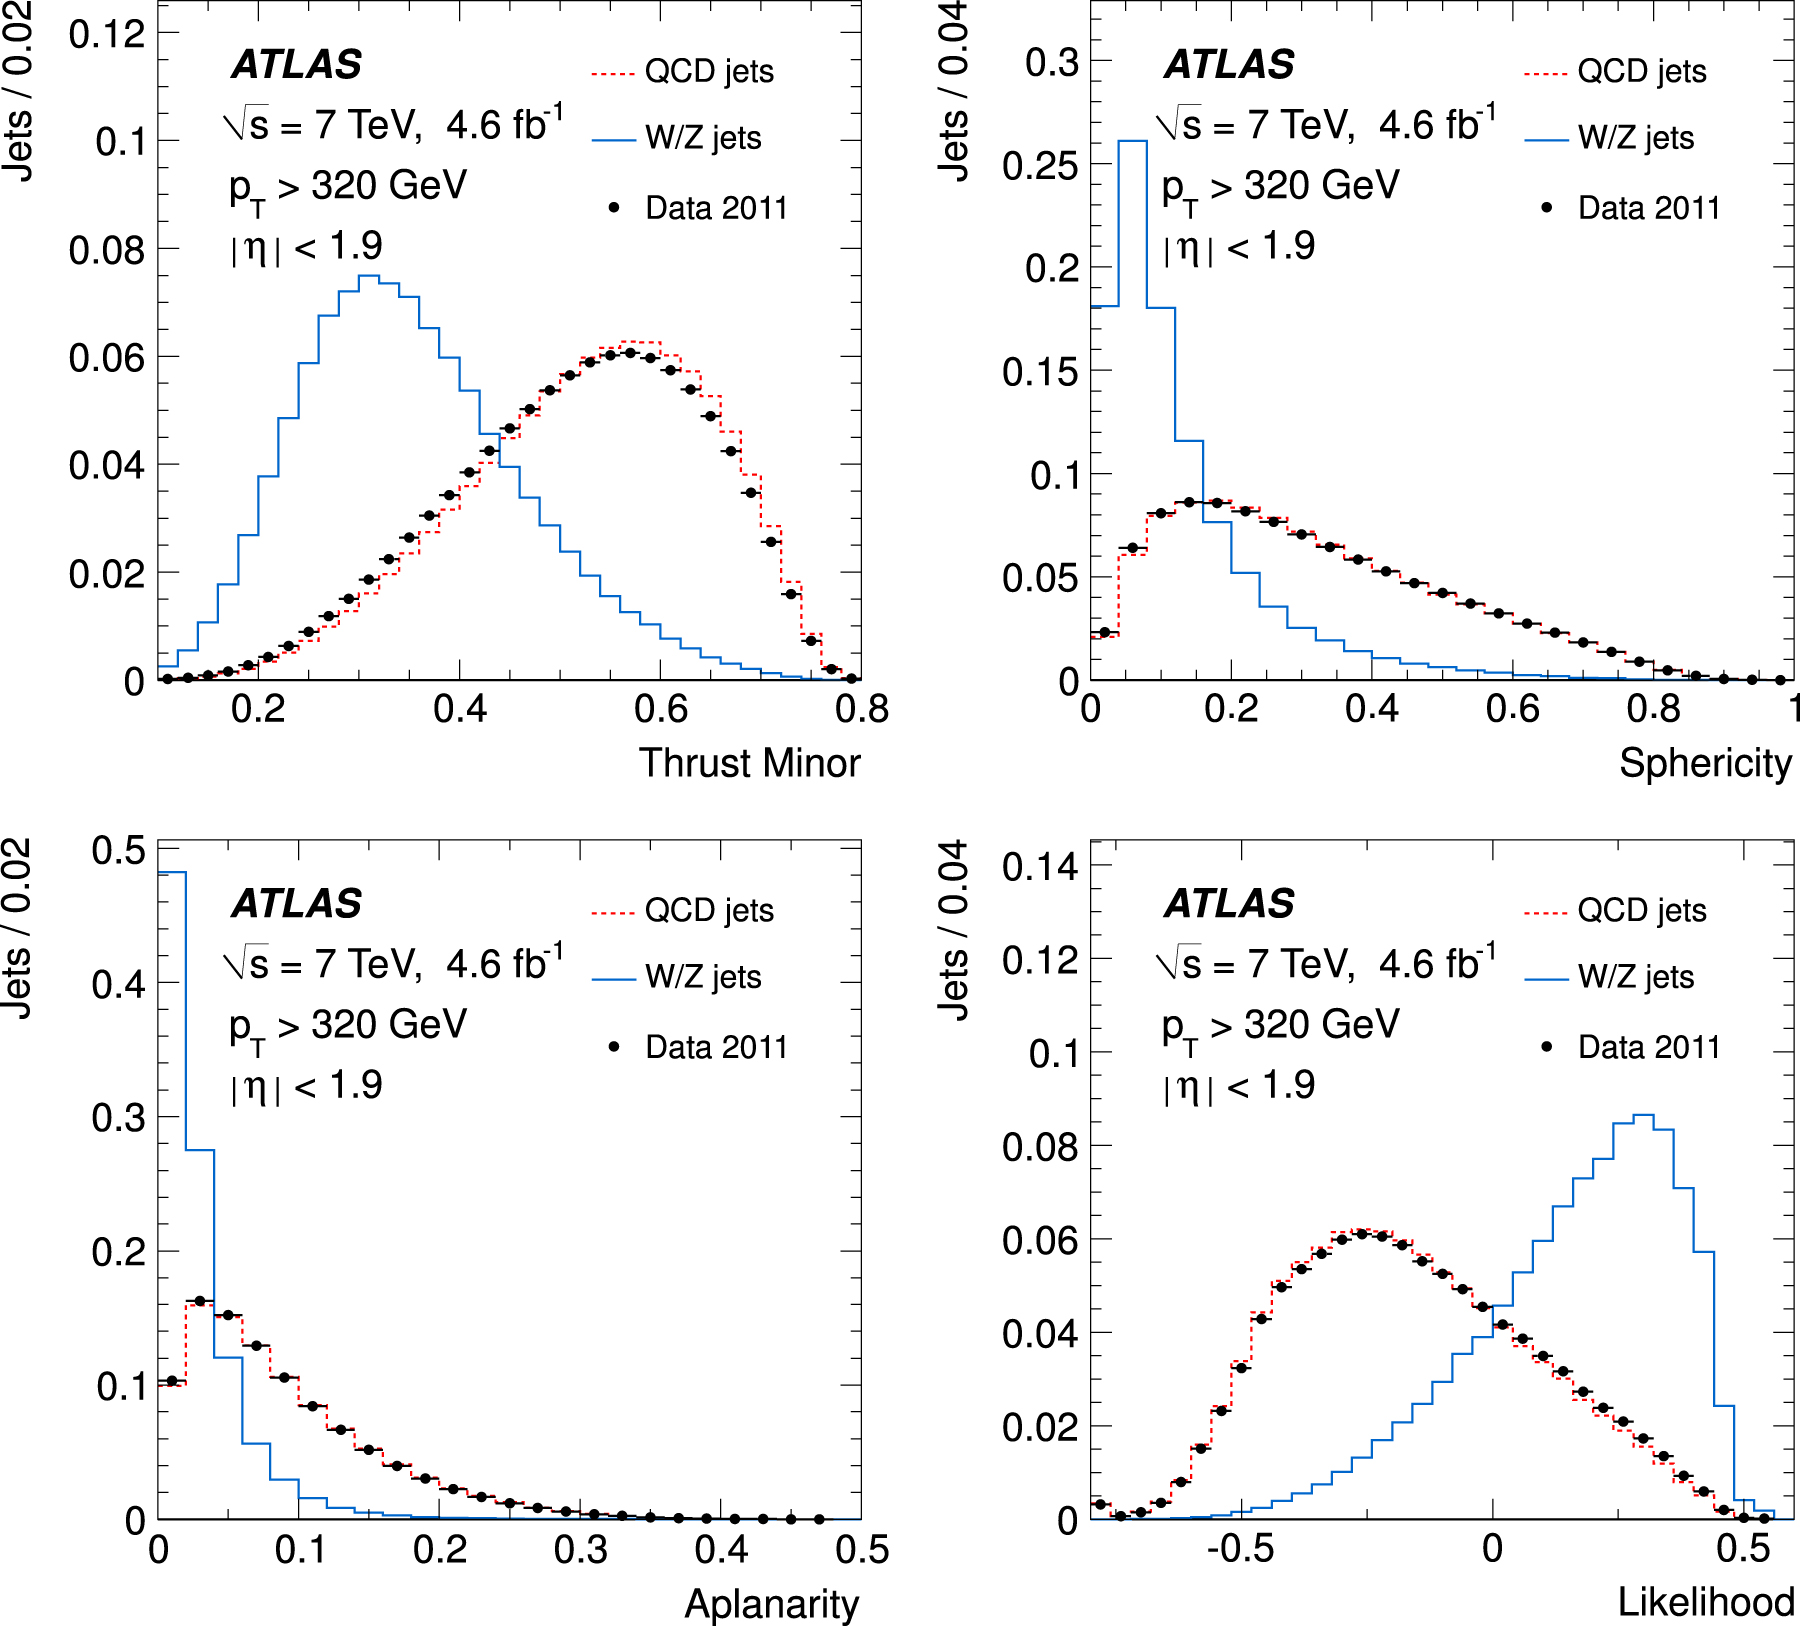
The topology of a W or Z jet in its centre-of-mass frame is expected to be different from that of a typical QCD jet. In the rest frame of a hadronically decaying W or Z boson, the constituent particles in most of the cases look like a back-to-back dijet event. On the other hand, a QCD jet acquires its mass through gluon (g) radiation and  splitting. In this case, the constituent particle distribution in the jet rest frame does not correspond to a physical state with a well-defined mass. Three jet-shape variables, all calculated using the energy clusters of a jet in its centre-of-mass frame, are studied: thrust minor [35, 36], sphericity [37] and aplanarity [37]. A value of thrust minor
  corresponds to an isotropic distribution of energies while
  indicates highly collimated energy deposits. The sphericity is defined such that it is bounded to be between 0 and 1 and the most isotropic events have values close to 1.0. The aplanarity takes values between 0 and 0.5 and isotropic events yield values near 0.5. The definitions of these shape variables are given in appendix
The distributions of the jet-shape variables are shown in figure 1 for the  jet signal, QCD jet background and data. The distributions of the
  jet signal exhibit the characteristics of a back-to-back two-body topology, while those of the QCD jet background indicate a more isotropic distribution. The comparison of aplanarity and sphericity in data with simulated QCD jet events shows excellent agreement while there are small discrepancies between the thrust minor distributions. The comparison of data with different event generators and sets of generator parameters has also been performed. Although none of the MC generators and tunes studied show full agreement with the data for all the shape variables, the data are always within the variations of the distributions between different MC samples.
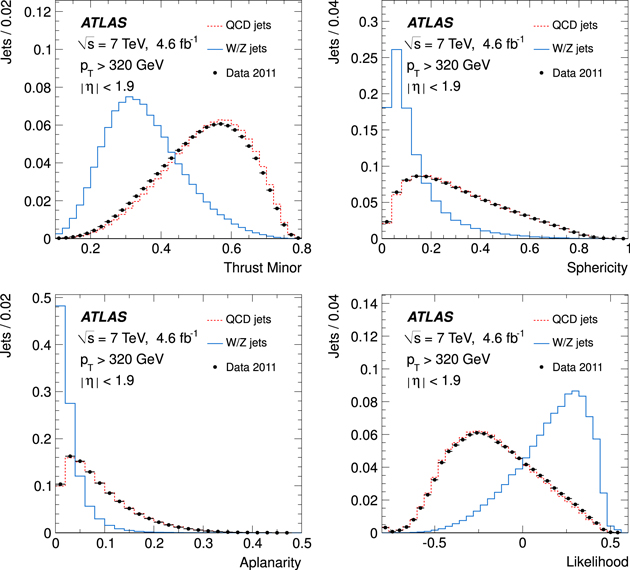
Figure 1. Unit area normalized distributions of the jet-shape variables and of the likelihood discriminant (L) for  jet signal (blue solid, produced using HERWIG 6.520) and QCD jet background (dashed red, produced using PYTHIA 8.153) in the MC samples and data (black dots).
Download figure:
Standard image High-resolution imageTo exploit the power of these variables to discriminate between  jets and QCD jet background, a likelihood discriminant (L) is derived using the three jet-shape variables as inputs, where the correlations between the variables are ignored. The likelihood ratio L(i) for jet i is defined by

with

where  is the normalized signal (background) probability density function (pdf) based on the default MC samples for the
  input variable xk. The distributions of the likelihood discriminant are shown in figure 1 for
  jet signal, QCD jet background and data. For the final event selection, a cut on the likelihood discriminant is made: the optimal cut value is found by maximizing the statistical significance,
  , where S and B are respectively the numbers of
  jet signal candidates and QCD jet background candidates predicted by the simulation. Candidate jets are required to have
  , which corresponds to
  signal efficiency and
  background rejection rate. In 2.5% of the events in data, more than one jet candidate is found; all the jets candidates are considered in the measurement. After all the event selection criteria are applied, the final data sample consists of 590 617 selected jets.
6.
 cross-section measurement

6.1. Modelling of jet mass distributions
The  jet signal yield is extracted using a binned maximum likelihood fit to the jet mass distribution of the selected jets in the data. The probability density functions for the W/Z signal and the background are modelled as follows.
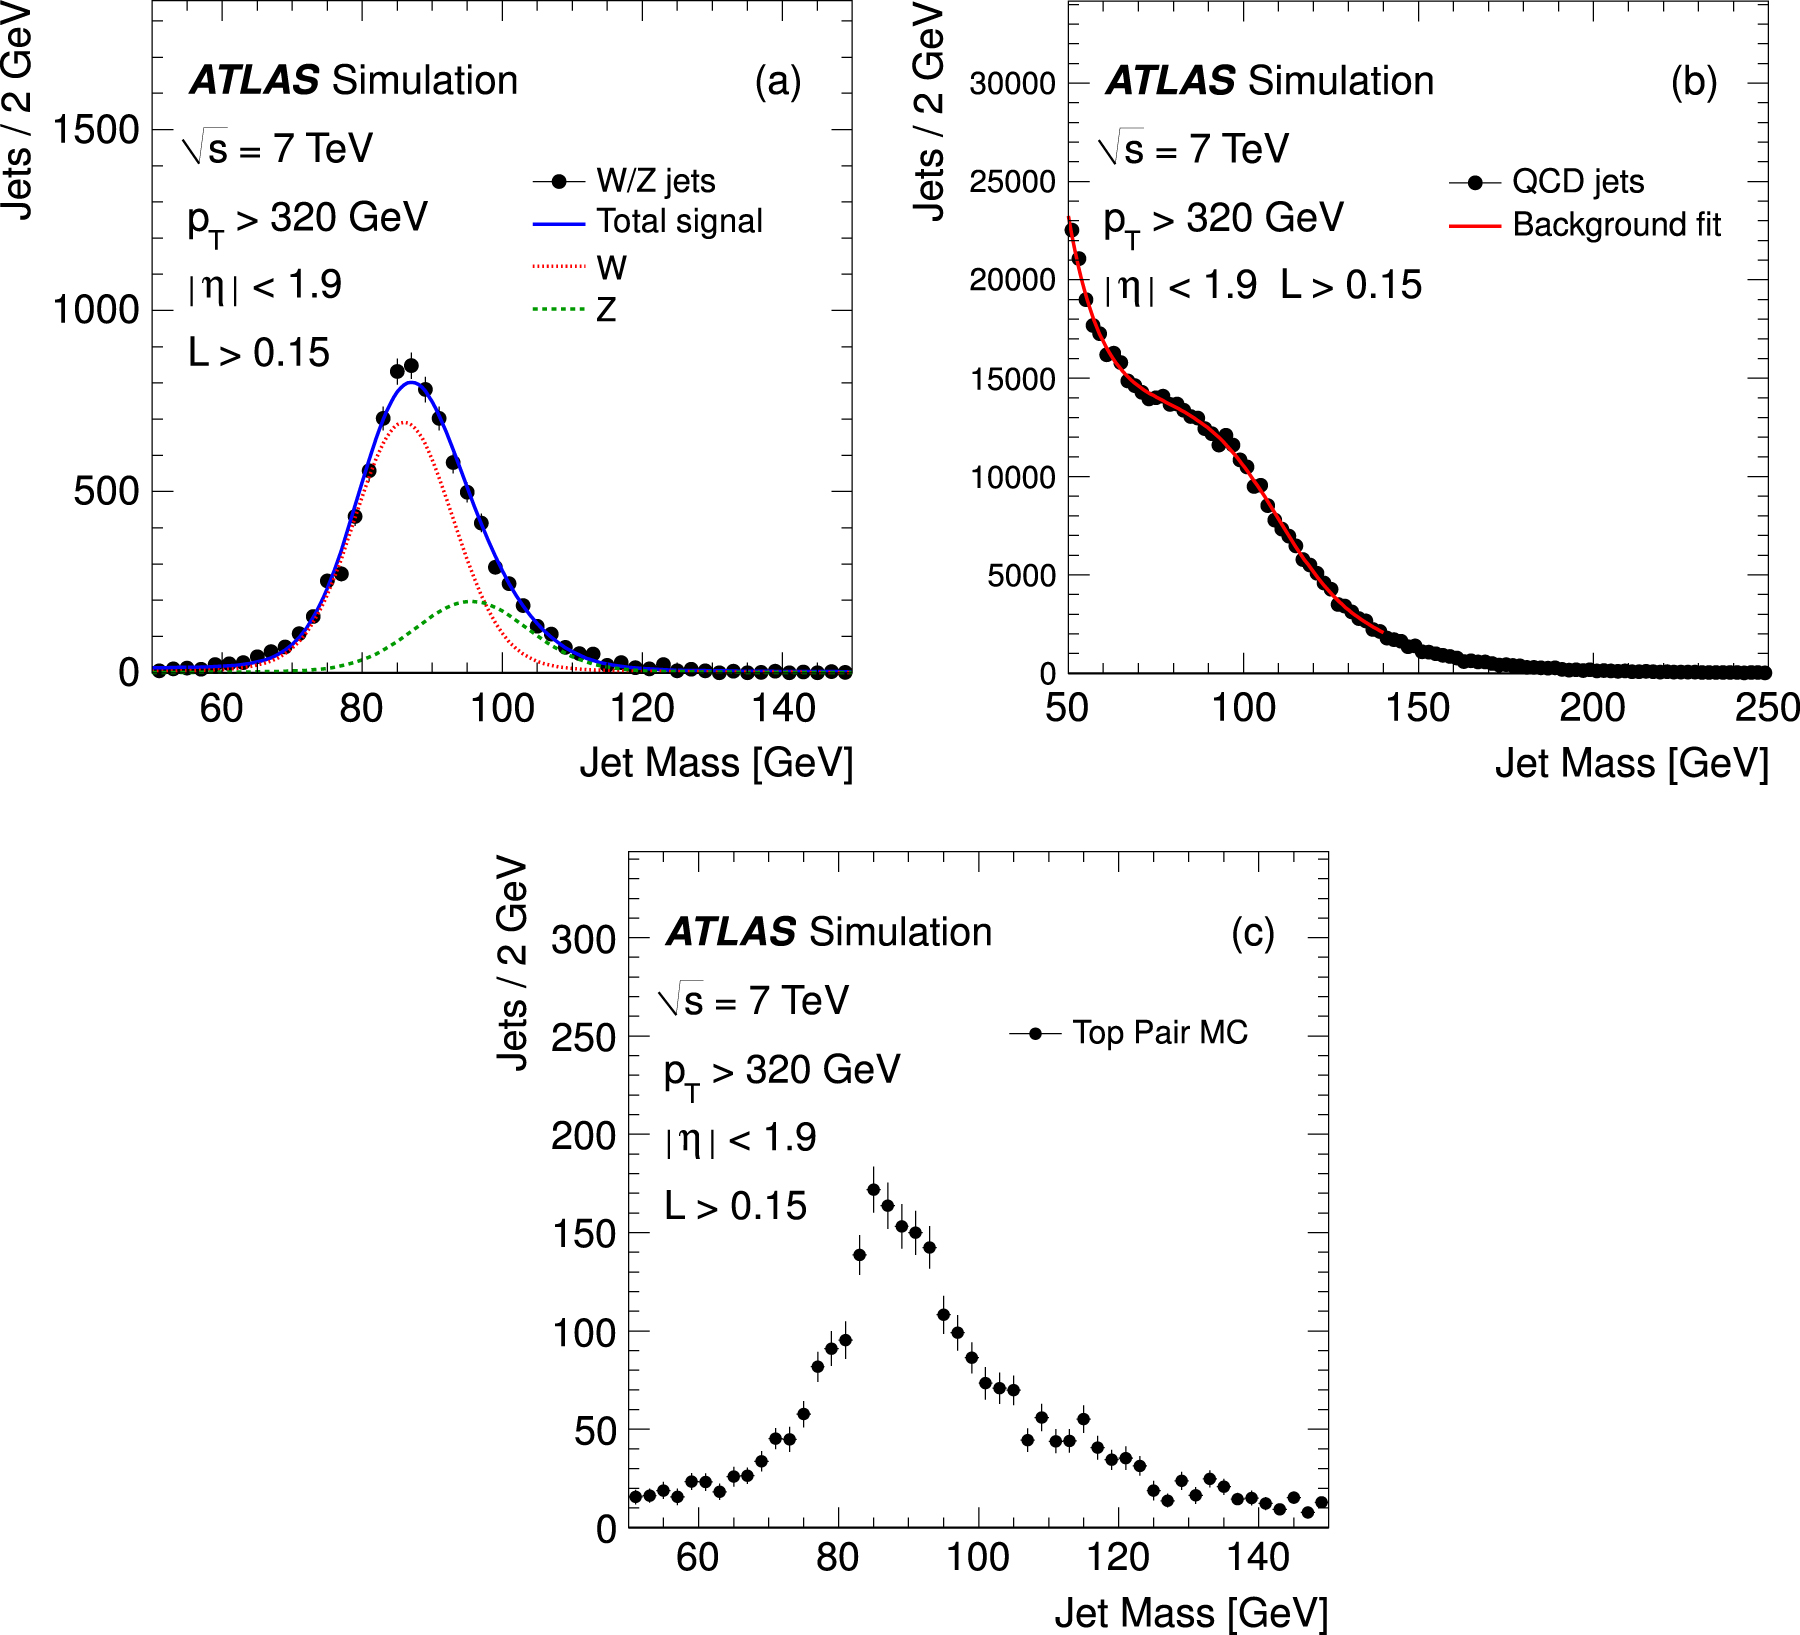
The W jet and Z jet signal pdfs are each modelled as a Breit–Wigner function convolved with a Gaussian function in order to take into account detector resolution effects. Due to additional contributions from pileup, underlying event and hadronization, the peak positions of the reconstructed W and Z signal jets are higher than the masses of the W and Z bosons. The parameters of the signal pdfs: the peak positions, widths and relative fractions of the W and Z rates, are obtained from a fit to the selected  jets in the simulated events. In the fit to the data, the only free parameter affecting the signal is the combined total rate of W and Z bosons. In figure 2(a) the jet mass distribution for
  jets in simulation overlaid with the signal pdfs is shown.

Figure 2. Jet mass distribution in simulation for (a) hadronically decaying W and Z bosons, (b) QCD jet background and (c) hadronically decaying W bosons from top-quark pair events. The QCD jet background and  signal distributions are fitted with the pdfs described in the text. The fit results are shown as solid lines. For the signal, the contributions from W (dotted line) and Z (dashed line) jets are shown. The distributions are normalized to the number of events expected in the dataset used and the uncertainties are statistical only.
Download figure:
Standard image High-resolution imageThe dominant background component in the jet mass distribution comes from the QCD jets. The QCD jet mass distributions in the default MC sample and the alternative samples using different MC generators and tunes described in section 4 are similar and can all be described by the same analytic function. The same function is used to describe the data. However, the values of the parameters of the function differ slightly between the various MC samples and can also be different for the data, and are therefore left free in the fit to the data. The jet mass distributions are parameterized by the sum of two exponential decay functions and a sigmoid function:  where
where  ; the parameters m0 and σm represent the position of the inflection point of the sigmoid function and the slope at the inflection point respectively. In figure 2(b) the jet mass distribution for simulated QCD jet background and the fit result obtained using the background pdf are shown. The jet mass distribution of the QCD jet background displays a shoulder structure that is described by the sigmoid function. This feature is related to the
  and L requirements, the kinematics and internal structure of the selected jets, and to the distance parameter of the jet reconstruction algorithm. The variations of the shoulder structure observed in data with respect to different kinematic selection requirements and the distance parameter of the jet reconstruction algorithm are well reproduced in the MC simulation of QCD jet production.
To determine the direct  production cross-section, background from top-quark decays to W bosons must be subtracted. The top-quark pair (
 ) component is modelled using a one-dimensional histogram based on the simulation, as shown in figure 2(c). After all the event selection criteria are applied, 2700 jets are predicted from the
  MC sample in the range of
  . About half of these jets populate a peak near the signal region with some additional enhancement at higher jet mass, which is due to partial overlap of the W jet with a nearby b-jet. Since the peaking component of this background is small comparing to the expected signal yield, its yield and shape are fixed to the ones predicted by the simulation.
The contributions from other background sources such as single-top production and diboson ( ,
,  ,
,  ,
,  and
and  ) production are expected to be very small according to the simulation, but they also produce peaks similar to the signal. The simulation predicts 190 and 180
  candidates from single-top production and diboson production respectively. These background components are not explicitly considered in the fit. Instead, their expected contributions are subtracted from the fitted signal yield.
6.2. Fit to the jet mass distribution

The observed jet mass distribution is fitted to the sum of  signal and background pdfs. In addition to the combined
  signal yield, all the parameters of the QCD background pdf are allowed to float in the fit. They are: m0 and σm of the sigmoid function
  ; the slope parameters of the two exponential functions and the relative fractions of the sigmoid and the exponential components of the QCD background pdf.
The fit result is shown in figure 3. The χ2 per degree of freedom of the fit is  , which corresponds to a χ2-probability of 32%. The total number of
  jet signal events in the range
  obtained from the fit, after subtracting the diboson and single-top contributions, is
  , where the uncertainty is the statistical uncertainty in the fitted signal yield.
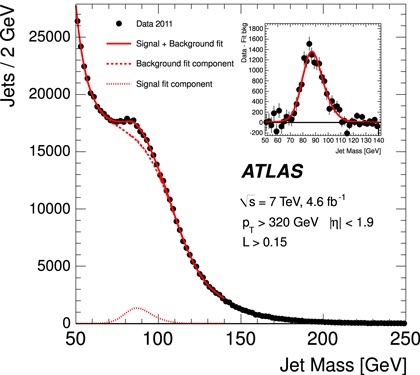
Figure 3. Jet mass distribution of the selected  jets overlaid with the fit result (for illustration, the jets with
  are also shown). The fit range is limited to
  . The background pdf component (dashed line), the signal pdf component (dotted line) and the total pdf (solid line) are shown. The data minus the fitted background component is shown in the inset.
Download figure:
Standard image High-resolution imageThe cross-section is calculated using

where  is the integrated luminosity. The efficiency
  is estimated from simulation using the HERWIG generator and is defined as
  where
where  is the number of W and Z jets in simulation passing the selection cuts and
  is the number of generated W and Z bosons with transverse momentum
  and pseudorapidity
  at the generator level. The efficiency is estimated to be
  , where the uncertainty is due to the jet energy scale, jet energy resolution, and the variation between the efficiencies provided by the different MC generators and settings of generator parameters; these uncertainties are discussed later. The sum of the W and Z hadronic cross-sections is measured to be
for W and Z bosons with  and
and  , where the uncertainty here is statistical only.
6.3. Systematic uncertainties
The systematic uncertainty in the measured cross-section has contributions from the various sources listed in table 1.
Table 1.
Summary of the relative systematic uncertainties in the  jet cross-section from different sources.
| Sources |

|
|---|---|
| MC modelling |

|
| Background pdf |

|
| Signal pdf |

|
| Jet energy scale |

|
| Jet energy resolution |

|
| Jet mass scale |

|
| Jet mass resolution |

|
 contribution contribution |

|
| Single-top and diboson contribution |

|
| W and Z relative yield |

|
| Luminosity |

|
| Total |

|
The uncertainty in the selection efficiency due to the choice of generator and setting of generator parameters for the simulation is estimated by using the alternative MC samples described in section 4. The RMS spread in the efficiencies obtained from various generators and configurations with respect to the default ones is taken as the uncertainty.
In order to estimate the systematic uncertainty due to the choice of QCD background pdf, the fit to the data is repeated with different background models that include: adding an exponential term to the default background pdf; removing one of the two exponential terms from the default background pdf; replacing  in the default background pdf with a different sigmoid function, such as the complementary error function
  , the hyperbolic tangent
  , or the arctangent
  . All the fits including alternative background models describe the data reasonably well and have a χ2-probability larger than 1%. The largest deviation of the fitted signal yield using different background pdfs with respect to the nominal fit is taken as the corresponding systematic uncertainty.
The uncertainty in the fitted signal yield due to the choice of the signal pdf is obtained by repeating the fit using one-dimensional histograms based on alternative MC simulations to model the signal pdf. The largest deviation of the signal yield with respect to the nominal fit is assigned as systematic uncertainty.
The robustness of the fit has been studied with ensembles of pseudo-datasets composed of background and signal events obtained from the MC simulation. The number of background events is set to the value predicted by the simulation. The number of signal events is varied in the ensembles between zero and the signal yield observed in data. Fits to each of the pseudo-datasets with the default signal and background model are performed. No bias in the fitted signal yields with respect to the number of signal events present in the pseudo-datasets is observed.
Uncertainties in the simulation of the detector response are taken into account using dedicated studies of the reconstructed jets. The uncertainties considered are associated with (a) the jet energy scale, (b) the jet energy resolution, (c) the jet mass scale and (d) the jet mass resolution. The systematic uncertainties on the difference between the jet energy scale (JES) [38] in data and simulation are derived using a variety of studies based on in situ measurements and simulation. The uncertainty in the measured cross-section due to (a) the JES uncertainty is evaluated by computing the signal efficiency using alternative signal MC simulation in which the jet energy is modified by one sigma. The jet energy resolution (JER) [39] is studied in dijet events in data and compared to simulation. The uncertainties in the measured cross-section due to (b) the JER is evaluated by computing the signal efficiency using a simulated signal sample which has been modified by applying a Gaussian smearing of the energy resolution function according to the maximum degradation allowed by the JER measurement from data. The uncertainty in the measured cross-section due to (c) the jet mass scale is obtained from data through the introduction of a common offset  to the W and Z signal pdf models (offset to the means of the Breit–Wigner functions) as a free parameter in the fit. The fitted value of the offset is
  , compatible with zero within the statistical uncertainty. The fit to the data is repeated with the value of
  fixed to
  or
or  . The larger deviation of the fitted signal yield with respect to the nominal fit is taken as the corresponding systematic uncertainty. This estimate of the systematic uncertainty has been cross-checked with a different technique using jets composed from tracks geometrically matched to calorimeter jets [6]. The uncertainty in the measured cross-section due to (d) the jet mass resolution uncertainty is obtained by studying the jet mass resolution in simulation. The generators and setting of generator parameters described in section 4 are used to study the effect of the parton shower and the hadronization model on the mass resolution. When a different parton shower or hadronization model is used, a change of 9% in the mass resolution is observed. Instrumental effects are considered using a simulation of the ATLAS detector with a different amount of passive material. The detector response is also studied in a simulation where a different modelling of interactions of high-energy hadrons is implemented [40–42]. The instrumental effects studied produce a change in the mass resolution of the order of 1% . The total systematic uncertainty due to the jet mass resolution is obtained by adding in quadrature the uncertainties from the above-mentioned sources, and the fit to the data is repeated with an increased and decreased value of the peak resolution. The larger deviation of the fitted signal yield with respect to the nominal fit is taken as the corresponding systematic uncertainty.
Uncertainties in the fitted signal yield due to the  contribution are assessed by changing the expected
  contribution within the theoretical uncertainty in the inclusive top-quark pair production cross-section [28] in the fit, and by repeating the fit using alternative
  MC samples generated with different initial/final state radiation settings or with a different algorithm (POWHEG 1.0 (patch 4)). The deviations in the fitted signal yield with respect to the nominal fit result are added in quadrature and taken as the corresponding systematic uncertainty. Similarly, the small expected single-top and diboson yields are varied by
  . The shifts in the signal yield are assigned as systematic uncertainties.
Theoretical uncertainties in the fitted signal yield arise from fixing the ratio of the W to Z event yield in the fit. The fit is repeated varying the relative signal yield of W and Z bosons within its theoretical uncertainty of 2% [11] and the fitted yield variation with respect to the nominal fit result is assigned as a systematic uncertainty.
The uncertainty in the luminosity is  [14]. Other systematic sources considered in the measurement include the finite size of the MC sample, and pileup effects. All of them are found to have negligible effects on the measurement (
 ) . The total systematic uncertainty in the cross-section measurement is calculated to be 18% by adding all the systematic uncertainties in quadrature. The total systematic uncertainty is dominated by the uncertainty in the jet mass resolution.
6.4.
cross-section result

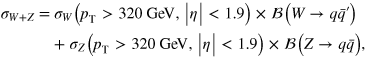
The sum of the cross-sections of W and Z bosons decaying hadronically is measured to be

for W and Z bosons with  and
and  .
.
The measured cross-section is found to be in agreement with the theoretical prediction, based on an NLO MCFM calculation for  production in association with jets, of
  within 2 standard deviations. The uncertainty in the theoretical cross-section represents missing higher-order contributions estimated by varying the factorization and renormalization scales and uncertainties in the PDF of the proton, as detailed in section 3.
7. Study of the effects of various jet grooming techniques
The event sample, selected as described in section 5, constitutes a sample of jets containing a relatively high fraction of boosted W and Z bosons decaying hadronically. It is interesting to use such a sample to study the performance of various proposed jet grooming techniques. The grooming techniques studied here are pruning [43] and trimming [44], designed to suppress soft QCD radiation in jets, and area subtraction [45] designed to correct for the effects of pileup. The grooming techniques and their implementation are described in detail in appendix
7.1. Methodology
The grooming algorithms are applied to jets that pass the selection for the cross-section measurement except for the likelihood ratio requirement. The pruning and trimming algorithms reduce the jet constituents used in the calculation of the likelihood ratio and jet mass. For these grooming algorithms, likelihood ratios ( and
and  ) are calculated after grooming. The cut values after pruning or trimming (
 and
and  ) are chosen to obtain the same background rejection (89%) as the cut on L for the ungroomed jets. The cuts on
  and
and  are applied to the pruned and trimmed jets respectively, and the jet mass distributions are studied. For the area subtraction algorithm, the default jet selection including the L requirement is used, but the jet mass is recalculated after the estimated pileup contribution is subtracted from the jet. No attempt is made to optimize the analysis for the grooming techniques studied.
7.2. Jet mass distributions
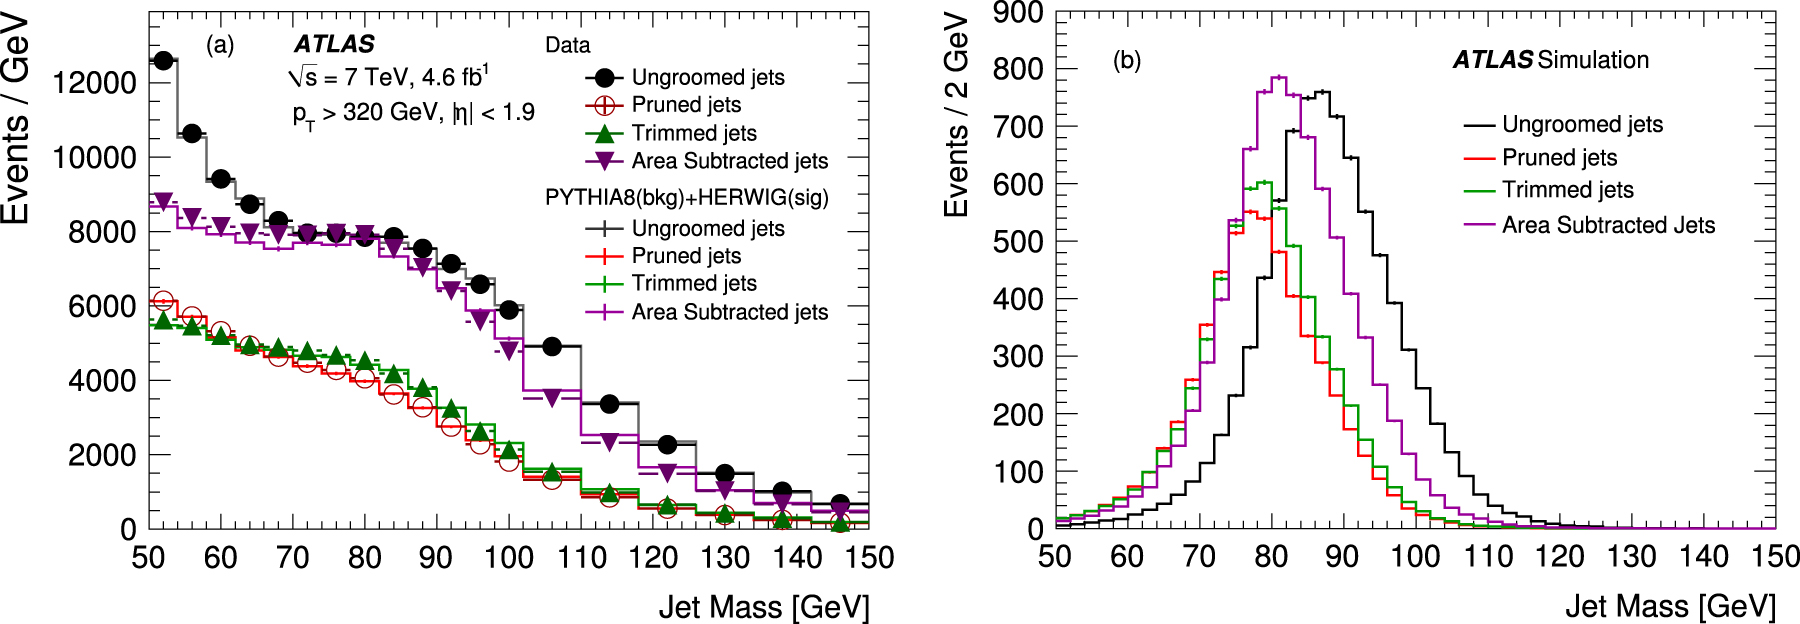
The jet mass distributions obtained after cutting on the new likelihood ratios (for trimming and pruning) or pileup subtraction (for area subtraction) are shown in figure 4(a). Jet grooming causes an average shift to lower jet masses. A reduction in the number of selected jets with masses above 50 GeV by about 50% compared to the ungroomed case is observed after trimming and pruning and by 15% after area subtraction. The shoulder structure in the mass distribution of the QCD jet background is still present after jet grooming.

Figure 4. The jet mass distributions (a) in the MC samples (PYTHIA 8.153 for background plus HERWIG 6.520 for signal) and data and (b) for signal only, after cuts on the likelihood ratios calculated from the ungroomed, pruned, trimmed and area subtracted jet-shape variables are applied.
Download figure:
Standard image High-resolution imageFigure 4(b) shows the mass distribution for simulated  jet signal events after jet grooming. For area subtraction, the mean of the jet mass distribution is shifted lower by about 6 GeV and the number of selected jets is unchanged. After trimming and pruning, the mean is shifted lower by 8 GeV and 9 GeV respectively, and the number of selected jets is reduced by about 30%. The ratio of the width to the mean of the
  jet mass distribution does not change significantly with grooming.
The shapes of the mass distributions of the selected jets in data are compared with simulation in figure 4(a). For the simulated jets, the predicted mass distributions of the  jets and the QCD jets are added. The normalization of the
  jets sample is kept fixed to the NLO prediction described in section 3, while the normalization of the QCD jets sample is adjusted such that the total number of selected jets in the simulation and the data agree. The normalized PYTHIA 8.153 QCD jet Monte Carlo and HERWIG 6.520
  signal Monte Carlo provide reasonable descriptions of the groomed mass distributions while the ungroomed distribution is well described.
The statistical significance of the  signal (assuming the theoretically predicted cross-section) remains about the same before and after grooming. For trimming and pruning, the reduction of background is offset by a loss in signal efficiency, while for area subtraction, the jet mass distributions remain similar, in the signal region, to the ungroomed sample. While systematic uncertainties have not been evaluated, the
  cross-section determined from the groomed jet samples, using the technique described in section 6, gives results compatible with that given in section 6.4 within statistical uncertainties.
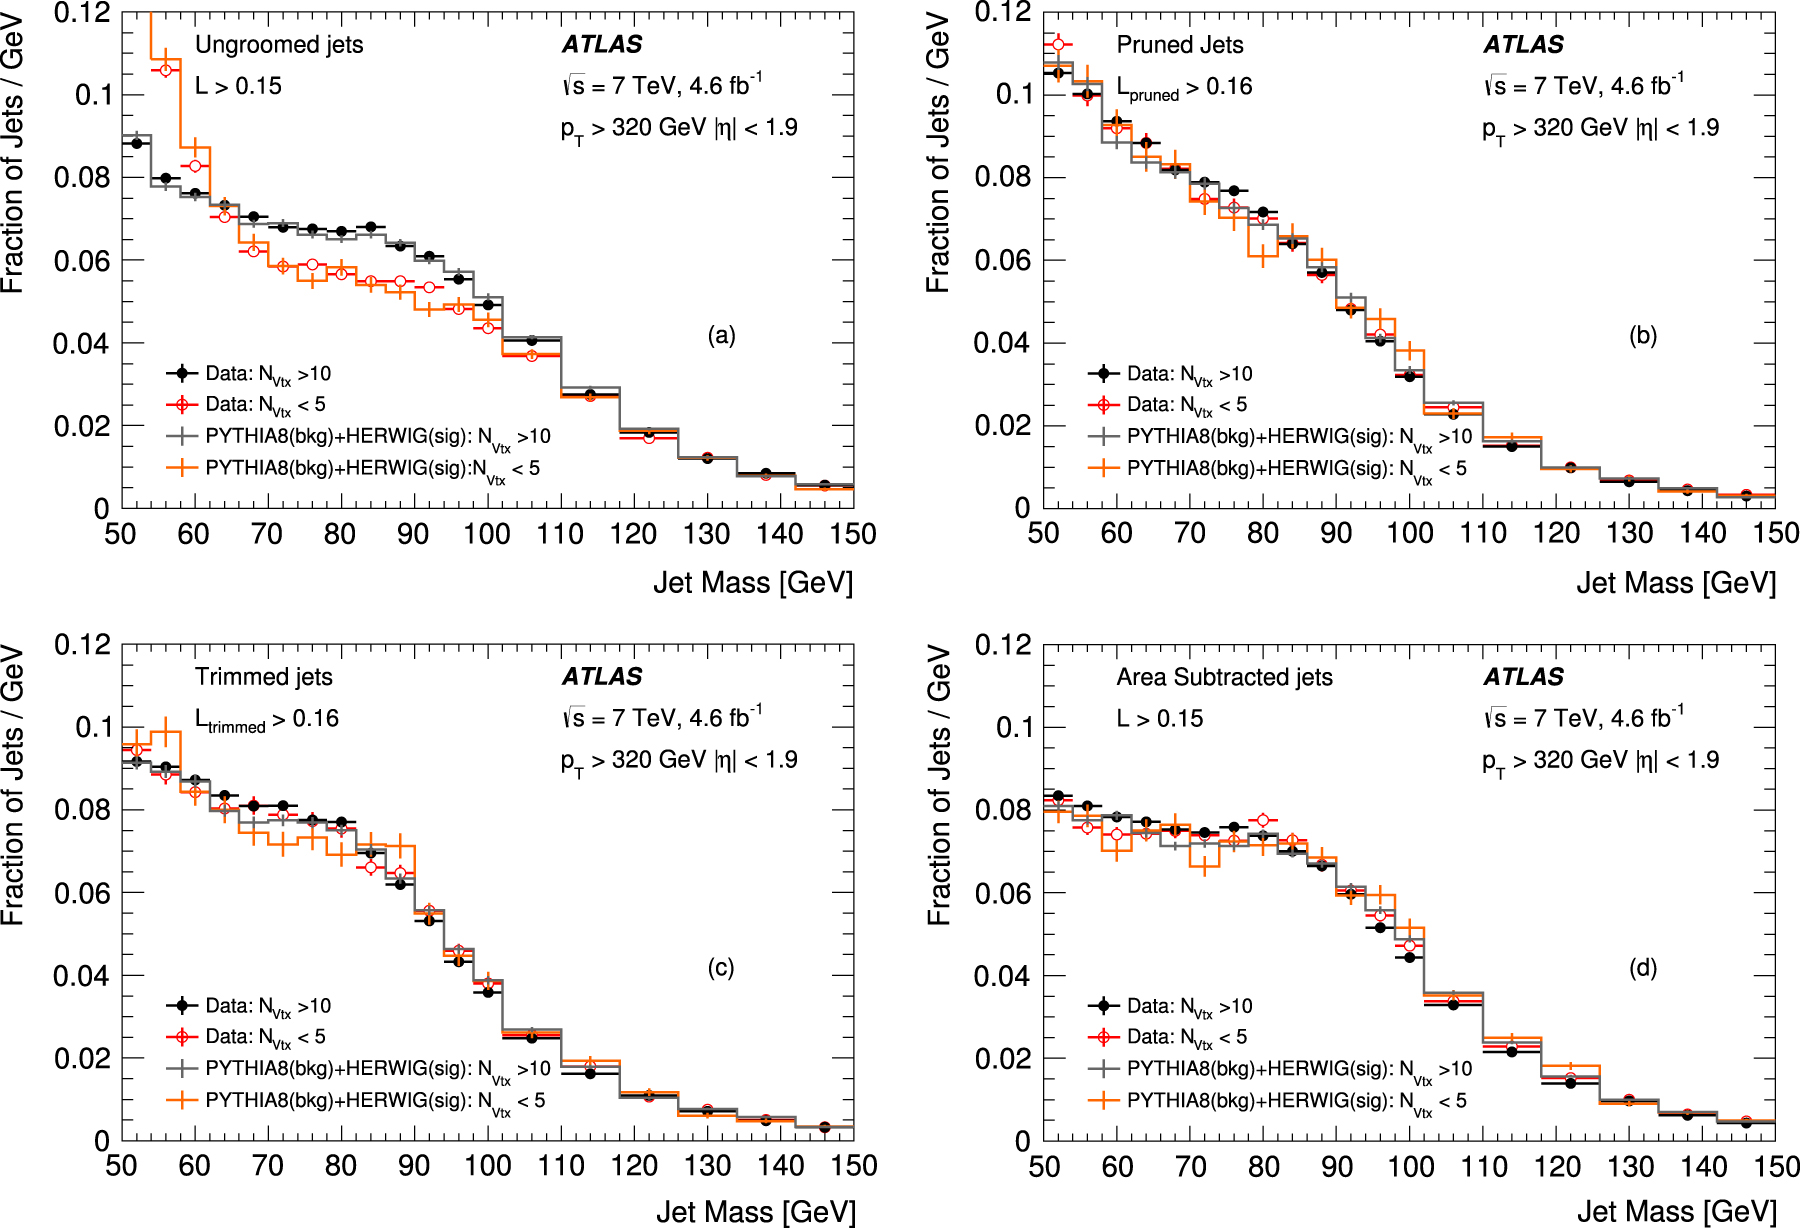
7.3. Pileup dependence
Figure 5(a) shows the effect of pileup on the mass distributions of the ungroomed jets in data and simulation. Events with fewer than five reconstructed collision vertices are defined as low-pileup ( ), events with more than ten as high-pileup (
 ). The low- and high-pileup distributions differ significantly. The effect of pileup in data is well described by the simulation.
Figure 5. The jet mass distributions for low-pileup ( ) and high-pileup (
 ) conditions in MC (PYTHIA 8.153 for background plus HERWIG 6.520 for signal) and data, where
  is defined as the number of reconstructed collision vertices in an event. The cases without grooming, after applying pruning, trimming and area subtraction are shown. The uncertainties are statistical only.
Download figure:
Standard image High-resolution imageFigures 5(b)–(d) show the same distributions for the pruned, trimmed and area subtracted jet samples. The mass distributions after grooming are significantly less sensitive to pileup. The low- and high-pileup distributions for groomed jets are nearly identical both in data and simulation.
8. Conclusion
This paper presents a measurement of the production cross-section of a hadronically decaying boosted W or Z boson with transverse momentum  and pseudorapidity
  in pp collisions at a centre-of-mass energy of
  with the ATLAS detector at the LHC. The measurement is performed by reconstructing boosted W and Z bosons in single jets. The reconstructed jet mass is used to identify the W and Z bosons and a jet substructure method based on energy cluster information in the jet centre-of-mass frame is used to suppress the large multi-jet background. The measured cross-section is:

The measured value is found to be in agreement with the theoretical prediction for the same kinematic range of  , obtained from the NLO QCD calculation, within
  . The total uncertainty in the measured cross-section is of the same order of magnitude as the uncertainties in measurements performed with leptonic decay channels for a similar kinematic region [2–4].
The performance of jet grooming techniques has been studied in the context of this analysis. With comparable cuts on the likelihood ratio and no attempt to optimize the analysis for groomed jets, the signal significance is similar for groomed and ungroomed jets. Jet grooming significantly reduces the sensitivity to pileup, which will be important in later data taking at the LHC, where much higher pileup is expected. In general, the effects of grooming are reasonably well described with PYTHIA 8.153 QCD jet Monte Carlo simulation and HERWIG 6.520  signal Monte Carlo simulation.
Acknowledgements
We thank CERN for the very successful operation of the LHC, as well as the support staff from our institutions without whom ATLAS could not be operated efficiently. We acknowledge the support of ANPCyT, Argentina; YerPhI, Armenia; ARC, Australia; BMWF and FWF, Austria; ANAS, Azerbaijan; SSTC, Belarus; CNPq and FAPESP, Brazil; NSERC, NRC and CFI, Canada; CERN; CONICYT, Chile; CAS, MOST and NSFC, China; COLCIENCIAS, Colombia; MSMT CR, MPO CR and VSC CR, Czech Republic; DNRF, DNSRC and Lundbeck Foundation, Denmark; EPLANET, ERC and NSRF, European Union; IN2P3-CNRS, CEA-DSM/IRFU, France; GNSF, Georgia; BMBF, DFG, HGF, MPG and AvH Foundation, Germany; GSRT and NSRF, Greece; ISF, MINERVA, GIF, I-CORE and Benoziyo Center, Israel; INFN, Italy; MEXT and JSPS, Japan; CNRST, Morocco; FOM and NWO, Netherlands; BRF and RCN, Norway; MNiSW and NCN, Poland; GRICES and FCT, Portugal; MNE/IFA, Romania; MES of Russia and ROSATOM, Russian Federation; JINR; MSTD, Serbia; MSSR, Slovakia; ARRS and MIZŠ Slovenia; DST/NRF, South Africa; MINECO, Spain; SRC and Wallenberg Foundation, Sweden; SER, SNSF and Cantons of Bern and Geneva, Switzerland; NSC, Taiwan; TAEK, Turkey; STFC, the Royal Society and Leverhulme Trust, United Kingdom; DOE and NSF, United States of America. The crucial computing support from all WLCG partners is acknowledged gratefully, in particular from CERN and the ATLAS Tier-1 facilities at TRIUMF (Canada), NDGF (Denmark, Norway, Sweden), CC-IN2P3 (France), KIT/GridKA (Germany), INFN-CNAF (Italy), NL-T1 (Netherlands), PIC (Spain), ASGC (Taiwan), RAL (UK) and BNL (USA) and in the Tier-2 facilities worldwide.
Appendix A.: Definitions of jet-shape variables
In the following the definitions of the jet-shape variables used in the  cross-section measurement are given.
- Thrust minor: the thrust axis [35, 36] of a jet in its centre-of-mass frame, , is defined as the direction which maximizes the sum of the longitudinal momenta of the energy clusters. The thrust minor [35, 36], , is related to this direction and is defined aswhere are the momenta of the energy clusters in the jet rest frame. corresponds to a highly directional distribution of the energy clusters, and corresponds to an isotropic distribution.
- Sphericity: the sphericity tensor [37] is defined aswhere α and β correspond to the x, y and z components of the momenta of the energy clusters in the jet rest frame. By standard diagonalization of one may find three eigenvalues , with . The sphericity is then defined as Sphericity is a measure of the summed squares of transverse momenta of all the energy clusters with respect to the jet axis. By construction. A jet with two back-to-back subjets in its rest frame has S = 0, and S = 1 indicates an isotropic distribution of the energy clusters.
- Aplanarity: the aplanarity [37] is defined asand is constrained to the range. A highly directional distribution of the energy clusters has A = 0, and A = 0.5 corresponds to an isotropic distribution.


Appendix B.: Jet grooming algorithms
The three algorithms studied in this paper behave in different ways with respect to the treatment of the constituents of the  jet candidates. The pruning [43] and trimming [44] algorithms start from the constituents of the anti-kt jets and remove those with kinematic characteristics compatible with coming from soft radiation. These modified lists of jet constituents are used to recalculate the jet-shape variables. In the trimming algorithm the jet is clustered in subjets, and those with small transverse energies are removed. Its main parameters are
  , defined as the radius parameter of the subjets obtained after reclustering the jet constituents (using the kt algorithm), and
  , corresponding to the minimum fraction of the initial jet transverse momentum carried by the subjets that are retained. The pruning algorithm uses an iterative jet reclustering method with parameter
  , defined as the maximum allowed separation between the subjet and the jet, in order to remove large-angle radiation. Denoting by pi the transverse momentum of a subjet, and p that of the jet, only the subjets with fractional transverse momentum
  larger than a parameter
  are retained. Several possible choices of parameters were tested in this study; among them the values {
 = 0.2,
  = 0.03} for trimming, and {
 = 0.3 and
  = 0.02} for pruning were selected, since they give good discrimination between
  jet signal and background with minimal modification of the jet mass distribution for the background.
The contributions to jet energies from the underlying event and pileup have large fluctuations from event to event. The jet area subtraction technique [45] is based on the idea that these contributions can be determined on an event-by-event basis from all jets in the event. For each event, the distribution of transverse energy densities is calculated from all jets with  . The transverse energy density of a jet is defined as the ratio of its transverse energy to its area. The median of this distribution is taken as an estimate of the energy density of the pileup and the underlying event. For each jet, the jet transverse energy is corrected by subtracting the product of the transverse energy density and the jet area from it. The technique results in a modification of the jet four-momentum, including the jet mass. The jet area is determined with the 'active' area calculation technique [45], where a large number of infinitely soft particles, so-called ghosts, distributed evenly in the (η, ϕ) plane are included in the jet clustering.222
The jet area is determined from the number of ghosts that are clustered in the jet.
. The transverse energy density of a jet is defined as the ratio of its transverse energy to its area. The median of this distribution is taken as an estimate of the energy density of the pileup and the underlying event. For each jet, the jet transverse energy is corrected by subtracting the product of the transverse energy density and the jet area from it. The technique results in a modification of the jet four-momentum, including the jet mass. The jet area is determined with the 'active' area calculation technique [45], where a large number of infinitely soft particles, so-called ghosts, distributed evenly in the (η, ϕ) plane are included in the jet clustering.222
The jet area is determined from the number of ghosts that are clustered in the jet.
Footnotes
- 221
ATLAS uses a right-handed coordinate system with its origin at the nominal interaction point (IP) in the centre of the detector and the z-axis along the beam pipe. The x-axis points from the IP to the centre of the LHC ring, and the y-axis points upward. Cylindrical coordinates
are used in the transverse plane, ϕ being the azimuthal angle around the beam pipe. The pseudorapidity is defined in terms of the polar angle θ as . The transverse momentum is defined as the magnitude of the component of the momentum orthogonal to the beam axis. - 222
A second method known as the 'Voronoi' area technique was found to yield very similar results.


