


Abstract
Time-resolved hard x-ray photoelectron spectroscopy (trHAXPES) is established using the x-ray free-electron laser SACLA. The technique extends time-resolved photoemission into the hard x-ray regime and, as a core-level spectroscopy, combines element and atomic-site specificity and sensitivity to the chemical environment with femtosecond time resolution and bulk (sub-surface) sensitivity. The viability of trHAXPES using 8 keV x-ray free-electron-laser radiation is demonstrated by a systematic investigation of probe and pump pulse-induced vacuum space-charge effects on the V 1s emission of VO2 and the Ti 1s emission of SrTiO3. The time and excitation energy dependencies of the measured spectral shifts and broadenings are compared to the results of N-body numerical simulations and simple analytic (mean-field) models. Good agreement between the experimental and calculated results is obtained. In particular, the characteristic temporal evolution of the pump pulse-induced spectral shift is shown to provide an effective means to determine the temporal overlap of pump and probe pulses. trHAXPES opens a new avenue in the study of ultrafast atomic-site specific electron and chemical dynamics in materials and at buried interfaces.
Export citation and abstract BibTeX RIS

Content from this work may be used under the terms of the Creative Commons Attribution 3.0 licence. Any further distribution of this work must maintain attribution to the author(s) and the title of the work, journal citation and DOI.
1. Introduction
Sub-picosecond time-resolved solid-state photoemission spectroscopy has recently emerged as a powerful novel technique for studying the electronic properties of condensed matter. The power of the technique is that it provides direct access to the electronic structure dynamics in materials and at their surfaces on the time scales of the underlying elementary electronic and lattice processes, such as electron–electron scattering, electron screening and thermalization, coherent phonon vibrations, electron–phonon and phonon–phonon coupling, as well as substrate-adsorbate charge transfer or the buildup of surface photovoltages. Time-resolved photoemission spectroscopy generally combines frequency-domain information with sub-picosecond time resolution through a pump-probe scheme in which typically an infrared (IR) pump pulse is used to excite the system whose dynamics is then probed at different time delays by detecting the photoelectrons emitted by ultrashort pulses in the ultraviolet (UV) to soft x-ray regime. When probe pulses in the UV to extreme ultraviolet (XUV) range are used and angular resolution is added, the technique is referred to as time- and angle-resolved photoemission spectroscopy (trARPES) and provides direct information on the momentum-resolved dynamics of valence electrons, including the temporal evolution of electronic populations, band structures, Fermi surfaces, and energy gaps [1–19]. When the probe pulses have higher photon energies, in the extreme ultraviolet to soft x-ray range, the technique becomes time-resolved x-ray photoemission spectroscopy (trXPS), with element specificity, sensitivity to the chemical environment, and tunability of the probing depth, and provides a direct view on the local, atomic-site specific electron dynamics as reflected in the positions, widths, and shapes of core-electron emissions [20–26].
The recent experimental advances in time-resolved solid-state photoemission spectroscopy are intimately connected to the development of ultrashort pulsed light sources, with the evolution continuously progressing from the ultraviolet to ever higher photon energies in the x-ray regime. trARPES experiments are commonly based on Ti:sapphire laser systems delivering intense IR pump pulses, and UV and XUV probe pulses are produced by frequency quadrupling in beta barium borate crystals [27, 28] and higher-harmonic generation (HHG) in rare gases [29–32], respectively. For trXPS measurements, HHG-based setups [23, 33] as well as soft and hard x-ray free-electron lasers [26, 34, 35] have been used. The highest probing photon energy used to date is 8 keV [35], opening the way to a novel technique: time-resolved hard x-ray photoemission spectroscopy (trHAXPES), i.e., trXPS with bulk (sub-surface) sensitivity.
A fundamental factor limiting all variants of time-resolved pump-probe solid-state photoemission spectroscopy are vacuum space-charge effects, i.e., the spectral shifts and broadenings that develop after (and during) photoelectron emission from a surface whenever more than one electron is ejected into the vacuum. Indeed, multi-electron emission is at present experimentally inevitable because both pump and probe pulses have to be sufficiently strong to overcome the low sensitivities and low repetition rates of the experiments. Nevertheless, vacuum space-charge effects can be handled experimentally [26], and they are well reproduced theoretically by simple analytic (mean-field) models [34, 36–38, 40, 41] as well as full N-body numerical simulations [26, 36, 42–45]. Most of the previous studies, however, have focussed on the effects induced by intense probe pulses, i.e., the Coulomb expansion of the probe photoelectron cloud [26, 27, 34, 40, 41, 43–46]. In contrast, vacuum space-charge effects due to the interaction between probe and pump photoelectron clouds, which arises from nonlinear photoemission by intense pump pulses, have not yet been investigated systematically and are less well understood [26, 31, 47].
Here, we establish trHAXPES with x-ray free-electron-laser (XFEL) radiation as a novel and viable time-resolved photoemission technique through a systematic investigation of IR pump- and x-ray probe pulse-induced vacuum space-charge effects in V 1s and Ti 1s emissions from VO2 and SrTiO3, respectively. The excitation energy-dependent spectral shifts induced by the probe pulse, and to a lesser degree the spectral broadenings, are reproduced by N-body numerical simulations. In contrast, a simple mean-field model is found to do a remarkably good job of describing the time and excitation energy dependence of the pump pulse-induced spectral shifts. In particular, the characteristic time dependence of these spectral shifts can be useful in establishing the temporal overlap of pump and probe pulses ('time zero') in time-resolved core-level spectroscopy experiments. The successful extension of time-resolved solid-state photoemission spectroscopy into the hard x-ray regime permitted by this study will allow novel insights into the ultrafast bulk electron dynamics in materials, at interfaces, and in electronic devices.
2. Methods
2.1. Photoemission experiments
All photoemission spectra presented in this work were taken at beamline 3 (experimental hutch EH2) of the SACLA FEL at SPring-8 using ultrashort ( fs), quasi-monochromatic (
 eV) XFEL pulses with a photon energy of ∼8 keV at a repetition rate of 20 Hz (see figure 1). The average XFEL pulse energy was about 7 μJ, with 10% fluctuation over 30 shots, and the pulse energy at the sample was adjusted by inserting Si filters of varying thickness into the beam, with typical attenuation factors in the range of 10 to 20. Photoemission spectra were recorded with a Scienta R4000-10 kV electron analyzer using a pass energy of 200 eV and entrance slit widths of 0.5 mm and 4 mm resulting in nominal analyzer energy resolutions of 0.25 eV and 2.0 eV and total instrumental energy resolutions (photons plus electrons) of about 1.0 eV and 2.2 eV, respectively [35]. The typical acquisition time for one spectrum was about 15–30 min.
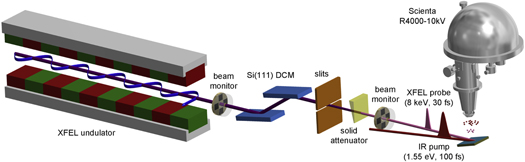
Figure 1. Schematic illustration of the experimental setup used for the time-resolved HAXPES measurements presented in this work (XFEL: x-ray free-electron laser; DCM: double crystal monochromator; IR: infrared).
Download figure:
Standard image High-resolution imageFor the time-resolved pump-probe measurements, IR pump pulses with photon energies of 1.55 eV (3.10 eV), a pulse duration of 100 fs, and pulse energies up to 550 μJ corresponding to a maximum fluence of 22.5 mJ cm−2 were used. The laser system consisted of a mode-locked oscillator, a regenerative 1 kHz Ti:Sapphire amplifier, and wavelength conversion systems, including second harmonic generation, as well as a pulse picker for the synchronization with the XFEL pulses. The IR and XFEL beams hit the sample quasi-collinearly with an angle of about 1° between the beams. The temporal overlap of pump and probe pulses, on the 10 ps scale, was determined using a fast photodiode (G4176-03, GaAs MSM, Hamamatsu) with a rise time of 30 ps. The pump-probe delay was adjusted by an optical delay line over a range of ±1.5 ns with a temporal resolution of 3 fs.
As samples, a La-doped SrTiO3 single crystal and a 140 Å thin pulsed-laser-deposition-grown  film on a TiO2 substrate were used. All samples were excited under an angle of about 15° relative to the surface. The effective spot sizes on the sample (FWHM) were about 600 × 2320 μm2 and 700 × 2700 μm2 for the pump and probe beam, respectively. For the cooling of the samples, a flow-type cryostat was used. Equilibrium sample temperatures were set to 300 K for SrTiO3 and to lower than 270 K for VO2.
2.2. Numerical simulations
The N-body numerical simulations of the XFEL probe pulse-induced space-charge effects were performed using a modified Barnes–Hut tree-code algorithm for Coulomb force calculation [42] and a leap-frog scheme for the integration of the equations of motion, as described in detail in [43, 45]. A typical simulation run starts with the gradual buildup of an N-electron cloud by placing photoelectrons at the surface assuming Gaussian temporal, kinetic energy, and lateral spatial distributions and isotropic emission into the hemisphere above the surface. The simulation run is stopped when the total Coulomb energy of the electron cloud becomes negligible, typically after a propagation time of a few nanoseconds. The space-charge-induced spectral shift and broadening are then quantified by fitting a Gaussian to the final kinetic energy distribution of the electrons that hit the detector. The number of electrons hitting the detector is, however, generally low. The statistical significance of the simulation results is improved by introducing so-called test electrons that feel the Coulomb force of the cloud electrons but do not contribute to it. The test electrons are generated in the same way as the cloud electrons except that their emission angles are chosen such that their trajectories will most likely end in the detector. Possible mirror-charge effects are neglected in the simulations.
2.3. Mean-field models
To reproduce the delay dependence of the pump pulse-induced spectral shift of the probe electrons, we have developed a series of simple models based on the mean-field models originally used to describe the space-charge effects in ultrafast electron diffraction experiments [36–38]. The basic assumption is to approximate the pump electron cloud as a homogeneously charged disk moving at the average pump-electron velocity in the direction normal to the surface (z direction). The on-axis potential of this charge distribution is given by [36]

where N is the number of electrons emitted by the pump pulse, e the elementary charge,  the electric constant, r the radius of the pump beam, and z is the axial distance from the center of the disk. The probe electrons are exposed to this potential, but they can only move along the z axis. The initial separation between a probe electron and the charged disk depends on the pump-probe delay t and is given by

where E corresponds to the kinetic energy of the probe electron for  (probe pulse before pump pulse) and to the average kinetic energy of the pump electrons for
  ; me is the electron mass. The initial potential energy of the probe electron,
  , equals its final kinetic energy increase due to the space charge,
  , as illustrated in figure 2.
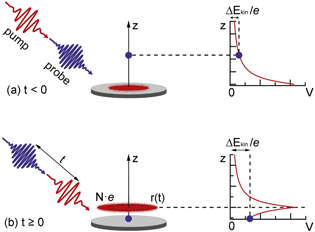
Figure 2. Schematic illustration of the model used to reproduce the dynamics of the pump pulse-induced spectral space-charge shift for (a) negative and (b) positive pump-probe delays t. The N-electron cloud emitted by the pump pulse is modeled by a homogeneous disk of charge with radius r and the probe electron is allowed to move only in the direction of normal emission (z direction). The initial potential energy eV of the probe electron directly after the birth of (a) the pump electron cloud or (b) the probe electron itself corresponds to its final space-charge-induced kinetic energy shift  .
.
Download figure:
Standard image High-resolution imageIn the simplest form of the model, the radial and longitudinal broadening of the charged disk, which should occur for positive delays, are neglected ('1D model'). In two successive extensions of the model, the radial expansion of the disk is included by numerically solving the differential equation for the radius r ('2D model') [37],

and the kinetic energy spread of the pump electrons, N(E), is incorporated by replacing N with a weighted sum  in equation (1) ('extended 2D model').
3. Results and discussion
3.1. Probe pulse-induced space-charge effects
We start our detailed study of vacuum space-charge effects in trHAXPES by investigating the XFEL pulse-induced effects. Figure 3 shows the evolution of the experimental V 1s and Ti 1s HAXPES spectra of VO2 and SrTiO3, respectively, as a function of the average XFEL pulse energy. The pulse energies applied cover a range from about 0.3 μJ to 7.4 μJ. As the XFEL pulse energy increases, the spectra display the expected space-charge effects: significant spectral broadening and a clear shift toward higher kinetic energies, up to a scale of a few eV, where a change of the instrumental energy resolution from 1.0 eV to 2.2 eV has only a minor effect (see upper and lower halves of figure 3(b)). The sharpest V 1s and Ti 1s peaks at the lowest pulse energies have FWHM of 3.5 eV and 2.0 eV, respectively. After quadratic subtraction of the instrumental energy resolution the respective line widths are 3.4 eV and 1.7 eV. By further subtraction of the 'intrinsic' line widths (V 1s: 2.5 eV; Ti 1s: 1.43 eV) as determined by high-resolution HAXPES with the same photon energy [35, 39], the remaining space-charge broadening can be estimated to be about 2.3 eV and 0.9 eV, again respectively for VO2 and SrTiO3.

Figure 3. Evolution of (a) V 1s and (b) Ti 1s core-level photoemission spectra of VO2 and SrTiO3, respectively, as a function of the average XFEL pulse energy ( eV). The spectra in (a) (red dots) and in the top half of (b) (light grey dots) were recorded with the width of the analyzer entrance slit set to 0.5 mm, whereas the spectra in the bottom half of (b) (dark grey dots) were acquired with a 4 mm wide slit. Best fits to the experimental spectra using Voigt profiles are indicated by solid lines.
Download figure:
Standard image High-resolution imageTo determine the pulse energy dependence of the space-charge shift and broadening systematically, we have fitted the experimental spectra with Voigt profiles after subtraction of a Shirley-type background. The best fits to the experimental spectra are included in figure 3. The extracted spectral shifts and broadenings are plotted in figure 4, together with the results of the numerical simulations. The input parameters for the simulations were chosen to correspond to the experimental parameters of the Ti 1s photoemission measurements, i.e., a sharp energy distribution centered at 3030.97 eV and Gaussian spatial and temporal profiles with FWHM of 600 μm and 30 fs, respectively. Measured, as well as simulated, spectral broadenings were calculated using  , where
  and
and  are the initial and final (Gaussian) FWHM of the respective energy distribution curves and the experimental
  values are taken to be the 'intrinsic' line widths from high-resolution HAXPES [35, 39] convoluted with the instrumental energy resolution.

Figure 4. (a) Spectral shift and (b) spectral broadening of V 1s and Ti 1s emissions as a function of the average XFEL pulse energy. The filled symbols are experimental data from different experimental runs. Crosses are from numerical simulations. Power law dependencies of the simulated spectral shifts on the number of photoelectrons are indicated.
Download figure:
Standard image High-resolution imageFigure 4(a) shows that, within the error bars, the measured and simulated spectral shifts display the behavior known from FEL photoemission experiments in the XUV regime [26], i.e., a linear dependence on the FEL pulse energy or on the number of photoelectrons, respectively. Quantitative agreement between the experimentally observed and simulated Ti 1s energy shifts can be obtained, allowing us to establish a correspondence between experimental pulse energies and the number of emitted photoelectrons. The faster increase in the shift of the V 1s peak compared to the Ti 1s peak can be explained by the larger V 1s photoemission cross section [48] and the lower kinetic energies of the V 1s photoelectrons at the 8 keV photon energy used in the experiment [43].
As shown in figure 4(b), the simulated space-charge-induced energy broadening of the Ti 1s emission indicates slightly nonlinear behavior:  . Such power law behavior with an exponent of less than or equal to 1 is generally consistent with previous simulation results at lower photoelectron kinetic energies [26, 34, 43]. However, the measured Ti 1s broadening displays a much stronger deviation from linear behavior, although the experimental error bars are large. Also note that the numerical simulations underestimate the experimental results by a factor of about 2.5. We tentatively attribute these discrepancies to the simple assumptions made on the experimental angle and energy distributions. Specifically, all deviations from isotropic emission and from a monochromatic initial energy distribution can result in enhanced spectral broadening and deviation from a linear dependence on the number of photoelectrons [34, 43].
Nevertheless, the sharpest Ti 1s spectrum at the lowest XFEL pulse energy, as shown in the middle of figure 3(b), demonstrates that HAXPES using XFEL radiation is already possible at a level where the space-charge-induced broadening is significantly lower than the intrinsic line width. It also demonstrates that XFEL-based HAXPES is close to being practical because the acquisition time of the spectrum was approximately 60 min (at a repetition rate of only 20 Hz).
3.2. Pulse energy dependence of the pump pulse-induced space-charge shift
To investigate the pump pulse-induced space-charge effects, we first focus on pump-probe HAXPES measurements performed as a function of the pump pulse energy at a fixed pump-probe delay of −80 ps (probe pulse before pump pulse). Pump pulses with photon energies of 1.55 eV and 3.1 eV were used and the average XFEL pulse energy was set to about 0.9 μJ/pulse to minimize the XFEL-induced space-charge effects. The probed spectroscopic signatures are again the V 1s emission of VO2 and the Ti 1s emission of SrTiO3. The pump pulse energy-dependent evolution of the measured V 1s and Ti 1s spectra is shown in figure 5.
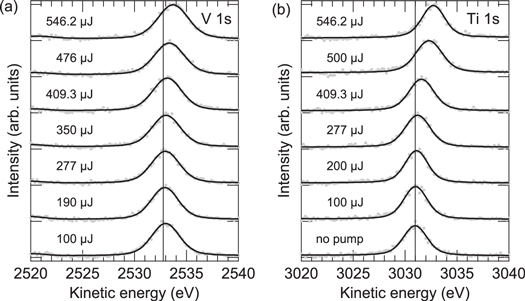
Figure 5. Evolution of (a) V 1s and (b) Ti 1s core-level photoemission spectra of VO2 and SrTiO3, respectively, taken at a fixed pump-probe delay of −80 ps as a function of the pump pulse energy ( eV,
eV,  eV). Best fits to the experimental spectra using Voigt profiles are indicated by solid lines. The vertical lines mark the peak position for a blocked pump beam.
Download figure:
Standard image High-resolution imageSimilar to the XFEL-induced space-charge effects depicted in figure 3, the photoemission spectra are continuously broadened and shifted toward higher kinetic energies when the energy of the pump pulse is increased. Energy shifts up to a comparable scale of 1 eV are observed. However, note that the applied pump pulse energies are larger by 2–3 orders of magnitude. The experimental spectra have again been fitted with Voigt profiles (after background subtraction), and the dependence of the extracted energy shift on the pump pulse energy is shown in figure 6 in a log-log plot.
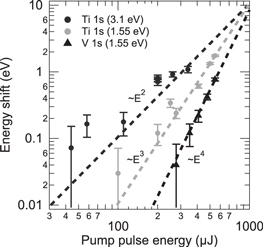
Figure 6. Spectral shift of V 1s and Ti 1s emissions as a function of the pump pulse energy in a double logarithmic plot. The filled symbols are experimental data from different experimental runs. The dashed lines are linear fits to the experimental results. Power law dependencies on the pump pulse energy are indicated.
Download figure:
Standard image High-resolution imageThe data show slopes of +4 and +3 for the 1.55 eV excitations of VO2 and SrTiO3, respectively, and a slope of +2 for 3.1 eV excitation of SrTiO3 (spectra not shown). As in the case of the XFEL-induced space-charge shift, the measured shift is expected to be proportional to the number of the emitted electrons. Here, however, the number of photoelectrons depends nonlinearly on the absorbed pulse energy because of nonlinear photoemission processes. The energies of the incident photons,  , are lower than the work functions, Φ, of VO2 (5.23±0.08 eV [49]) and SrTiO3 (
 eV [50]) so that multiphoton electron emission, in which an electron simultaneously absorbs n photons, has to take place. Such processes indeed become dominant for intense ultrashort laser pulses and the resulting photocurrent densities have been calculated, e.g., using a generalized Fowler–Dubridge model [51, 52]. In this model, the total current density is a sum of partial contributions
  , where I is the light intensity, and the dominant contribution is generally given by the term with the lowest order n for which
  . The experimentally observed slopes of +4, +3, and +2 should thus correspond to 4-, 3-, and 2-photon electron emission processes, an interpretation that is consistent with the photon energies used and the work functions of the investigated materials.
From an experimental point of view, the data in figure 5 demonstrate that pump-probe HAXPES using XFEL radiation can be performed in the strong excitation regime. The highest applied pump pulse energies of 550 μJ correspond to excitation fluences of 22.5 mJ cm−2, a value that is typically not achievable in time-resolved photoemission experiments using photoelectron kinetic energies well below 1000 eV.
3.3. Time dependence of the pump pulse-induced space-charge shift
Finally, we investigate the dynamics of the pump pulse-induced space-charge effects. We focus on the Ti 1s emission of SrTiO3 and determine the delay dependence of the spectral shift for 1.55 eV excitation at two different pulse energies: 250.7 μJ and 500.1 μJ. Figure 7 shows the two sets of experimental spectra, together with the best fits using Voigt profiles. The zero of the energy axis is defined by the position of the Ti 1s photoemission peak at blocked pump beam. The maximum spectral shift and broadening, which increase nonlinearly with the pump pulse energy, are observed when pump and probe pulses overlap in time (at zero delay). The relaxation dynamics happens on the 100 ps time scale and shows a characteristic asymmetry for negative and positive delays, with the relaxation time for positive delays being significantly longer. The measured energy distribution curves of the nonlinearly emitted electron clouds giving rise to this dynamics are displayed in figure 8(a). Note the characteristic high-energy tails indicating that a significant number of photoelectrons has been accelerated to kinetic energies larger than several 10 eV due to the Coulomb explosion of the low-energy electron clouds in front of the surface.

Figure 7. Evolution of Ti 1s core-level photoemission spectra of SrTiO3 as a function of pump-probe delay at pump pulse energies of (a) 250.7 μJ and (b) 500.1 μJ ( eV,
eV,  eV). Best fits to the experimental spectra using Voigt profiles are indicated by solid lines. The vertical lines mark the peak position for a blocked pump beam (
 eV).
eV).
Download figure:
Standard image High-resolution image
Figure 8. (a) Low-energy photoemission spectra of SrTiO3 for two different pump pulse energies ( eV). The photoemission intensities are normalized to the total number of photoelectrons. The open circles indicate that the experimental data are not reliable below a kinetic energy of 20 eV at the used analyzer pass energy of 100 eV. Note, however, that the detailed shape of the spectra in this region has only a minor effect on the results derived from the analytical models. (b) Spectral shift of the Ti 1s emission as a function of pump-probe delay for two different pump pulse energies. The filled circles are experimental data. The dashed lines are from different analytic models. For the 'extended 2D model', 68.3% confidence bands are indicated.
Download figure:
Standard image High-resolution image
Figure 8(b) shows the extracted time dependencies of the Ti 1s spectral shifts and compares the experimental results to the calculated ones as obtained from the series of simple mean-field models introduced in section 2.3. The maximum experimental shifts at time zero are 2.9 eV and 0.7 eV for the higher and lower pump pulse energy, respectively. These values can be reproduced by the models when the number of nonlinearly emitted electrons is set to 1300000 and 315000, respectively, and when the beam spot radius is assumed to be 10% smaller than the measured one.
All three models reproduce the temporal asymmetry in the spectral shift between negative and positive delays that directly reflects the distinct mean velocities of the photoelectrons emitted by the pump and probe pulses. Note that the three models are identical for  (see section 2.3). For longer negative delays, the simple mean-field approach underestimates the experimental results which we tentatively attribute to mirror-charge effects that are not included in the analytical models but should lead to an asymmetric spectral shift in the experiment. For negative delays, the probe electrons do not see the pump-induced electrons or the associated mirror charges for an initial time period (corresponding to the delay) as the pump has not reached the sample surface, and subsequently, the probe electrons see the mirror charges screened by the pump electron cloud. For positive delays, on the other hand, there is an initial time period during which the probe electrons feel the mirror charges much stronger as the probe electrons emerge between the pump electron cloud and its mirror charge cloud.
For  , the 1D, 2D, and extended 2D model give successively better agreement with the experiments. Quantitative agreement at long positive delays can in particular be obtained using the extended 2D model in which the broad distribution of kinetic energies in the pump electron cloud is taken into account. The shorter relaxation time for the stronger excitation can be explained by the presence of faster electrons in the pump electron cloud (see figure 8(a)) that will result in a faster expansion of the pump electron cloud and a shorter interaction time between pump and probe electrons.
The results of figure 8(b) demonstrate that a quantitative description of pump pulse-induced space-charge effects in time-resolved solid-state photoemission is possible and relatively simple when the probe electrons are significantly faster than the electrons emitted by the pump pulse. The sharp peaking of the spectral shift that occurs when pump and probe pulses overlap in time can in particular be used to determine the experimental time zero with a precision of better than ±10 ps.
4. Summary and conclusions
In summary, our systematic experimental study of space-charge effects in time-resolved solid-state photoemission using IR pump and hard x-ray (8 keV) probe pulses, along with N-body numerical simulations and simple analytic modeling, has laid the basis for a novel sub-picosecond time-resolved photoemission technique: trHAXPES. The experimental results demonstrate that trHAXPES can be performed at a repetition rate as low as 20 Hz and at an effective energy resolution at which the XFEL-induced space-charge broadening is significantly lower than the intrinsic core-level photoemission line widths. The comparison of the experimental and theoretical results shows good qualitative and quantitative agreement, permitting us to quantify the number of photoelectrons emitted by the pump and probe pulses, and offers the promise of deconvolving space-charge effects from intrinsic electron dynamics in the strong excitation regime. The characteristic time dependence of the IR-pump-induced space-charge shift in particular allows an efficient determination of the temporal overlap of pump and probe pulses. A major advantage of trHAXPES are the high kinetic energies (of a few 1000 eV) of the probed photoelectrons which make them less sensitive to electronic interaction processes than in time-resolved photoemission techniques using UV, XUV, and soft x-ray radiation. trHAXPES can thus open novel opportunities for probing ultrafast electron dynamics in strongly excited materials, at buried interfaces, and in electronic devices under in operando conditions. The technique will become fully practical as soon as the repetition rates of hard x-ray lasers enter the kHz range, with facilities now being planned that should achieve this.
Acknowledgments
The authors thank the operation and engineering staff of SACLA for their support during the experiments. The experiments were performed with the approval of JASRI (proposal nos. 2013A8050 and 2013B8067). This work was partially supported by the MEXT program 'x-ray Free-Electron Laser Priority Strategy Program'. The authors are grateful to Professor Shik Shin of the University of Tokyo for giving them the opportunity to carry out experiments within the framework of his MEXT program.