


Abstract
Timely and accurately identification of the novel coronavirus disease 2019 (COVID-19) caused by severe acute respiratory syndrome coronavirus 2 (SARS-CoV-2) infection can greatly contribute to monitoring and controlling the global pandemic. This study gained theoretical insight into a novel phase-modulation plasmonic biosensor working in the near-infrared (NIR) regime, which can be employed for sensitive detection of SARS-CoV-2 and its spike (S) glycoprotein. The proposed plasmonic biosensor was created by integrating two-dimensional (2D) Van der Waals heterostructures, including tellurene and carboxyl-functionalized molybdenum disulfide (MoS2) layers, with transparent indium tin oxide (ITO) film. Excellent biosensing performance can be achieved under the excitation of 1550 nm by optimizing the thickness of ITO film and tellurene-MoS2 heterostructures. For a sensing interface refractive index change as low as 0.0012 RIU (RIU, refractive index unit), the optimized plasmonic configuration of 121 nm ITO film/three-layer tellurene/ten-layer MoS2-COOH can produce the highest detection sensitivity of 8.4069 × 10⁴ degree/RIU. More importantly, MoS2–COOH layer can capture angiotensin-converting enzyme II, which is an ideal adsorption site for specifically binding SARS-CoV-2 S glycoprotein. Then, an excellent linear detection range for S glycoprotein and SARS-CoV-2 specimens is ∼0–301.67 nM and ∼0–67.8762 nM, respectively. This study thus offers an alternative strategy for rapidly performing novel coronavirus diagnosis in clinical applications.
Export citation and abstract BibTeX RIS

Original content from this work may be used under the terms of the Creative Commons Attribution 4.0 licence. Any further distribution of this work must maintain attribution to the author(s) and the title of the work, journal citation and DOI.
1. Introduction
Novel coronavirus disease 2019 (COVID-19) is caused by severe acute respiratory syndrome coronavirus 2 (SARS-CoV-2) infection and remains a serious threat to global public health and the world economy. SARS-CoV-2 can transmit rapidly from human to human through various media, such as aerial droplets, direct contact, and fomites [1, 2]. In addition, SARS-CoV-2 appears to have a higher transmissibility than SARS-CoV-1 [3]. Developing rapid, sensitive, specific, and reliable diagnostic methodology for SARS-CoV-2 infection is undoubtedly conducive to controlling infection transmission. To manage the current pandemic, it is considerably significant to develop novel diagnostic tools for identifying SARS-CoV-2 and minimizing testing time.
To date, some diagnostic methods for SARS-CoV-2 infection have been reported. These include reverse transcription polymerase chain reaction (RT-PCR) [4, 5], serological immunological assays (enzyme-linked immunosorbent assay, ELISA; colloid gold-based immunochromatographic assay, CGIA) [6, 7], and chest computed tomography (CT) [8–10]. RT-PCR is a standard testing approach for acute respiratory infection and detecting coronavirus by collecting respiratory secretion. RT-PCR is the most sensitive approach that repeatedly copies specific viral RNA sequences, but it also suffers from some limitations: (1) RT-PCR testing must be performed in certified laboratories by trained technicians, resulting in high manpower cost; (2) apart from the time needed for collection, shipment, and processing, it usually takes several hours to generate a testing report; (3) RT-PCR still lacks the capacity of high-throughput detection oriented for mass population screening; (4) there are some false-negative cases. To decrease testing time, serological immunological assays, including ELISA and CGIA, have been proposed to detect specific SARS-CoV-2 antibodies. Compared to RT-PCR, serological immunological assays have a lower cost and higher testing efficiency. However, in addition to producing false-negative reports, they usually have low sensitivity. It is worth noting that after SARS-CoV-2 infection, the time needed to produce SARS-CoV-2 antibodies in a host is much longer than the time of SARS-CoV-2 nucleic acid replication, likely delaying the treatment window for patients. In addition, CT is also not suitable for rapid and sensitive identification of SARS-CoV-2 infection. Therefore, it is still necessary to develop a diagnostic system suitable for asymptomatic individuals and patients in the early stages of COVID-19.
Biosensors are also promising candidates for rapid, sensitive, real-time, and label-free detection of SARS-CoV-2. It is well known that the structure of SARS-CoV-2 is composed of four main proteins: the spike (S), envelope, membrane, and nucleocapsid proteins [3, 11, 12]. Typically, S glycoprotein is a transmembrane protein that can form a trimmer conformation and protrude in the outer surface of SARS-CoV-2. The two main functional subunits in the S glycoprotein structure are S1 and S2. The former is used to bind to the host cell receptor and the latter is employed to fuse the viral and host membranes [13, 14]. SARS-CoV-2 can utilize the S glycoprotein to gain entry into host cells. More precisely, the host infected by the S glycoprotein specifically binds to the target ACE2 protein expressed in lower respiratory cells [15]. The specific affinity between S glycoprotein and ACE2 provides a promising strategy for designing novel biosensors targeted for screening SARS-CoV-2. Among various biosensing approaches [16–18], surface plasmon resonance (SPR) biosensors are highly applicable for detecting viruses and bacterial pathogens, bypassing the time-consuming techniques used by PCR and ELISA. Wrapp et al [3] first utilized the SPR technique to study the high affinity of SARS-CoV-2 S protein for binding ACE2. More recently, a novel localized SPR biosensor with dual function of plasmonic photothermal and sensing transduction was proposed, showing a low detection limit of 0.22 pM for the selected sequences of SARS-CoV-2 [18].
To date, two-dimensional (2D) material nanosheets have been successfully integrated into conventional SPR sensors, generating ultra-high detection sensitivity [19–22]. Owing to mutual Van der Waals interactions, stacking different 2D material layers to create Van der Waals heterostructures can generate some unprecedented physical and electric properties. However, most of 2D materials-enhanced plasmonic sensors work within a visible window and there are few reports on plasmonic sensors working within an NIR window (∼1000–1700 nm) [23, 24]. In terms of practical SARS-CoV-2 detection, it will be a great challenge to detect saliva and blood specimens using visible SPR sensors [25]. Practical biological specimens are relatively complicated and can absorb visible light. Fortunately, developing NIR SPR sensors can address this issue.
Recently, a new member of 2D material family single-element tellurene has been described theoretically and successfully synthesized in a laboratory [26–29]. Compared to ambient-sensitive phosphorene, 2D tellurene has a higher ambient stability. In addition, theoretical study shows that tellurene has a tunable band gap ranging from direct 0.33 eV to indirect 1.04 eV from bulk to monolayer [28]. Moreover, 2D tellurene nanosheets have a high carrier mobility of 700 cm2 V−1 s−1 and significant optical absorption within a short-wave infrared window [27]. These characteristics make tellurene promising for designing novel NIR optical and optoelectronic devices [30]. It is worth noting that carboxyl-functionalized molybdenum disulfide (MoS2) nanosheets have a high charge carrier transfer feature, which is beneficial for plasmon resonant excitation. Moreover, MoS2 nanosheets have a high affinity to the amine group of targeted protein through COOH surface functionalization [31]. Thus, carboxyl-functionalized MoS2 nanosheets can be employed to immobilize ACE2 protein, which is the ideal target site for binding the S glycoprotein.
Informed by these studies, we propose a novel NIR SPR biosensor for monitoring SARS-CoV-2 and S glycoprotein. Compared to angular modulation SPR sensors, the proposed SPR biosensor created by phase-modulation has higher detection sensitivity. By tuning the thickness of indium tin oxide (ITO) film, tellurene nanosheets, and MoS2–COOH, superior biosensing performance can be obtained. Theoretical predictions showed that 121 nm ITO film/three-layer tellurene/ten-layer MoS2–COOH is the best stacking configuration, providing the highest detection sensitivity of 8.4069 × 10⁴ deg/RIU. For SARS-CoV-2 detection, a theoretical linear detection range for S glycoprotein and SARS-CoV-2 specimen is ∼0–301.67 nM and ∼0–67.8762 nM, respectively. We believe that the proposed biosensor has great potential for identifying SARS-CoV-2 rapidly and accurately in practical clinical applications.
2. Methodology
To overcome the significant drawbacks of conventional metal films, such as easy oxidization (Ag film), easy aggregation (Au film) and band-to-band transitions (Au film), transparent hybrid metal oxide ITO film was selected to support strong SPR in the NIR region [32, 33]. It is worth noting that, without the help of a prism or grating coupler, the ITO film has shown excellent ability to excite the epsilon-near-zero (ENZ) mode [34], resulting in a perfect photon absorption and giant electromagnetic field enhancement [35, 36]. The proposed plasmonic biosensor is composed of rutile prism, BK7 glass, ITO film, few-layered tellurene, and MoS2–COOH overlayer (figure 1). A BK7 glass interlayer was introduced into the plasmonic biosensor to achieve reliable biosensing performance in enhancing detection sensitivity. This is because commercial ITO thin film is usually coated onto a thin BK7 glass slide [33]. Using index-matching fluid, the ITO film deposited on the BK7 glass slide can form a close contact with a hemispherical rutile prism. Then, tellurene nanosheets were deposited onto the ITO film surface. After this, carboxyl-functionalized MoS2 film was stacked onto the tellurene interlayer. Prior to SARS-CoV-2 detection, MoS2–COOH film needs to incubate with ACE2 solution so that enough ACE2 adsorption sites can be generated. It is worth noting that MoS2–COOH thin film not only enhances the biosensing sensitivity, but also specifically binds to the SARS-CoV-2 S glycoprotein. Finally, the topmost layer is a sealed cuvette containing the running buffer. When SARS-CoV-2 S glycoprotein is dissolving in the running buffer, it specifically binds to the ACE2 sites, resulting in a variation in refractive index on the sensing interface and a consequent perturbation for enhanced evanescent field approaching the sensing interface. P-polarized incident light at 1550 nm was applied to excite SPR enhancement in tellurene-MoS2–COOH heterostructures. Unlike other optical detection techniques such as Raman, infrared and fluorescence spectroscopy, there is no significant fingerprint SPR signal for describing the binding interactions between our proposed biosensor and S glycoprotein of SARS-CoV-2. In this study, our proposed biosensor was assumed to be specific for S glycoprotein of SARS-CoV-2 specimen due to the existence of ACE2 protein. It means that, it can produce significant change in differential phase due to the specific binding interactions between ACE sites on sensing interface and glycoprotein protein of SARS-CoV-2. However, if the detection specimen is other analytes, the obtained change in differential phase would be significantly smaller than former specific binding adsorption.
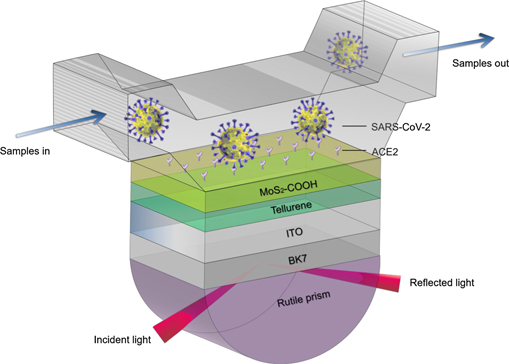
Figure 1. Schematic diagram of rutile prism/BK7/ITO film/tellurene/MoS2–COOH biosensor.
Download figure:
Standard image High-resolution imageThe optical refractive index of each stacked material was employed to calculate and reveal the biosensing ability. Under the illumination of excitation light at 1550 nm, the refractive indices of the first rutile prism layer, second BK7 glass slide layer, third ITO film layer, fourth tellurene nanosheets layer, and fifth carboxyl-functionalized MoS2 overlayer are 2.4532 [37], 1.5007 [38], 0.267 + 1.912 i [39], 4.9476 + 0.2674 i [29], and 2.9510 [40], respectively. In addition, the thicknesses of monolayer tellurene and MoS2 are 0.4 nm [26] and 0.65 nm [41]. It is notable that SARS-CoV-2 S glycoprotein can dissolve in a running buffer composed of 10 mM HEPES and 120 mM NaCl solution. In fact, the refractive index of running buffer can be experimentally measured by an optical sensor. When various concentrations of HEPES solution were added into 120 mM NaCl solution, there is a good linear relationship between refractive index of running buffer and HEPES concentration ranging from 0–120 mM, which can be described as [42]

where y and x are the refractive index of running buffer and the HEPES solution (mM), respectively.
In this study, the concentration of HEPES solution is 10 mM, so the refractive index of the sensing medium (nC) was assumed to be 1.3345.
Additionally, the refractive index of the adsorption sensing layer is proportional to the concentration of target protein, which can be defined as [43]

where nA is the refractive index of the adsorbate and cA is the concentration of adsorbed protein molecules. In addition, dn/dc is the increment of the refractive index. For the binding interactions between two protein molecules, the value of dn/dc is ∼0.186 cm3 g−1 [43].
To study the plasmonic sensing capability of the proposed biosensor, optical propagation methodology, including transfer matrix method and Fresnel equations, is used to calculate and analyze the SPR reflectivity, red-shift in SPR angle, and phase jump from p-polarized light. Theoretically, each material in the six-layer stacked configuration is considered optically isotropic and non-magnetic. The number of ACE2 adsorption sites on MoS2–COOH surface is much greater than the number of S protein. The Unlike angle modulation, two light beams with an identical frequency, namely p-polarized and s-polarized light, are required. The former is used to excite and generate the SPR signal (reflectivity and phase), while the latter is a reference signal to remove the environmental noise. Typically, the phase of reflected light can experience a sharpest jump, which exactly corresponds to the minimum reflectivity in SPR reflectance curve. When the S protein or SARS-CoV-2 specimen was bound to the sensing interface by ACE2 sites, there is a tiny variation in refractive index of local sensing interface. Moreover, the tiny variation in refractive index can produce perturbation for enhanced electromagnetic field, which can be measured by measuring reflectivity, red-shift in SPR angle, and change in differential phase between p-polarized and s-polarized light. Eventually, the detection concentration of S protein or SARS-CoV-2 specimen can be determined by the value of obtained differential phase.
Only p-polarized incident light can match the wave vector of surface plasmon and p-polarized light phase (φp) can be obtained by calculating reflectivity (rp) according to the following equation:

where rp is the reflection coefficient that can be calculated based on Fresnel equations (4) and (5):


where ni and nt are the RIs of two different mediums.
Therefore, the differential phase φd between p- and s-polarized light can be described as

For the proposed six-layer stacked configuration, the total reflection coefficient was calculated using a transfer matrix. Theoretically, the transfer matrix was defined as M, where

and k denotes the kth layer. qk and βk can be respectively obtained using the following two equations: [19]


where θ1 is the angle of incidence for the first stacked layer and ɛk and dk denote the dielectric constant and thickness corresponding to the kth layer, respectively. In addition, n1 is the refractive index of the first layer.
For s-polarized light, the above-stated equations are also applicable, while the parameter qk is different from p-polarized light: [19]

The first boundary of the tangential fields is presumed to be Z1 = 0 and the last boundary ZN−1 is given by [44]:

where U denotes the tangential components of the electric fields at the interface, while V shows the tangential components of magnetic field at the interface.
Therefore, the reflectivity Rp can be calculated using the following relationship: [19]

Phase sensitivity (Sφ) is then calculated to determine the biosensing performance as follows:

where nbio refers to the RI variation of sensing interface due to the adsorption interactions between SARS-CoV-2 S glycoprotein and ACE2.
3. Results and discussion
Generally, light absorption of single plasmonic film, such as Au, Ag, and ITO, is insufficient to produce a highly enhanced evanescent field. However, integrating promising 2D material nanosheets onto these plasmonic films can significantly improve light absorption efficiency, so that there are more photons transferred into the supporting SPR effect. Eventually, a significantly enhanced evanescent field generated at the sensing interface can contribute to the sensitivity enhancement. With the help of transfer matrix theory and Fresnel equations, sensitivity enhancement features based on the proposed biosensor were systematically studied. Employing a running buffer composed of 10 mM HEPES and 120 mM NaCl solution as a sensing solvent (nbuffer = 1.3345), both SPR reflectivity and phase jump originating from the stacked heterostructures (121 nm ITO/three-layer tellurene/ten-layer MoS2–COOH) were determined (figure 2). Under the excitation of 1550 nm, the heterostructures can produce an ultralow reflectivity of 3.8294 × 10⁻⁹ (purple curve, figure 2) when the optimized angle of incidence is 48.7448°, indicating that ∼100% of the incident photons are absorbed and converted into energy to enhance SPR excitation. The phase experiences a sharp jump at the same incident angle (blue curve, figure 2). Interestingly, the sharpest phase jump point exactly corresponds to the minimum reflectivity, indicating great potential for performing the study on phase modulation SPR sensor.

Figure 2. Reflectivity (purple) and phase (blue) curves in terms of angle of incidence. ITO film thickness is 121 nm; tellurene and MoS2–COOH layer numbers are three and ten, respectively; incident wavelength is 1550 nm.
Download figure:
Standard image High-resolution imageIn the NIR region, the imaginary part of the MoS2–COOH layer dielectric function is approaching zero, indicating almost no electric energy loss. However, the dielectric function of both ITO and tellurene is greater, producing energy loss. Hence, ITO, tellurene, and MoS2–COOH layer thicknesses need to be optimized to achieve a balance between photon adsorption and energy loss in the ITO/tellurene-MoS2 heterostructures.
Next, the effects of tellurene-MoS2–COOH Van der Waals heterostructures on both reflectivity and phase jump were systematically studied. Figure 3 shows the reflectivity and phase jump behavior obtained by tuning the number of MoS2–COOH (8–12) and tellurene (0–5) layers. The SPR angle showed an obvious red shift in response to the increasing number of tellurene-MoS2–COOH layers, because more tellurene-MoS2–COOH layers require a greater surface plasmon wave-vector. Hence, a greater angle of incidence is needed to excite the SPR. Typically, the introduction of tellurene-MoS2–COOH can further reduce reflectivity. In absence of tellurene-MoS2–COOH heterostructures, the reflectivity of 121 nm ITO film is 4.8895 × 10⁻³. However, the reflectivity can be further reduced by almost six orders of magnitude to 3.8294 × 10⁻⁹ by introducing three-layer tellurene/ten-layer MoS2–COOH heterostructures. It is worth noting that reflectivity of 121 nm ITO-three-layer tellurene is 1.4536 × 10⁻³, indicating that introduction of three-layer tellurene can reduce reflectivity by a factor of three. It has been confirmed that monolayer MoS2 is able to significantly absorb ∼5.6% of incident photons [45]. Theoretically, the introduction of ten-layer MoS2 can increase incident photon absorption by 56%. It is worth noting that ultralow reflectivity of 3.8294 × 10⁻⁹ shows that the proposed biosensor is not simply stacked. Owing to the strong coherent optical absorption in MoS2 Van der Waals stacked structures [46], the ultralow SPR reflectance can be generated. For the obtained phase signal, the phase jump becomes steeper due to the introduction of tellurene-MoS2–COOH heterostructures. Moreover, the addition of three-layer tellurene/ten-layer MoS2–COOH provides the steepest phase transition behavior. Thus, 121 nm ITO, three-layer tellurene, and ten-layer MoS2–COOH are the best parameters, which can be employed to achieve the highest detection sensitivity.
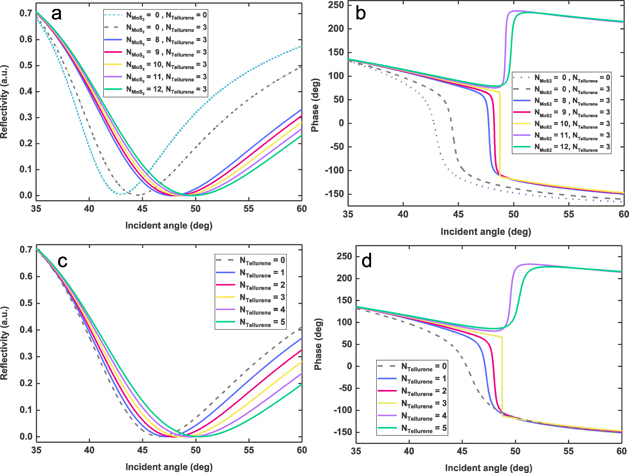
Figure 3. Variation of reflectivity (a) and phase (b) in terms of incident angle by varying the number of MoS2–COOH overlayers (8–12 layers), with tellurene interlayers fixed at 3. Obtained variation of reflectivity (c) and phase (d) in terms of incident angle by varying the number of tellurene interlayers (0–5 layers), with MoS2–COOH overlayers fixed at 10. ITO film thickness is 121 nm; incident wavelength is 1550 nm.
Download figure:
Standard image High-resolution imageTo verify the proposed biosensor's sensing ability, its differential phase (Δϕd) and resonance angle (△θ) were studied in response to an RI variation as low as 0.0012 RIU due to the special binding interactions between S protein and ACE2 anchored on the MoS2–COOH surface. Both photon adsorption and energy loss can be maintained in a relatively balanced state as the thickness of ITO/tellurene-MoS2 heterostructures is optimized. Figure 4(a) shows the change in differential phase in response to the changing ITO thickness and the number of tellurene layers. The largest differential phase (yellow curve) was 100.8833°, corresponding to the stacked configuration of 121 nm ITO film/three-layer tellurene/ten-layer MoS2–COOH. In addition, the second largest differential phase was 79.6862°, generated from 122 nm ITO film/two-layer tellurene/ten-layer MoS2–COOH. In comparison to the results obtained by phase modulation, the red-shift in resonance angle was slight. Figure 4(b) shows the response in resonance angle by changing the ITO thickness and the number of tellurene layers. For various thicknesses of the ITO film, the red-shift in SPR angle increased with growing number of tellurene layers from 0 to 5. Considering an RI variation of 0.0012 RIU in the sensing interface, the biggest red-shifts were 0.0768°, 0.0783°, 0.0797°, 0.0808°, 0.0816°, and 0.0819°, corresponding to zero-, one-, two-, three-, four-, and five-layer tellurene, respectively. Experimentally, these tiny red-shifts cannot be measured by an SPR setup. Conversely, the largest differential phase can be employed to describe the specific protein interaction. Sensitivity can be obtained using equation (12). The largest sensitivity reached the value of 8.4069 × 10⁴ degree/RIU (figure 4(c)). Compared to the largest angle sensitivity of 68.25 degrees/RIU (figure 4(d)), the proposed biosensor composed of 121 nm ITO film, three-layer tellurene, and ten-layer MoS2–COOH can provide an enhancement factor of sensitivity up to three orders of magnitude. To perform sensitive detection for S protein, the best configuration of 121 nm ITO film/three-layer tellurene/ten-layer MoS2–COOH is preferred.
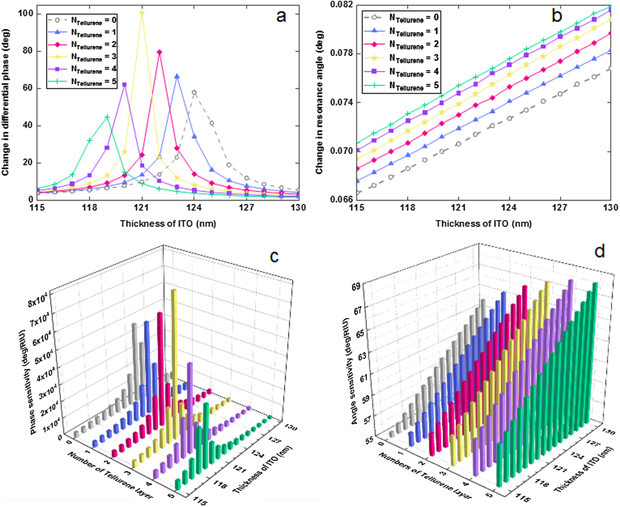
Figure 4. Change in differential phase (a) and red-shifts (b) obtained via angle modulation by varying ITO film (115–130 nm) and tellurene (0–5 layers) thickness due to refractive index variation of 0.0012 RIU. Calculated phase (c) and angle (d) sensitivity by varying ITO film (115–130 nm) and tellurene (0–5 layer) thickness.
Download figure:
Standard image High-resolution imageIn addition, we studied the change in differential phase in response to the refractive index changing from 1.3345 to 1.3357 RIU by controlling the thickness of ITO film (115–125 nm) and the number of tellurene interlayers (figure 5). When ITO thickness was no greater than 119 nm, a stable linear relationship between change in differential phase and the increment of the specimen refractive index was present. In addition, there was remarkable response in differential phase change after addition of tellurene interlayers. However, when the thickness of ITO film was 121 nm, the changes in differential phase were more distinct. Typically, the steepest variation in differential phase (yellow curve, figure 5(d)) was obtained by introducing three-layer tellurene, which was significantly higher than one-, two-, four-, and five-layer stacked configurations. Finally, when the ITO thickness was no lower than 121 nm, the introduction of tellurene could not produce a positive response in enhancing detection sensitivity due to excessive energy loss.
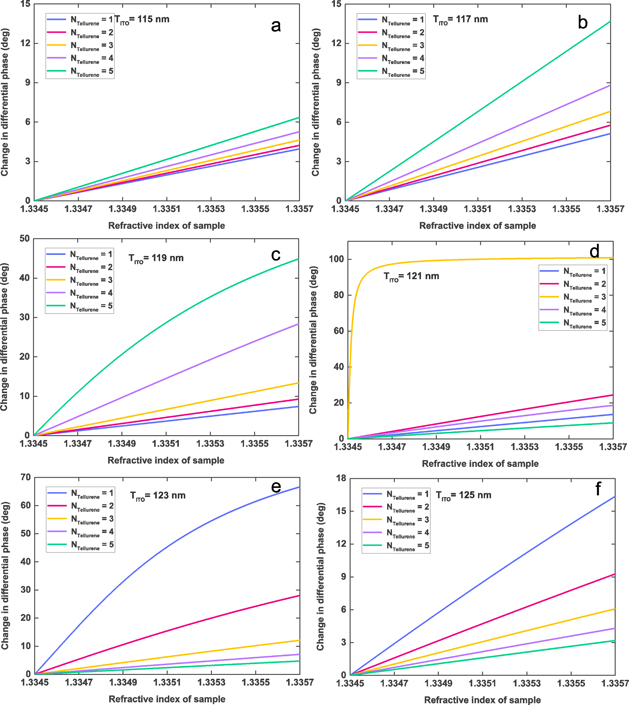
Figure 5. Change in differential phase in terms of change in refractive index on sensing interface by controlling numbers of tellurene (1–5 layers) and ITO film thickness: (a) 115 nm, (b) 117 nm, (c) 119 nm, (d) 121 nm, (e) 123 nm, and (f) 125 nm.
Download figure:
Standard image High-resolution imageFor an extremely small variation of 0.000 0101 RIU, the proposed biosensor had a linear response interval for protein–protein binding interactions, showing great potential for quantitative monitoring of the target proteins. It is worth noting that the molecular weight of SARS-CoV-2 and S protein is about 800 kDa [47] and 180 kDa [14], respectively. To determine the feasibility of detecting SARS-CoV-2 and its S protein using the proposed biosensor, a linear relationship between change in differential phase and various concentrations was plotted using equation (1). Figure 6(a) shows a linear detection interval from 0 to 301.67 nM for monitoring S protein, which can be defined by an equation φd = 0.1367 ∗ c_S protein. Here, c_S protein stands for the concentration of S protein. Moreover, the proposed biosensor also demonstrated a good linear response ranging from 0 to 67.8762 nM for monitoring special binding interactions between SARS-CoV-2 and ACE protein (figure 6(b)). This linear relationship can be described by an equation φd = 0.6077 ∗ c_SARS − CoV − 2, where c_SARS-CoV-2 is the concentration of SARS-CoV-2 specimen. It can be thus concluded that the proposed NIR plasmonic biosensor can specifically monitor and quantitatively identity SARS-CoV-2 and its S protein. Compared to other diagnostic assays, such as PCR and ELISA [48–50], the proposed biosensor has shown significant advantages: (1) it works in the NIR region, which is preferable for detection of practical biological samples, including saliva, urine, and other bodily fluids; (2) complicated sample processes are no longer needed; (3) SPR biosensing testing is an easy procedure, requiring decreased manpower and material cost; (4) SPR biosensing testing is label-free and testing time is shorter.

Figure 6. Excellent linear relationship between detection concentration of target specimens [S protein, (a); SARS-CoV-2, (b)] and change in differential phase based on proposed configuration: 121 nm ITO film/three-layer tellurene/ten-layer MoS2–COOH. Dotted curve demonstrates a linear fit.
Download figure:
Standard image High-resolution image
4. Conclusion
To specifically detect and identify SARS-CoV-2 and its S protein, we proposed a novel NIR plasmonic biosensor by integrating promising 2D tellurene-MoS2–COOH Van der Waals heterostructures with plasmonic ITO film. Interestingly, carboxyl-functionalized MoS2 not only further enhance detection sensitivity, but also capture target protein amine bonds (−NH2). Under the illumination of NIR photons at 1550 nm, excellent biosensing performance can be realized by precisely optimizing the thickness of both tellurene-MoS2–COOH heterostructures and ITO film. The obtained results showed that the best stacked configuration is 121 nm ITO film/three-layer tellurene/ten-layer MoS2–COOH, which can provide an ultralow reflectivity of 3.8294 × 10⁻⁹, approaching zero. With a small variation in RI on the sensing interface, the proposed configuration can offer an ultra-high detection sensitivity of 8.4069 × 10⁴ degree/RIU (nbio = 0.0012). In addition, there was an enhancement factor of detection sensitivity: three orders of magnitude compared to the angle modulation approach. More importantly, the proposed biosensor showed an excellent linear relationship between differential phase and detection concentration of target specimens. For the S protein, the linear relationship can be defined by φd = 0.1367 ∗ c_S protein, where the efficient interval is 0–301.67 nM. To monitor SARS-CoV-2, the linear relationship can be described by φd = 0.6077 ∗ c_SARS − CoV − 2, where the valid detection concentration is from 0 nM to 67.8762 nM. It can be expected that the proposed biosensor has great potential for identifying SARS-CoV-2 rapidly and accurately in practical clinical applications once its safety can be guaranteed.
Conflicts of interest
The authors declare no competing financial interest.
Acknowledgments
This work was partially supported by the National Key R&D Program of China (2018YFC0910602), the National Natural Science Foundation of China(62075137/31771584/61605121/61835009/61775145/61525503/61620106016), the Guangdong Basic and Applied Basic Research Foundation (2020A1515010377), the Project of Department of Education of Guangdong Province (2016KCXTD007), the Guangdong Province Key Area R&D Program (2019B110233004), the Shenzhen Basic Research Project (JCYJ20170818100153423), and the Science Foundation of Shenzhen University (Grant No. 2017000193).