


Abstract
Both preserved gapless states and gapping of Dirac states due to broken time reversal symmetry in bismuth chalcogenide topological insulators with surface and bulk magnetic impurities have been observed and reported in the literature. In order to shed more light on the mechanism of such effects we have performed comprehensive element selective study of the impact of Fe impurity position in the Bi2Se3 lattice on its magnetism. The iron atoms were imbedded in the structure (volume dopants) or deposited on the surface (adatoms) and they revealed striking phenomena. Volume doping preserves non-trivial topology of Bi1.98Fe0.02Se3. Fe atoms not only substitute Bi, but also locate in van der Waals gap. The former are magnetically isotropic, while the latter reveal large magnetic moment (4.5 μB) with perpendicular anisotropy if located near the surface. Majority of Fe adatoms on the surface of Bi2Se3 exhibit weaker moment (3.5 μB) with in-plane anisotropy, as expected for non-interacting species. Negligible interaction between surface electronic states and magnetic adatoms is confirmed by identical vibration spectra of Fe deposited on TI surface of Bi2Se3 and non-TI surface of Bi2S3. The data gathered show how indispensable is the knowledge of the magnetic impurity distribution for applications of bismuth chalcogenide systems.
Export citation and abstract BibTeX RIS

Original content from this work may be used under the terms of the Creative Commons Attribution 4.0 licence. Any further distribution of this work must maintain attribution to the author(s) and the title of the work, journal citation and DOI.
1. Introduction
The best recognized feature of topological insulators (TI) is the existence of metallic states whenever the TI material breaks its continuity, e.g. on the surface. Those metallic states are unusual. The significant spin–orbit (SO) interactions implicate the linear dispersion relation, thus electron responsible for electrical transport are Dirac-like. This also leads to emergence of the Dirac cone with helical spin-momentum states, where spin is perpendicular to the momentum vector. Such extraordinary band structure results in the remarkable property—surface electrons cannot be back-scattered [1]. They are robust against perturbations, as long as the perturbations are nonmagnetic, i.e. as long as the underlying time reversal symmetry (TRS) is not broken. Robust surface states are hoped to be utilized in low power consumption electronic devices, e.g. topological transistors where the topology might be switched by electric field [2] or the devices for memory and logic cells operated by spin transfer torque [3, 4]. In all these devices a contact with magnetic materials, in particular based on iron, is highly possible and TRS may easily be broken. However, breaking of TRS by transition metal may be done intentionally. This may have a profound impact on both basic science and application as e.g. in magnetic topological insulators where the spin current transport based on quantum anomalous Hall effect (QAHE) is hoped to be realized.
Many studies were devoted to the problem of how small amounts of magnetic moments influence the host topology. In TI systems covered by magnetic ions like Mn [5] and Fe [6], surface gap opening was observed, although in this last case gapless states were pushed below the upper surface. On the other hand, low coverage (0.2 monolayer, ML) Fe adatoms on the Bi2Se3 surface [7–9] do not cause the gap in the Dirac cone, in whatever temperature Fe is deposited. For higher coverage increasing Fe content blurs the ARPES spectrum [8] to such an extent that surface states are not observed for 0.9 ML (what is twice we used here in the highest Fe coverage).
Studies of bulk doping show ambiguous results as well. The transfer from metal to insulator on the surface was reported for TI magnetically doped in bulk [10, 11] and the gap opens in Bi1.975Fe0.025Se3 nanowire [12]. However the break in Dirac dispersion relation does not occur even if Mn magnetic atoms order magnetically [13] in Bi1.91Mn0.09Te3. As pointed out in [14] the problem is more complicated and the model composed of two fluids, one 'topology related', prone to TRS breaking and the other, impurity triggered, may resolve the problem.
Not only magnetic atoms affect electronic properties of TI, but sample topology can greatly alter magnetic interactions between magnetic ions, leading to unusual effects. For example, in [11] the evolution of dominating magnetic interactions with increasing Fe content results in topological phase transitions from the gapless paramagnet into weakly ferromagnetic band insulator and reentrance of TI with antiferromagnetic order. Ferromagnetic Fe ordering at low Fe concentrations that turns to AF for higher Fe content was later theoretically rationalized [15]. Enhanced magnetism triggered by topological metallic electrons was also found in MnxBi2−xSeyTe3−y where Mn ions order ferromagnetically with TC rising with decreasing carrier concentration [16]. And magnetism in ferromagnetic insulator (EuS) coupled to a topological insulator (Bi2Se3) [17], was topologically enhanced persisting up to room temperature (instead of 17 K as in the bulk). Finally, electron–phonon interactions were found to be affected by the surface Dirac fermions [18].
Thus a vast variety of problems in topology-magnetism coupling is observed. Recent reports on termination-dependent impact of antiferromagnetism (AF) on topological states [19] and QAHE in bismuth selenides and tellurides [20] requires that all the aspects of transition metal presence in TI, their positions in the lattice, their electronic and magnetic states and how they, in low and high concentration, influence the host materials should undoubtedly be resolved.
In our studies we place a small amount of Fe atoms in Bi2Se3, one of the most promising candidates for application within 3D topological insulators, where the bulk energy gap is relatively large and only a single Dirac cone exists. We are mainly interested in two aspects: the location and magnetic properties of Fe atoms when they are either deposited on the surface of TI, as in Fe/Bi2Se3, or imbedded in its bulk in Bi2Se3:Fe, but also how those Fe atoms influence TRS of the host. Our studies provide wide characterization of Fe atoms interacting with Bi2Se3 single crystals that are prepared with the same growth method and in the same laboratory. The results reveal subtleties in Fe positions and their electronic states that should be considered in further studies and application of bismuth chalcogenide systems doped with transition metal elements.
The paper is organized as follows. First, in the section 2, the single crystalline sample preparation (Purdue University) is presented followed by description of the experimental techniques used. The raw experimental results are shown in section 3 starting from Shubnikov–de Haas oscillation investigations to examine the influence of bulk magnetic Fe on non-trivial topology in Bi2Se3:Fe (section 3.1). Then, in section 3.2, the results of EXAFS measurements of the structural sites where Fe atoms locate and how they affect the Bi2Se3 host structure are presented. These are followed by the description of magnetic properties of Fe atoms as volume dopants as determined by means of SQUID magnetometer (section 3.3) and XMCD (section 3.4). Here also the results of XMCD observation of magnetism of individual Fe adatoms are presented. Finally, in section 3.5, surface electronic states of Bi2Se3 examined by the measurements of Fe submonolayer vibration spectrum probed by means of NIS are described. All the results are discussed in section 4 and our studies are concluded in section 5.
2. Experimental details
Single crystals of Bi2Se3, Bi2Se3:Fe and Bi2S3, (used for comparison in section 3.4) were synthesized via the Bridgman method at Department of Physics, Purdue University. The starting materials: 5 N Bi, 5 N Se (S) and 5 N Fe, were deoxidized in carbon boats in two-zone horizontal furnace in vacuum of 10−5 Pa and then purified further by multiple vacuum distillations under dynamic vacuum of 10−5 Pa until they reach 7 N purity [21]. The introductory synthesis was performed in the same boats at 1170 K, after which material was slowly cooled under controlled Se vapor pressure. Then initially synthesized material was transferred to quartz ampoule which, after evacuation, was placed in three-zone vertical furnace. Temperature gradient in growth zone was set on 0.5 K cm−1. Ampoule velocity across the growth zone was 0.5 to 1.5 mm h−1. As a result, easily cleavable along a – b plane and contamination free samples were obtained.
As checked by x-ray diffraction [22], both, Bi2Se3 and Bi1.98Fe0.02Se3 samples crystallize in rhombohedral structure (R−3m), which is made up of BiSe layers piled up along the c-axis, so-called quintuple layers (QL). The analysis of the chemical composition of Bi1−xFexSe3 was performed using scanning electron microscope FEI Versa 3D FEG. Energy dispersive x-ray spectra were analyzed using Fe K, Bi L, and Se K emission intensities excited with 20 kV electron beam [see figure S1 in supplementary material (https://stacks.iop.org/NJP/22/063020/mmedia)]. Analysis performed on a large surface of approx. 1 mm2 resulted in the mean Fe content of x = 0.017, which is close to the nominal value of x = 0.02. The former will be used in the quantitative analysis of magnetic properties. Bi2S3 crystallizes in an orthorhombic structure (Pnma, U2S3-type) with mixed seven-fold [Bi(1)] and eight-fold [Bi(2)] cationic coordinations [23, 24].
Magnetic field dependence of electric conductivity was measured for Bi2Se3:Fe to confirm that low Fe doping did not affect non-trivial topology of Bi2Se3. The sample was first cleaved at ambient conditions and then six gold-plated brass pins on the springs were placed in direct contact with the sample in conventional Hall probe configuration. Low frequency AC electrical transport measurements were performed in the temperature range 300 mK to 24 K in a TRITON (Oxford Instrument) dilution refrigerator using Nanonis Tramea measurement system with lock-in amplifier. Magnetic field up to 14 T was applied perpendicular to the sample surface, i.e. along c crystal axis.
Local structural properties of dopants were probed by means of extended x-ray absorption fine structure (EXAFS). Measurements were performed at BM23 beamline of European synchrotron radiation facility (ESRF). Spectra were collected using partial fluorescence yield mode from the Fe-doped and pristine single crystals of Bi2Se3 cooled down to T = 10 K. The aim was to determine both the predominant crystal sites of Fe in Bi2Se3:Fe as well as to observe the impact of Fe dopants on surrounding atoms. Therefore absorption edges of all the three constituent elements were probed, namely Fe K-edge (7112 eV), Se K-edge (12658 eV) and Bi L3-edge (13419 eV). Both samples were cleaved ex-situ shortly before inserting into sample holder and kept under high vacuum during measurements. Data analysis was performed using DEMETER package [25]. This involved preliminary reduction of the x-ray absorption spectra, μ(E), i.e. background removal and extraction of EXAFS oscillations using ATHENA. EXAFS data were simulated by FEFF 6 and fitted using ARTEMIS software.
Bulk magnetic measurements were performed using Quantum Design SQUID magnetometer MPMS5. Single crystal of Bi2Se3:Fe was oriented with c-axis along or perpendicular to the applied field.
Surface sensitive x-ray absorption spectra (XAS) and x-ray magnetic circular dichroism (XMCD) measurements were performed at ID08 beamline of the ESRF. L-edge spectra of Fe dopants in Bi2Se3:Fe and Fe/Bi2Se3 adatoms were collected using total-electron-yield mode. Single crystal samples were cleaved at ultra-high vacuum (UHV) conditions at room temperature and then immediately transferred to the experimental chamber and cooled down. Fe adatoms were deposited on Bi2Se3 by means of an e-beam evaporator with the substrate held at T = 10 K. Evaporation yield was previously calibrated and checked by scanning tunneling microscopy (STM) after the measurements. Estimated Fe coverage was 0.1 ML. After Fe deposition, the samples were immediately transferred to the experimental chamber. Magnetic field up to 5 T was collinear to the x-ray beam. Out-of-plane (along c crystal axis) and in-plane magnetic moments were investigated by rotating the sample from φ = 90° (normal incident) to 20° (nearly grazing incident). All the spectra have been normalized at first with respect to the incident beam intensity and secondly to L3 pre-edge intensity.
Nuclear inelastic scattering (NIS) experiment was performed at the nuclear resonance beamline ID18 of the ESRF [26]. Vibration spectra of 57Fe submonolayer deposited on Bi2Se3 and, in comparison, on non-TI Bi2S3 were probed. High intensity synchrotron x-ray beam, monochromatized to the resonant transition in 57Fe nuclei of E0 = 14.412 keV, was varied in the energy range E = E0 − 10 meV to E = E0 + 50 meV, with 2 meV resolution. The samples were first placed in UHV (see [27] for the details of the UHV chamber) and cleaved with the help of adhesive tape. They were then cooled to T = 180 K and covered with ca 0.5 ML of 57Fe adatoms. Coverage was estimated based on evaporation speed (i.e. 0.15 ML per minute) calibrated by a quartz crystal microbalance. Obviously our aim was to place individual Fe atoms on TI surface, even 57Fe isotope would require unrealistically long observation time in case only a few atoms are deposited. After Fe deposition, the samples were immediately transferred to the experimental chamber. NIS measurements were carried out with x-ray beam almost parallel to sample surface; for such geometry the beam focal spot on the sample was of about 10 × 10 μm2. The lowest possible temperature, controlled by the thermometer attached to the sample holder, was 150 K. Impinging photons were resonantly absorbed by 57Fe nuclei in the sample either by coherent or incoherent processes. The first process, nuclear forward scattering (NRS), results in a characteristic time spectrum measured by the avalanche photodiode (APD) placed far away from the sample. NRS was used here to confirm non-magnetic character of Fe submonolayer. Also, its line width reflects the quality of monochromatization and constitutes the instrumental function needed for NIS data processing. The incoherent inelastic absorption results in fluorescence detected by the other APD placed close to the sample to cover the largest possible solid angle. The average count rate in the intensity maximum of the inelastic part was around 4 per second and ca 10 scans, each lasting approximately 40 min, were required to obtain reasonable statistic.
3. Experimental results
3.1. Magnetoresistance of Bi2Se3:Fe
Results of the electronic transport characteristics of bulk doped crystal at low temperature and high magnetic field are presented in figure 1. Longitudinal, ρxx, and Hall, ρxy, resistivities probed at 300 mK versus external magnetic field are shown in figure 1(a). Negative Hall resistivity proves that the charge carriers are electrons, which is the same as for pristine samples of Bi2Se3 [28]. Shubnikov–de Haas quantum oscillations are easily discerned from ρxx as well as QHE plateau from ρxy which proves that Landau-levels pass through the Fermi level with increasing magnetic field. Pure oscillations were extracted from the field dependence of longitudinal conductivity by subtraction of polynomial background. The resulting Δρxx, plotted in ΔρxxB3 vs 1/B parameterization reveal single frequency oscillations. Fourier transform analysis (inset in figure 1(b)) provides the characteristic frequency of quantum oscillations of approx. 230 T. A detailed quantitative analysis of these results will be published elsewhere [29].

Figure 1. Magnetoresistance of Bi1.98Fe0.02Se3 at T = 300 mK. (a) Magnetic field dependence of the longitudinal, ρxx, and Hall, ρxy, resistivity. (b) Shubnikov–de Haas oscillations plotted as σxxB3 vs the inverse magnetic field. Inset shows the spectral intensity of SdH oscillations.
Download figure:
Standard image High-resolution image3.2. EXAFS study of Bi2Se3 and Bi2Se3:Fe
Figure 2 shows the results of EXAFS experiment performed on pristine and Fe bulk doped Bi2Se3 crystals. Respective Bi L3 and Se K-edge spectra of the two samples are identical within experimental accuracy, both, in the near edge structure (figure 2(a)) and in the extended range (figure 2(b)). Edge shape and edge energy position are similar to that observed in Se and Bi pure metals [30, 31]. Local atomic structure around both ions has been derived from EXAFS oscillations. Fits were performed using reduced parameterization involving hexagonal unit cell parameters (a, c), atomic positions and Debye–Waller factors. At first, structural parameters were refined independently for each edge. Secondly, both edges were fitted simultaneously, using common parameterization (supplemental material, figure S2). Structural parameters derived from such local probe are in very good agreement with crystal lattice obtained from x-ray diffraction data. See supplemental materials for more details.
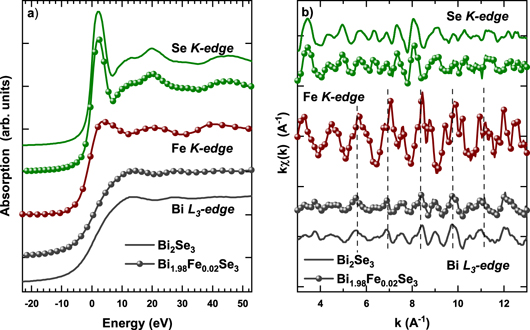
Figure 2. (a) X-ray absorption spectra of Bi2Se3 (solid line) and Bi1.98Fe0.02Se3 (dots) collected at Se K-edge (top), Fe K-edge (middle) and Bi L3-edge (bottom). (b) EXAFS oscillations extracted from extended range of the respective spectra. Characteristic spectral features of Bi sites are marked with dashed lines as a guides for the eye. Low amplitude of oscillations extracted from Bi L3 and Se K-edge spectra is due to significant self-absorption.
Download figure:
Standard image High-resolution imageFe K-edge spectrum of Bi2Se3:Fe crystal (figure 2(a)) reveals the edge position slightly shifted from that of metal, being close to that observed in FeSe and in thin films of Fe-doped Bi2Se3 [32]. However, it does not reveal a pronounced pre-edge structure due to the dipole transition between the 1s initial state and the Fe 3d–Se 4p hybrid orbital, which is considered a fingerprint of FeSe alloy formation [33]. Thus, Fe bulk dopants in the studied crystal are predominantly diluted impurities. Comparison of EXAFS oscillations extracted from Fe spectra to those of Bi and Se provides first approximation of the crystal sites in the case of substitutional doping. As shown in figure 2(b) major features observed in Fe spectrum are common to those of Bi spectrum, which suggests that significant amount of Fe ions substitute Bi sites. Nevertheless, there is a clear admixture of additional oscillations in Fe K-edge spectrum. Since the additional spectral features are not common with Se spectrum, these are attributed to Fe dopants residing in interstitial sites. Detailed analysis of the Fe distribution derived from Fe K-edge EXAFS is presented in chapter 4.
3.3. Bulk magnetization of Bi2Se3:Fe
Field and temperature dependencies of bulk magnetization of Bi2Se3:Fe monocrystal, obtained with a SQUID magnetometer, are shown in figure 3. At 300 K, M(B) is almost linear and negative, due to low Fe content and the dominating diamagnetic susceptibility of Bi2Se3 host. The magnetization at 2 K is clearly anisotropic. When probed along the c-axis (out-of-plane), M(B) is positive at low field and becomes negative at B > 1 T. Such dependence can be attributed to a weak ferro- or paramagnetic component that adds up to the diamagnetic, linear M(B) background that is almost the same as at 300 K. For the direction within a – b plane, M(B) is positive in the entire field range, and the paramagnetic contribution is several times larger than in the case of c-axis. Nevertheless, the magnetization in a – b plane at 2 K and 5 T, reaches only 0.017 μB per Fe ion if the Fe content x = 0.017 is used for calculation. Moreover, M(B) does not reveal any traces of saturation at high field, nor a remanence (and hysteresis) at low field, which were reported for crystals with higher Fe concentration, i.e. Bi1.96Fe0.04Se3 [34] and Bi1.84Fe0.16Se3 [35] respectively.

Figure 3. Magnetization of Bi1.98Fe0.02Se3 single crystal at magnetic field applied along the c-axis (solid points) and within the a–b plane (open points). The diamagnetic signal of the sample holder was subtracted. (a) Field dependence at T = 2 K and 300 K (b) temperature dependence measured at 0.5 T, with the Curie–Weiss law fitted to the in-plane data in the range 20–150 K (solid line).
Download figure:
Standard image High-resolution imageThe temperature dependence of magnetization measured at 0.5 T is shown in figure 3(b), and demonstrates that the magnetic anisotropy of Bi2Se3:Fe persists also at higher temperatures (see, however, the discussion below). The data measured at 0.01 T show exactly the same features in the range 2–30 K, but due to better estimations of different corrections, 0.5 T data were used for further analysis. The in-plane magnetization (DC susceptibility) follows the Curie–Weiss law χ(T) = χ0 + C /(T −θCW) with θCW = −9.7(5) K and the Curie constant, C, that corresponds to an effective paramagnetic moment peff ≈ 2.1(1) μB per Fe ion. A deviation from the fitted curve is visible below 10 K in figure 3(b). Such anomaly may be caused by an antiferromagnetic ordering of magnetic moments, but also by another process, like spin-crossover in Fe2+ ions from S = 2 to S = 0 state, or AF exchange interaction between pairs of Fe moments. The magnetization along c-axis is significantly smaller in the whole temperature range. The attempt to fit the Curie–Weiss law leads to effective moment below 0.8 μB and θCW around −5.8 K, however the quick saturation of the positive component of M(B) at 2 K for the c-axis contradicts this low value and suggests that this paramagnetic component originates from a fraction of Fe moments.
3.4. XAS and XMCD study of Fe dopants in Bi2Se3:Fe and Fe adatoms on Bi2Se3
XAS and XMCD bare results are presented in figure 4. The geometry of the experiment, which was performed at normal, φ = 90°, and near grazing incidence, φ = 20°, with respect to a – b plane is shown in the figure 4(a). Fe L3-edge XAS spectra of Fe adatoms on pristine Bi2Se3 (figures 4(d) and (e)) consist of a strong maximum at approx. 709 eV and a weak shoulder centered at approx. 712 eV in agreement with the spectra of Fe adatoms deposited on Bi2Se3 [9] and Bi2Te3 [36, 37]. There is only a very week angular dependence between grazing and normal incidence in XAS, which is manifested by a slight change of the spectral intensity. However, a strong angular dependence is observed in XMCD. The intensity of the dichroism is approx. two times stronger at grazing incidence, which is in line with the observed in-plane anisotropy of Fe adatoms on Bi2Se3 [9], but opposite to that of Fe adatoms deposited on Bi2Te3 [37].
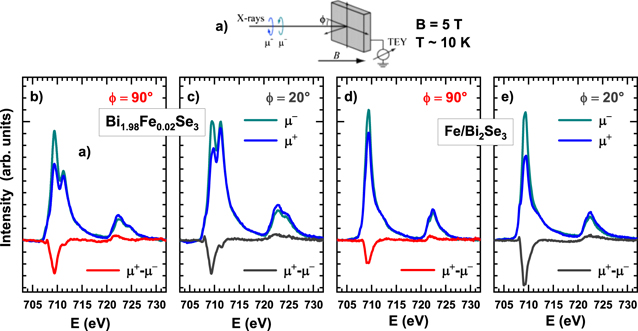
Figure 4. XAS and XMCD at Fe L-edge. (a) Sketch of the geometry of the experiment. Crystals were cleaved parallel to a – b plane and mounted such that c crystal axis was parallel to incident beam at ϕ = 90°. Spectra probed from the surface of Bi1.98Fe0.02Se3 crystal at normal and grazing incidence are shown in (b) and (c), respectively. Spectra probed from 0.1 ML of Fe deposited on pristine Bi2Se3 crystal at normal and grazing incidence are shown in (d) and (e), respectively.
Download figure:
Standard image High-resolution imageXAS spectra collected from Fe atoms embedded in the few nm-thick surface volume of Bi2Se3:Fe show a significantly different shape with respect to adatoms. Fe L-edge XAS spectra for Bi2Se3:Fe are much more complicated forming a two-peak structure (figures 4(b) and (c)). The first peak resembles the one in Fe/Bi2Se3 and thus will mainly be attributed to Fe residing on the surface or, in this case, in VdW gap. Since basically only the surface QL has a peculiar electronic structure [38] and the penetration depth of soft x-rays in our material does not exceed 7 nm (i.e. probes ca 10 QL), we infer that the electronic structure of Fe ions within VdW gap is close to those on the surface or XAS cannot see the subtle differences. Peak around 711 eV is strongly enhanced with respect to the spectra of adatoms and it shows a significant angular dependence. A similar behavior was ascribed to surface oxidation [39]. However, such behavior was confirmed in three independent measurements—two at former ID08 beamline of ESRF and one at PEEM/XAS beamline of Solaris (at room temperature)—all performed on different in-situ cleaved crystals. Thus we attribute this feature to the presence of Fe3+ ions localized in distorted octahedral crystal field of Se anions, namely Fe ions in Bi substitutional sites. Fe L3-edge XMCD signal probed on Bi2Se3:Fe is slightly weaker than that of adatoms. It does not show any significant angular dependence. However, when it is normalized to XAS, it is stronger at normal incidence. It is due to intensity evolution of the dominant peak at higher energy, which is more pronounced with x-ray quanta nearly parallel to a – b plane. As such, the out-of-plane easy magnetization direction is expected. Such scenario is analyzed in details in chapter 4.
3.5. Vibrational characteristics of Fe/Bi2Se3
We have used nuclear inelastic and resonant scattering of gamma radiation to check what factors define the vibrations of individual adatoms on the surface of TI, in particular to see how topologically protected surface electrons in Bi2Se3 affect these vibrations, in comparison to those on non-TI material, Bi2S3. Although the latter crystal exhibits different crystal structure than Bi2Se3, it is also layered structure with alternating blocks of Bi–S polyhedral units stacked perpendicular to the short b-axis, leading again to the easy cleavage in (010) plane. The cleavage plane is rectangular, in contrast to hexagonal in Bi2Se3 case, as revealed by LEED (supplemental material, figure S3). Both materials also differ electronically: while Bi2Se3 is a topological insulator with a bulk band gap of 0.3 eV, Bi2S3 has rather large gap of 1.3 eV. Finally, due to structure defects, well described in the literature, and ensuing Fermi energy position not in a bulk gap, both materials are metallic. However, since surface metallicity is of different kind (spin-momentum confinement on Bi2Se3 surface), the difference in lattice vibration of Fe individual adatoms deposited on those surfaces is expected. NRS signal for Fe/Bi2Se3 is presented in figure 5; comparison with metallic Fe assures that the surface layer was not magnetically ordered. Since exactly the same preparation conditions were applied for Bi2S3, the same was assumed for Bi2S3, although, due to rougher surface, the direct measurements for Bi2S3 were not possible.
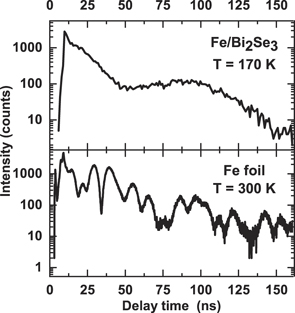
Figure 5. NRS spectra for Bi2S3 as compared to ferromagnetic Fe. The results serve as a proof that deposited Fe was not ferromagnetic.
Download figure:
Standard image High-resolution imageThe bare results of NIS measurements are shown in figure 6. Data processing to extract partial phonon DOS g(E) from inelastic scattering data was done following the procedure described in [40, 41]; we estimate that due to subtraction difficulties of the elastic central part, g(E) are reliable for E > 3.5 meV.
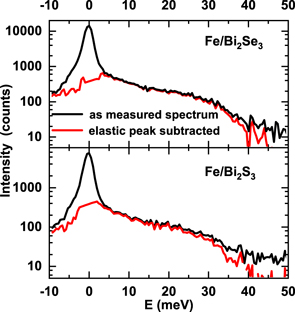
Figure 6. Bare NIS data (black lines) for Fe/Bi2S3 (TI) and Fe/Bi2S3 (non-TI), and after the central, elastic, peak was subtracted (red).
Download figure:
Standard image High-resolution image4. Discussion
Owing to the vast experimental evidence presented above, wide, yet in some cases complex picture of the physical characteristics of Fe atoms as dopants or adatoms in/on Bi2Se3 crystals is obtained. Below we discuss the possible sites in the host lattice where the volume Fe dopants settle and how they influence the host topology. We analyze both volume dopants' and adatoms' magnetic states that reveal magnetic properties of the material, but also help to specify further lattice sites where Fe atoms reside. Finally, we discuss how the topological surface influences vibrations of Fe adatoms; those vibrational states allow also to see the vibration state of the host.
4.1. Bi2Se3:Fe
Experimental evidence on topological character of Fe-doped Bi2Se3 crystals was gathered using the studies of magnetic field influence on electrical conductivity. First of all, as it was mentioned in section 3.1, we observe quantum oscillations in ρxx and QHE plateau in ρxy. Positions of the minima in Δρxx (longitudinal conductance after subtracting polynomial background), figure 1(b), are related to Landau level indices N and positions of the maxima in Δρxx are related to N + 1/2. The Landau fan diagram i.e. Landau level index N vs 1/B is shown on figure 7. The linear fitting to the data with the slope fixed to frequency of oscillations (obtained from Fourier analysis) gives the intercept equal to −0.452, so its absolute value is close to 0.5. According to [1], the phase of the SdH oscillations is proportional to the Berry phase. If phase of oscillations is 0.5 the Berry phase is π. Thus we interpret our results as an evidence of non-trivial topology of our sample [1, 42] (although some authors claim that the intercept may also depend on other factors [43]).
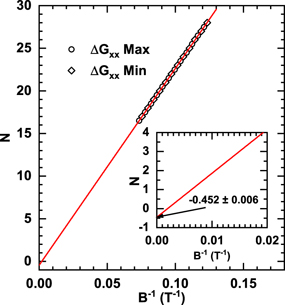
Figure 7. Landau fan diagram of Bi1.98Fe0.02Se3. The linear fit shows that the intercept is close to N = −0.5 (see close-up) which corresponds to the Berry phase equal to π.
Download figure:
Standard image High-resolution imageBesides the phase of the oscillations, also their frequency contains useful information. Based on the Onsager relation, SdH oscillations frequency depends on Fermi wave vector which is linked to surface carrier density [44]. In our case, frequency of 230 T (see figure 1(b)) is higher than frequencies for pristine samples (106–190 T) depending on sample quality and the method of sample preparation [28, 42, 45, 46]. This means that Fe doping increases surface carrier density, possibly due to Fe intercalation in the van der Waals gap (as supported by EXAFS results presented below). Similar effect was observed in Fe-doped single crystal of Bi2Se3 [47] and was also explained by ionized iron atoms that occupy interstitial positions in the crystal lattice adding up to the concentration of conduction electrons.
The results of magnetotransport measurements, together with their comparison to the literature data, are shown in table 1.
So although surface topology is not affected by magnetic dopants, this material cannot be considered as magnetic topological insulator since the net magnetic response is weak (as shown in figure 3). On the other hand, a significant XMCD signal is found (see figures 4(d) and (e) and the discussion below). All these indicate variety in doping character, which are checked by quantitative analysis of Fe K-edge EXAFS oscillations.
Table 1. Comparison of the results of the SdH parameters derived from magnetotransport data of Bi2−xFexSe3.
| x | SdH freq. [T] | SdH phase | Source |
|---|---|---|---|
| 0 | 106–190 | 0–0.5 | [1, 28, 45, 46] |
| N/A | 227–242 | — | [47] |
| 0.02–0.06 | 162–242 | — | [48] |
| 0.02 | 230 | 0.452 ± 0.006 | This work |
aPhase of SdH oscillations is proportional to Berry phase of the system.
Since our EXAFS results exclude any bulk intergrowth of FeSex phases, observed e.g. in [49], four sites in Bi2Se3 occupied by Fe were considered following the observation of [32]. These were: octahedral (Oh vdW) and tetrahedral (Td vdW) interstitial site positions in van der Waals gap between two Se layers, octahedral interstitial site within quintuple layer (Oh QL) and substitutional Bi site (see figure 8(a)). Fits of EXAFS results were performed simultaneously in the k-space range 3.0 ÷ 12.2 Å−1 and R-space range 1.75 ÷ 5.5 Å−1. Thus, at least four coordination shells around Fe were covered as well as trifold multiple scattering paths. The free parameters of the fit were unit cell parameters, indices of Bi and Se2 sites as well as Debye–Waller factors. None of the fits performed assuming only one doping site was satisfactory (figures 8(b)–(e)). Therefore further analysis was performed by fitting two-site occupation of Fe atoms testing all possible combinations. Such a procedure resulted in a very good match of the model and the experiment for only one combination of Fe sites (figure 8(f)): distribution of Fe atoms between Bi substitutional sites (approx. 20%) and Oh interstitial sites in the van der Waals gap (approx. 80%). Unit cell parameters drawn from this fit are shown in table S1 of the supplemental materials.

Figure 8. Bi2Se3 structure with possible Fe sites considered and spectra simulations for each case. Here the modulus of Fourier transform of the EXAFS signal at the Fe K-edge and the real part of it are shown. Since no single Fe position can account for experimental data, Fe was assumed to be present in two positions and the best fit is shown in (f).
Download figure:
Standard image High-resolution imageSimilar conclusions on two-site occupancy were drawn in [50], where the same crystal as we used, grown in the same laboratory, was measured by scanning tunneling spectroscopy (STS). Two different shapes of Fe-related structural defects were reported, with 10% and 90% abundance of Fe positions. STS of the latter resembles the shape of Fe adatoms deposited on Bi2Se3 surface [9]. Thus it is attributed to interstitial position within VdW gap. Moreover, the discussion in [50] suggests that the valence state of Fe may depend on the actual site the atom occupies. Fe position in volume doped Bi2Se3 was also investigated in [51]: STM/STS and atomic force microscopy (AFM) experiments on Fe-doped Bi2Se3 single crystal reveal features resulting from two Fe dopant positions, interstitial and Bi-substitutional ones, as in our studies.
Summarizing, our analysis shows that Fe atoms in Bi2Se3:Fe act both as substitutional dopants replacing Bi, like usually described in the literature, but also, to the larger extent locate in octahedral interstitial positions in the van der Waals gap, the former suggesting strong bonds with Se atoms. This result can rationalize our XAS spectrum, probed at three angles, in particular the evolution of the higher energy peak, 711.2 eV, (figures 4(b) and (c)) which is, as the discussion below shows, ascribed to Fe3+ ionic state of certain fraction of dopants imbedded in the bulk.
At first, this higher energy peak of XAS and resulting XMCD was fitted with Brillouin-like functions (see the inset in figure 9(a)) following the procedure described in [52] and assuming temperature of the sample of 10 K. It showed that magnetic anisotropy is negligible for the site responsible for the peak, while the magnetic moment is approx. 2.5(±0.5) μB i.e. the value typical for bulk Fe. Then, using the values obtained from the first fit (i.e. keeping magnetic moment and anisotropy energy of one site fixed) another fit with two sites contributing to the entire width of 2p3/2 multiplet (from 705 to 720 eV) was performed using the same approach (figure 9(a)). It showed an out-of-plane anisotropy of the other magnetic site, which contributes mainly to the lower energy peak of XAS.

Figure 9. Integrated XMCD/XAS vs magnetic field as derived from the spectra shown in figure 4. Note much smaller dependence on magnetic field direction for Fe-doped sample (a) in comparison with Fe placed as adatoms on top of Bi2Se3 (b) suggesting stronger and reversed magnetic anisotropy in the latter. The fit to the high-energy peak 711 to 713 eV yielded nearly isotropic moment as shown in the inset to figure 9(a). Experimental setup is presented in the inset of figure 9(b).
Download figure:
Standard image High-resolution imageThe out-of-plane and magnetically isotropic sites contribute to the net paramagnetic moment of near surface Fe dopants as 70 (±20)% and 30 (±20)%, respectively. The anisotropy energy and the moment of the out-of-plane site is 4 (±3) meV and 4.5 (±0.8) μB, respectively. Assuming that the two sites revealed by EXAFS and XMCD magnetization fits correspond to each other, the most likely attribution is that Fe atoms in the Bi substitutional sites are responsible for the 711.2 eV peak and have paramagnetic moment close to that of a bulk Fe of negligible anisotropy. Then Fe atoms in Oh interstitial in the van der Waals gap (responsible for the ca 709 eV peak) in the surface region (few QLs) possess magnetic moment of 4.5 μB, characteristic of single-like atom with an out-of-plane anisotropy. As shown below (and also in [9]), the anisotropy in this case is opposite to that observed for Fe adatoms, but similar to that of Co adatoms on Bi2Se3 [53].
The out-of-plane anisotropy and a relatively large magnetic moment of Fe dopants settled in the van der Waals gap (i.e. also on the sample's surface) should break the time reversal symmetry and thus influence the topology. This is not the case as we observe by electronic transport and ensuing Berry phase of π (figure 7), which means that the magnetism of Bi2Se3:Fe is weak. Such a weak magnetism is revealed by our bulk studies with SQUID magnetometer (figure 3) where only a paramagnetic signal (with the effective moment of peff = 2.1 μB drawn from temperature dependence of susceptibility), strongly diminishing with temperature and with weak AF interactions was found in a – b plane, while diamagnetic signal was measured along c direction. Qualitatively similar anisotropy in Bi1.84Fe0.16Se3 was observed in [35].
The Bi2Se3 host is reported [54] to be an isotropic diamagnet with temperature-independent susceptibility χ = −3.0 × 10⁻⁷ emu g−1. The susceptibilities measured for our sample at 300 K were −1.47 × 10⁻⁷ emu g−1 and −2.89 × 10⁻⁷ emu g−1 in a – b plane and along c axis, respectively. Assuming Fe concentration of 0.017, the estimated paramagnetic susceptibility is 0.44 × 10⁻⁷ emu g−1, the value lower than diamagnetic susceptibility of the host. Curie–Weiss law fits well to the experimental data (see figure 3) in temperature range below 150 K (where paramagnetic signal dominates) therefore we expect that at 300 K the influence of the crystal field on Fe is small and magnetocrystalline anisotropy is negligible.
We subtracted the estimated paramagnetic susceptibility (0.44 × 10⁻⁷ emu g−1) value from experimental susceptibilities thus estimating the anisotropic diamagnetic susceptibility of Bi2Se3 as −1.9 × 10⁻⁷ emu g−1 and −3.3 × 10⁻⁷ emu g−1 in a – b plane and in c direction, respectively, comparable to the diamagnetic susceptibility of the sample holder (subtracted). Even if some paramagnetic anisotropy of Fe atoms exists, this shows that Bi2Se3 is probably an anisotropic diamagnet, similar to Bi2Te3 [34, 54].
The situation at low temperature, 2 K, is different. If a diamagnetic signal of −0.004 μB for Bi2Se3 formula at 5 T and at 2 K is assumed (as estimated from the moment for Bi2Te3 in [54] and their diamagnetic susceptibilities for Bi2Se3 and Bi2Te3) then our mean Fe saturation moment of 1.3 μB/Fe atom (estimated from the effective moment using g = 2) gives the saturation moment of Bi2Se3:Fe equal to 0.15 emu g−1. This value is much higher than the observed 0.024 emu g−1 (figure 3(a)). This suggests that Fe magnetic moments may order antiferromagnetically at 10 K, where the clear anomaly in χ(T) is observed (figure 3(b)), or part of Fe atoms switch to a low spin state.
Such AF order may also roughly rationalize the Fe anisotropy visible at 2 K. Since the majority of Fe atoms reside in QL gap as our EXAFS results show, the anisotropic surrounding can force AF-coupled Fe moments pointing along c direction. The collection of such coupled pairs would present a higher magnetic in-plane than out-of-plane signal. At temperature higher than 10 K the moments decouple, but the small out-of-plane anisotropy may still exist at sufficiently low temperatures, what is qualitatively in accord with our XMCD results (where an out-of-plane anisotropy was found). It should be noted, however, that Fe atoms probed by this surface sensitive technique are different, because of proximity of the surface symmetry and a possible influence of 'topological' electrons (what is visible, e.g. by their large moment of 4.5 μB/Fe atom).
Several studies of Fe-doped Bi2Se3 have already been performed and the variety of results show that magnetic state of Bi2Se3:Fe is not well understood. For example, antiferromagnetic interactions observed in Curie–Weiss dependence were theoretically predicted [55] along with effective moment per Fe atom of 5 μB, which is substantially higher than the peff value observed in our experiment. Also Kulatov in their [56] DFT studies found antiferromagnetic order in Fe-doped Bi2Se3. In their calculations, Zhang et al showed [55] that Fe ions should locate in cation site substitutional positions, as assumed while growing single crystals. In line with this, another group [57] found a homogeneous magnetism that cannot be attributed to magnetic impurities. In their experimental studies of Bi2−xFexSe3 (for x = 0.1–0.3), a coexistence of two complicated magnetic structures were found, one below 10 K (i.e. where the anomaly in our results is seen—figure 3(b)) and the other up to 250 K. Magnetic ordering at 40 K was also reported in Bi2Se3 nanowire doped with two times more Fe than in our case (x = 0.05) homogeneously distributed in a whole sample [12]. Also in single crystalline Bi1.96Fe0.04Se3 a higher and almost saturated moment (0.01 μB/f.u. in 5 T when normalized to our concentration of Fe) was found [54]. Finally, the antiferromagnetic correlations were theoretically predicted by the interaction of native Se vacancies with Fe dopants that turn to ferromagnetic ones when the number of Se-vacancies around Fe increases [58]. This result suggests that although the crystal is structurally homogenous, its magnetic response is site dependent and can easily be changed. In general, magnetic state in Fe-doped Bi2Se3 is not unambiguously defined and may be unstable due to concentration fluctuations of Fe.
However not only a homogenous magnetic structure of Bi2−xFexSe3, but also magnetic impurities were considered to explain its magnetic properties. For example, Huiwen [49] suggested that the weak magnetic signals in Bi2Se3 doped with Fe are extrinsic rather than caused by either Fe replacing Bi or intercalation. Instead, the possibility of inclusions of nanocrystals of FeySez to the parent phase was demonstrated for x = 0.075 and higher Fe concentrations. They may be ferrimagnetically and/or antiferromagnetically ordered, with varying magnetic moment depending on the exact Fe to Se ratio. The creation of some additional phase was confirmed by the direct observation of two phases Bi2Se3 and Fe7Se8 in the nominally Bi2−xFexSe3 compound with no indication of Fe incorporation into Bi2Se3 lattice [49]. Similar conclusions on FeySez nanoclusters-based extrinsic magnetism in Bi1.84−xFe0.16CaxSe3 were reported in [35].
In our experiments no assumption of spurious phases needed to fit EXAFS spectra and the reasonable attribution of two Fe sites to magnetic moments was proposed. Thus, we conclude that our observations point to the intrinsic properties of Bi2Se3:Fe. However further effort is needed to better characterize magnetism in low Fe-doped Bi2Se3 and explain possible antiferromagnetic ordering realized in such magnetically diluted system. Despite the origin of magnetism of Bi2Se3:Fe, our and most of other results on low Fe-doped Bi2Se3 suggest that Fe ions do not affect topological properties of this compound, as do Mn dopants [59].
Location and magnetic properties of bulk and near surface Fe dopants in Bi2−xFexSe3 are summarized in table 2.
Table 2. Comparison of the probed/assumed Fe location, saturation magnetic moment and anisotropy of Fe in Bi2−xFexSe3.
| x | Fe location | Saturation magnetic moment [μB/Fe] |  | Source |
|---|---|---|---|---|
| N/A | Int | 0 | — | [47] |
| 0.04 | Int | 0.5 | — | [54] |
| 0.333 | Bith | 4.5–5.00 | — | [60] |
| 0.002 | Bisurf/intsurf | — | — | [61] |
| 0.2–0.3 | Bi | 0.34 ± 0.07 | <0 | [57] |
| 0.083 | Bith | 4.73–4.99 | >0 | [55, 62] |
| 0.083 | Bith | 3.07–3.42 | — | [58] |
| 0.083 | Bith | 3.702 (μs) | — | [56] |
| 0.0596 (μl) | ||||
| 0.05 | Binw | — | — | [12] |
| 0.083 | Bith,surf | 3.482 (μs) | +6 | [63, 64] |
| 0.144 (μl) | ||||
| 0.02 | Bisurf | 2.5 ± 0.5 | ∼0 | This work |
| intsurf | 4.5 ± 0.8 | −4 ± 3 | ||
| Bi/int | 1.3 | >0 |
aBi–Bi substitution; int–interstitial/intercalated. bEa > 0 indicates easy magnetization within a-b-plane, while Ea < 0 indicates easy magnetization direction parallel to c-axis. cLow spin Fe2+ ththeory. surfnear surface. nwnanowires.
4.2. Fe/Bi2Se3
The influence of Fe adatoms on Bi2Se3 surface have been reported by others e.g. [7–9, 33]. Thus, we have collected only a specific set of experimental data using XMCD and NIS. The former were probed for the sake of comparison to that of bulk dopants. The latter, to our best knowledge made for the first time, are expected to provide an answer to the question on whether magnetic adatoms reveal vibrational states of the host crystal (strong bond) or vibrate independently (weak bond).
Magnetic state of the surface Fe adatoms were drawn from XAS spectra characterized by one strong absorption peak shown in figures 4(c) and (d). We have fitted the resulting XMCD signal to the Brillouin-like function, see figure 9(b). Similar to Bi2Se3:Fe, two components were considered, in line with STM observations of two sites of adatoms [65]. Paramagnetic Fe moment of 3.5 (±1.0) μB is similar for Fe atoms occupying both sites: exhibiting in-plane easy magnetization direction (85%, Ea = 3 (±1) meV) and a weak out-of-plane anisotropy (15%, Ea = 0.5 (±0.5) meV). We attribute the first group to the surface Fe adatoms with their 3d states interacting with, possibly, host surface electronic states characterized by linear dispersion relation. This is in rough agreement with more 2D Fe environment of the surface atoms resulting in an enhanced magnetic moment [66]. We also suggest that the second group of Fe atoms exhibiting weaker out-of-plane anisotropy are those that migrated from the surface and behaving like single Fe atoms for which the enhanced magnetic moment is expected as well. It is quite reasonable to assume that Fe atoms migrated into either quintuple layer, or even replaced Bi atoms, as it was with Bi2Se3:Fe. This means that the electronic state of the second group is representative for Fe in QL, but also, to a lesser extent, for Fe in Bi sites.
The notion of Fe atoms migrating from the surface to the first van der Waals gap is in accord with our XMCD observation for Bi2Se3:Fe. These Fe atoms, strongly influenced by the surface, have a weak out-of-plane anisotropy and relatively high moment, both similar to the ones that constitute 70% of the atoms seen by XMCD in Bi2Se3:Fe. Similar conclusions were drawn in [33], where XAFS measured on 0.3 ML Fe deposited on single crystalline Bi2Se3 at temperature close to our experiment revealed that many of Fe atoms migrated into the substrate substituting Bi atoms. Location and magnetic properties of Fe atoms deposited on Bi2Se3 are summarized in table 3.
Table 3. Comparison of the probed/assumed Fe location, magnetic moment and anisotropy of Fe adatoms on Bi2Se3 surface.
| Coverege [ML] | Tsubstrate [K] | Fe location | Magnetic moment Fe [μB] | Ea | Source |
|---|---|---|---|---|---|
| <0.2 | — | N/A | 4.0 | <0 | [6] |
| >0.2 | >0 | ||||
| 0.01 | 10 | Adatoms | 4.0 | +1.9 | [9] |
| 0.0625 | — | Adatomsth | 2.9 | −(5.16–5.8) | [67] |
| 0.013 | 295 | N/A | 1.2 (μs) | >0 | [8] |
| 0.66 (μl) | |||||
| 0.3 | 160 | Bi | — | — | [33] |
| N/A | — | Bith | 3.482 (μs) | +6.02 | [63, 64] |
| 0.144 (μl) | |||||
| 0.1 | 10 | Adatoms | 3.5 ± 1.0 | +3.0 ± 1.0 | This work |
| Bi/int | −0.5 ± 0.5 |
aBi–Bi substitution; int–interstitial/intercalated. bEa > 0 indicates easy magnetization within a-b-plane, while Ea < 0 indicates easy magnetization direction parallel to c-axis. cAssumed from ARPES. ththeory.
Summarizing, surface sensitive XMCD showed anisotropic paramagnetic response for Fe on top of Bi2Se3, or between QL, but more isotropic one for Fe migrating into volume of Bi2Se3. Thus, the results of our observation suggest that Fe adatoms on or close to the surface behave as in nearly 2D symmetry or as individual entities (large magnetic moment due to low dimensionality of Fe, not mutually interacting, but linked to the environment (anisotropy).
In order to further check the Fe–Fe and Fe–host link, we have tested vibrational states of Fe adatoms using NIS. This is not only important as a mean to check the cohesive energy of Fe adatoms, especially in view of the idea to control quantum transport in TI via magnetic doping, but can, in principle, provide the information of the underlying topological nature of surface electronic states. Indeed, the surface electronic states of TI, due to their special properties, their spin confinement to momentum and the lack of backscattering, might react with the Fe adatoms in different way than do 'normal' electron states as those on top of non TI material, in particular insulating one. As reported, [6, 17, 67], these different interactions can e.g. give rise to the topologically enhanced magnetism, but may also affect the Feynman–Hellman forces that define vibration spectrum of adatoms, resulting in strong electron–phonon interactions [18]. These forces are both of ionic and itinerant-electron origin and the fact that the number of itinerant electrons are different in TI and non-TI matter, despite a small number of those in TI, may lead to different elastic properties. Also, the electron–electron interactions affect vibration spectrum [68] and those interactions, again taking into account spin-momentum confinement, may be different.
The phonon DOS curves of 0.5 ML Fe on Bi2Se3 and on non-TI material, Bi2S3, drawn from the NIS data in figure 6, are presented in figure 10. It is clear, bearing in mind poor statistics, especially in Bi2S3, that DOS calculated from the experimental data are practically the same for both samples. Apparently, either Fe adatoms, in amount used here, do not differentiate between the surface they sit on, or the differences caused by these surfaces are too subtle to be discerned. Consequently, only DOS calculated for Bi2Se3, as a representative for 0.5 ML Fe on QL, will be further discussed.
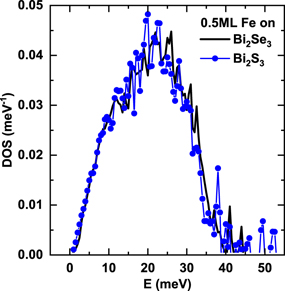
Figure 10. DOS drawn from the results of NIS measurements on Bi2Se3 (TI) and Bi2S3 (non TI) covered with 0.5 ML of 57Fe.
Download figure:
Standard image High-resolution imageWe have compared our experimental DOS for Fe/Bi2Se3 (i.e. also for Fe/Bi2S3) with the phononic density of states of those systems that can be relevant to our case. First, we have compared our results with the vibrations of the surface iron layer of 20 ML thick Fe single crystalline film [73]. We have found that both NIS curves coincide well in the higher energy part of spectra provided some small shift to lower energies of this Fe surface DOS is done (figure S4 of supplemental material). In both cases: the '2.5D' symmetry of Fe atoms on the surface of Fe thin film, and 2D symmetry of Fe atoms forming monolayer patches on Bi2Se3, are lower with respect to the 3D symmetry of Fe atoms in the bulk. Therefore the similarity in vibration spectra in both cases could be expected. However this is very improbable that nominally 0.5 ML Fe deposited in our experiment really created monolayer Fe patches, in particular on two different surfaces (Bi2Se3 and Bi2S3, with different surface structure) and most likely (although this needs to be experimentally verified) Fe does not grow layer-by-layer, i.e. not only monolayer but also double- and three-layer Fe patches could be formed. Although our XAS/XMCD data from figure 4(b) does not indicate cluster formation, the higher amount of Fe deposited (0.5 ML instead of 0.1 ML grown for XMCD experiment) and the higher sample temperature at which Fe atoms were deposited and NIS measurements were performed, may promote 3D growth.
Therefore, we have also compared our results with phononic DOS of a few MLs of 57Fe grown on W (110) substrate [69]. Such a structure is more relevant to our experimental conditions and, additionally, modeled substrate-layer mismatch present in both systems that can also, apart from symmetry, affect 0.5 ML Fe/Bi2Se3 vibrations. As shown in figure 11, the vibrations of 3 ML Fe/W nicely reproduce our results at higher energies. Note also that 3 ML Fe/W DOS contains a small portion of 1 and 2 ML Fe vibrations spectra (as seen from a characteristic shoulder, a reminiscence of the peaks at 13–14 meV in 1 and 2 ML Fe/W DOS, see figure 11). Such 1 or 2 ML Fe patches are very probable also in our case, which makes DOS of 3ML Fe/W from [69] even more realistic in simulating the vibrations of our Fe structure formed on Bi2Se3.
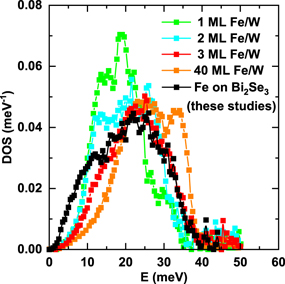
Figure 11. Comparison of Fe on Bi2Se3 DOS with Fe vibrations of up to 40 ML grown on top of [110] surface of tungsten single crystalline film [69].
Download figure:
Standard image High-resolution imageWe have thus an experimental confirmation of our hunch that majority of adatoms deposited on the surface of Bi2Se3 (and Bi2S3) form ca 3 ML high clusters. This explains a main part of DOS in the range 15–35 meV.
Apart from higher energy dynamics, our experiment revealed the existence of low energy vibrations, with the shape estimated by subtraction of our experimental DOS obtained for 0.5 ML Fe/Bi2Se3 and 3 ML Fe/W DOS from [69]. The product of subtraction shows a characteristic dome-like peak at ca 10 meV, presented in figure 12 (blue bold triangles). This dome-like low energy vibration spectrum may come either from isolated Fe adatoms on top of QL, or Fe atoms that migrated into the structure of QL. It may characterize individual Fe atom dynamics or, in case these atoms are strongly bound with the surroundings, mainly the vibration spectrum of the host crystal.

Figure 12. Experimental phonon DOS for Fe/Bi2Se3 (bold black squares) together with experimental phonon DOS for 3 ML- thick of 57Fe layer on top of (110) W single crystal (red line, [69]). Blue bold triangles result from subtraction of both curves (Fe/Bi2Se3-3ML Fe/W). This is compared with calculated QL vibrations for Bi2Te3 (green line, [70]) and Bi2Se3 (magenta line, [71]), as well as measured by NIS Sb2Te3 (cyan line, [72]). In this last case, DOS for Sb2Te3 was scaled to approximately match our results at low energy.
Download figure:
Standard image High-resolution image
The problem of adatoms migration was addressed in [74] and, according to these studies, the temperature of our experiment is sufficiently low to assure that Fe remains on top of the surface. However, our results from XMCD suggested that Fe adatoms might migrate into the body of QL layer, the effect possibly enhanced by the higher temperature of NIS experiment. Similar conclusion may be drawn from [33] where it was observed at 160 K that Fe atoms went into the first QL substituting bismuth atoms. Apparently, some movement of Fe atoms to the bulk and their ensuing vibrations cannot be excluded.
We may also expect that some isolated atoms may reside on QL surface and contribute to the observed Fe vibrations. There are conflicting reports on how the Fe adatoms behave on the TI surfaces, i.e. to what extent they behave as individual atoms, with their electronic states possibly modified by host surface states, or they form well defined surface patches which interact weakly with the substrate. Although it was well established that there are two Fe surface positions, either of comparable surface energies [9] or considerably differing energetically (75.8 meV) [67], 'infrequent hopping events of a single Fe atom' [9] between these two positions were observed, even at 0.3 K. Hopping at such a low T would suggest a very limited Fe–host interactions i.e. Fe acted as free atoms, with only their outer s electrons transferred into host surface, imposing some force on Fe atoms that can be observed by Fe atom vibrations. Also in [8], where Fe atoms were deposited at RT, 3d spectra of individual Fe atoms are atomic like, what is also seen from relatively large orbital momentum, a few times larger than in bcc iron (although the spectra widen with increasing Fe coverage, possibly indicating increasing Fe-atom substrate coupling). In such case, our low-energy part of DOS would describe rather weakly linked Fe atoms, the feature possibly irrelevant to the host properties.
On the other hand, the same authors [9] report a strong Fe-d orbitals hybridization with electronic states from the surrounding crystal and influenced by its crystal fields, which leads to an in-plane magnetic easy axis. At higher Fe coverages (>0.1 ML), atomic multiplet features disappear due to the formation of Fe clusters of variable size [9]. In this scenario, Fe adatoms behave as electron donors [74] rather strongly interacting with the host material. Iron atoms strongly bound to the Bi2Se3 surface was found also in [75] studies. In such case Fe vibrations might reflect QL vibrations.
Since neither vibration of individual Fe atoms on Bi2Se3 nor on Bi2S3 were reported in literature, we have compared our spectra only with vibration DOS of Sb2Te3 (experiment: NIS [72]), surface layer of Bi2Te3 (calculated [70]) and bulk Bi2Se3 (calculated [71]), see figure 12. The additional comparison with bulk Bi2Se3 [76] and Bi2S3 [77] (both measured by Raman spectroscopy) are presented in figure 3S of the supplementary information. In all the results the characteristic peak structure, 5–8 meV, 12–13 meV and 15–18 meV is present and this structure is roughly reproduced in our results for 57Fe/Bi2Se3. Therefore and also taking into account a good agreement of our DOS at higher energies with 3 ML Fe/W vibrations, we conclude that our 0.5 ML 57Fe layer reproduces vibrations of both the host material, possibly its first QL, and ca 3 ML thick clusters of iron.
5. Conclusions
The knowledge on the distribution of magnetic ions is a prerequisite to the control of TRS breaking. The present trend and efforts are to break TRS intentionally introducing magnetic order that may trigger QAHE behavior creating-edge dissipationless states. It has been recently observed in highly doped bismuth telluride [19, 20], where additional Mn layers are formed leading to magnetic ordering. Such effects are not found in bismuth selenide, which results in the absence of QAHE. To grasp a role of transition metal atoms in different topologically nontrivial hosts, we aimed to determine the impact of small amounts of magnetic ions on bismuth selenide system. We have specified the distribution of surface and volume Fe dopants in the Bi2Se3 lattice and observed the impact of their lattice positions on local and volume magnetic properties, which are crucial for possible TRS braking.
First, we have found that Fe atoms in Bi2Se3:Fe do not disturb nontrivial topology of the host—Berry phase, drawn from SdH oscillations in conductivity, is π. Volume Fe dopants reside in two positions as shown by EXAFS. Most of them, nearly 80%, occupy octahedral voids in van der Waals gap between two quintuple layers. Those atoms have magnetic moment of approx. 4.5 μB/Fe with the out-of-plane anisotropy revealed by XMCD. The other Fe dopants substitute Bi atoms and are magnetically isotropic with smaller magnetic moment. Effective moment of Fe equal to peff = 2.1 μB/Fe, isotropic at high temperature, was found by volume magnetometry probe. At low temperature magnetization is anisotropic (in-plane) and its saturation value is much smaller than the effective moment. It is attributed to antiferromagnetic ordering of Fe atoms below 10 K.
In case where structural data were not available, as for Fe adatoms, other tools, in this case studies of Fe adatoms vibrations, were used. We have found that some fraction of adatoms clusterize, but others are bound to the host reproducing vibration spectrum of Bi2Se3. Majority of adatoms probed by XMCD, were found to sit on cleaved surface, while other diffused below the surface and settled possibly between top two QLs. They all reveal magnetic moment of approx. 3.5 μB/Fe. Surface Fe adatoms exhibit in-plane anisotropy, while a weak out-of-plane anisotropy was found for the diffused ones.
The observed tendency of Fe to occupy distinct positions in the lattice, which determines their magnetic moments and anisotropy, should be taken into account in future efforts to check magnetic moments impact on topology change in bismuth selenide and in the construction of systems exhibiting QAHE. In this last context, possible antiferromagnetic order of Fe dopants at low temperatures is very promising.
Acknowledgments
Financial support from the National Science Centre, Poland Grant 2015/17/B/ST3/00128 is gratefully acknowledged. The access to ESRF was financed by the Polish Ministry of Science and High Education—decision number: DIR/WK/2016/19. We are grateful to Virginia Montseguro-Padron for her help during EXAFS experiment and Łukasz Gondek for sharing the XRD results prior to publication.