
Abstract
Hepatitis C virus (HCV) afflicts 170 million people and kills 700 000 annually. Vaccination offers the most realistic and cost effective hope of controlling this epidemic, but despite 25 years of research, no vaccine is available. A major obstacle is HCV's extreme genetic variability and rapid mutational escape from immune pressure. Coupling maximum entropy inference with population dynamics simulations, we have employed a computational approach to translate HCV sequence databases into empirical landscapes of viral fitness and simulate the intrahost evolution of the viral quasispecies over these landscapes. We explicitly model the coupled host-pathogen dynamics by combining agent-based models of viral mutation with stochastically-integrated coupled ordinary differential equations for the host immune response. We validate our model in predicting the mutational evolution of the HCV RNA-dependent RNA polymerase (protein NS5B) within seven individuals for whom longitudinal sequencing data is available. We then use our approach to perform exhaustive in silico evaluation of putative immunogen candidates to rationally design tailored vaccines to simultaneously cripple viral fitness and block mutational escape within two selected individuals. By systematically identifying a small number of promising vaccine candidates, our empirical fitness landscapes and host-pathogen dynamics simulator can guide and accelerate experimental vaccine design efforts.
Export citation and abstract BibTeX RIS
1. Introduction
Hepatitis C virus (HCV) infects ~2%–3% of the worlds population and 700 000 people die each year from HCV-related liver diseases [1]. The efficacy of drug therapies has increased markedly over the past several years [2, 3], with the success rates of treatment increasing from ~50% [4] to 90% [2]. The impact of these new treatments, however, is severely limited by their high costs, which make them essentially unavailable in the poorer nations where the preponderance of HCV infections occur [5–7]. An inexpensive prophylactic vaccine presents the best chance to control the global epidemic by making protection widely available and guarding against reinfection [8, 9]. A number of vaccine candidates have been tested in animals and Phase I and II clinical trials [10], but to date, a publicly-available vaccine remains unavailable. A primary challenge is the high genetic diversity and mutation rate of HCV that enables it to evade host immune pressure and has frustrated the development of vaccines capable of eliciting broadly-neutralizing humoral or cellular responses [10–13].
Mathematical and computational models have proven to be of great value in vaccine design efforts by identifying viral vulnerabilities, predicting escape mutations, directing vaccination campaigns, and engineering immunogenic epitopes [14–19]. A valuable paradigm for rational vaccine design is the determination of viral fitness landscapes specifying the intrahost replicative capacity of the virus as a function of genotype [16, 18, 20–29]. These landscapes have been used to identify vulnerable viral epitopes [16], predict viral evolution and mutational escape pathways [29–31], resolve the influence of drug treatment or host immune pressure on the viral population [30, 32, 33], and unearth historical artifacts of host-pathogen evolution [34]. A number of mathematical and computational approaches have been developed in recent years to determine empirical viral fitness landscapes from sequence data collected from single hosts or within a population [16, 18, 33, 35–38]. We have previously reported a technique to translate population-level sequence databases into empirical viral fitness landscapes by fitting a proteome-level model of viral fitness that explicitly treats epistasis to optimally reproduce the observed mutational correlations within the sequence data [16, 18, 39]. We applied this approach to determine the empirical fitness landscapes for the HCV RNA-dependent RNA polymerase (protein NS5B) [16] tasked with replicating the viral genome [40] and against which T-cell immune responses are correlated with viral control [41–43]. We validated the NS5B fitness landscape predictions against in vitro and in vivo measurements, and then used it to identify those epitopes against which vaccine-induced immune responses were predicted to maximally suppress viral fitness. This enabled us to perform exhaustive combinatorial evaluation of 16.8 million candidate vaccine immunogens targeting T-cell epitopes within NS5B to identify 86 optimal immunogen formulations.
This immunogen design approach, however, suffers from two main drawbacks: the dynamics of the vaccine-induced host immune responses are not explicitly modeled, and the viral quasispecies is assumed to be equilibrated to the underlying fitness landscape. In this sense the vaccine design protocol is 'static' since it does not explicitly consider the coupled host-pathogen dynamics over the viral fitness landscape. As a result, it cannot resolve important non-equilibrium or temporal effects such as time-varying predator-prey dynamics, metastable trapping of the viral quasispecies within local fitness maxima, non-ergodic partitioning of the viral population by low fitness valleys, and the stochasticity inherent in viral replication and host immune responses. Such influences can be critical in determining viral evolution pathways and in accurately predicting the efficacy of a putative immunogen candidate [29, 31, 44–46]. What is required is a more sophisticated approach that models the temporal evolution of the viral quasispecies over the empirical fitness landscape and is explicitly coupled to the dynamics of the host adaptive immune response.
Mathematical modeling and simulation of viral evolution over both simple and complex landscapes has been a subject of interest for nearly a century [29, 47–52]. In recent work, Read et al studied the coupled host-pathogen dynamics of a mutating virus and cytotoxic T-cell immune responses over a toy viral fitness landscape to probe the influence of stochastic effects on viral evolution [45]. Tripathi et al performed simulations of the evolutionary dynamics of the HIV-1 quasispecies over a fitness landscape fitted to in vitro experimental data through expansions in the Hamming distance from the wild-type strain [46]. Host immune responses were not incorporated into the model. Barton et al simulated viral dynamics over realistic data-driven viral fitness landscapes corresponding to particular viral proteins in order to predict mutational escape times and pathways for HIV-1 [31]. Empirical fitness landscapes were estimated from population-level sequence data for all HIV-1 proteins except gp120, and the mutational evolution of the viral quasispecies modeled using a Fisher–Wright model [53, 54]. Host immune pressure was treated implicitly by implementing a constant bias term to penalize viral strains recognized by particular immune effector responses.
In this work, we simulate the coupled host-pathogen dynamics over a realistic data-driven fitness landscape for the HCV NS5B protein and explicitly model the host immune dynamics. The intrahost evolution of the viral quasispecies is treated using an agent-based model, and the host cellular immune response modeled by a set of coupled ordinary differential equations. Elevated levels of viral strains recognized by cognate cytotoxic T-cell immune responses stimulate immune responses, and elevated levels of immune effector cells impose increasing fitness penalties upon recognized viral mutants. The agent-based discretization of the viral quasispecies and stochastic integration protocol for the immune response explicitly incorporate the effects of stochasticity into the coupled dynamics. We validate our model by simulating the mutational evolution of NS5B within seven individuals for whom longitudinal sequencing data is available, and demonstrate that it predicts the observed mutational time courses with high fidelity. We then go on to perform exhaustive in silico evaluation of putative immunogen candidates within two individuals. The integration of stochastic population models of the host-pathogen dynamics over empirical fitness landscapes provides a means to predict viral evolution and rationally design vaccine immunogens to block mutational escape and cripple viral fitness.
2. Methods
2.1. Determination of the HCV-1a NS5B empirical fitness landscape
We establish empirical fitness landscapes for the HCV-1a NS5B protein by analyzing the mutational correlations within multiple sequence alignments (MSA) of viral strains to parameterize a protein-level fitness model that explicitly models one- and two-body mutational epistasis. We have previously shown that the least-biased (maximum entropy) model capable of explicitly reproducing the one- and two-position mutational frequencies observed in the MSA is the Potts model from statistical physics [16, 18, 39, 55]. This model specifies that the prevalence  of a particular viral strain containing
  amino acid residues with sequence
  (e.g.
(e.g.  [GRH...ALF]) is,

Since the Potts model has its origin in condensed matter physics, we refer to  as a (fictitious) dimensionless 'energy', the function
  as the Hamiltonian, and the normalizing factor
  as the partition function [18, 39, 52, 56]. Each amino acid position is associated with a field vector
  with elements
  specifying the one-body contribution to the energy of amino acid
  in position
  . Each pair of amino acid positions is associated with a coupling matrix
  with elements
  specifying the two-body contribution of amino acid
  in position
  and amino acid
  in position
  . Higher order epistatic couplings (e.g. three-position, four-position, etc) may be incorporated through additional terms in
  , but the exponential increase in the number of model parameters makes computational fitting intractable and can actually degrade predictive accuracy [57]. Terminating the coupling expansion at the level of pairs is the simplest model capable of capturing epistatic effects that are critical determinants of viral fitness [17, 35, 37, 43, 57]. The inferred parameters are not the intrinsic one- and two-body coefficients, but effective coefficients that are typically found to reproduce three- and four-body mutational frequencies through interactions of the constitutive pairs [58–61]. The Hamiltonian
  may be most straightforwardly interpreted as an a priori unknown function linking sequence
  to prevalence
  : high energies are associated with low prevalences, and vice versa. Provided that the strains making up the MSA are not too phylogenetically distant and are drawn from a range of hosts with diverse immunological haplotypes, we have previously shown using simulation and variational theory that the population-level prevalence
  is a good proxy for the molecular level intrinsic replicative fitness in the absence of immune pressure
  [55]. Accordingly,
  and equation (1) provides an empirical model for the intrinsic viral fitness landscape. Since selection between competing viral strains in our model is performed on the basis of relative fitness, the value of the proportionality constant is unimportant for our purposes and without loss of generality we set
  = 1. (Alternatively, one can consider the reported fitness values to have been implicitly scaled by that of a reference strain with
  and
and  such that
  .) If absolute values of fitness are needed, then it is possible to estimate the proportionality by calibrating the landscape against in vitro measurements of fitness for a limited number of mutant strains [16, 39].
The Potts model is parameterized by fitting the  such that the one- and two-position amino acid frequencies predicted by the model match those observed in the MSA. There are many techniques to solve this inverse inference problem [31, 37, 39, 62, 63]. We have previously detailed an approach using Bayesian regularized Newton descent in which strain probabilities associated with the current
  values are estimated by Markov Chain Monte Carlo [39]. Recently, we applied this approach to determine the fitness landscape of the HCV NS5B protein, and validated the landscape against a variety of experimental and clinical data [16]. We curated, aligned, and cleaned an ensemble of 1337 HCV-1a NS5B protein sequences drawn from drug naïve hosts supplied by the Los Alamos National Laboratory HCV database (http://hcv.lanl.gov) [19] and the lab of Dr Todd Allen at Harvard Medical School. By construction, the Potts model fitted over these data reproduces the one- and two-position amino acid frequencies. However, it accurately predicts the three-position mutational correlations, demonstrating that it also captures higher-order epistatic couplings. We showed in comparisons against independent experimental and clinical data that the empirical fitness landscape predicts in vitro measurements of the replicative capacity of mutant strains, the location of facile escape mutations and pathways, and clinically-documented protective haplotypes. Full details on the MSA curation, model fitting, and model validation of the HCV-1a NS5B fitness landscape are provided in [16], and additional methodological background on the model fitting procedure are available in [39].
2.2. Agent-based model of viral quasispecies dynamics
Intrahost evolution of the HCV quasispecies over the empirical fitness landscape is modeled using Fisher–Wright type dynamics [53, 54]. These simple and idealized evolutionary dynamics operate over a fixed population of infected cells and proceed in non-overlapping generations, but nonetheless offer a useful stochastic model for viral replication that has been previously applied to viral evolution over empirical fitness landscapes [55]. We focus on the region of the HCV genome coding for the NS5B protein for which we have determined an empirical fitness landscape. We assume that inter-protein epistatic couplings may be neglected relative to the intra-protein couplings explicitly modeled within the landscape. A sophistication of our approach would consider fitness landscapes for polyproteins, or even the complete proteome. The determination of full proteome landscapes is currently frustrated by the availability of sufficient numbers of full-proteome sequences and the high expense of the computational fitting procedure. The algorithm proceeds as follows. (1) Each of  cells are infected with a founder or infecting strain
  . (2) Each of the
  cells produces
  free daughter virions. To mimic error prone viral replication, each amino acid position in the proteome of each daughter virion is subject to random mutation at a rate of
  mutations per nucleotide per replication cycle. Since our empirical fitness landscape is formulated at the level of the proteome we make the simplifying assumption of a uniform mutation rate at the level of each amino acid, but appreciate that a more sophisticated model would account for differences associated with synonymous and non-synonymous mutations. (3) Each of the
  daughter virions is assigned an intrinsic fitness
  by the empirical fitness landscape as a function of its sequence
  (section 2.1). Each strain is also subjected to a fitness penalty
  based on its susceptibility to immune pressure, providing coupling between the host and pathogen dynamics (see section 2.3) [45]. The effective fitness of each daughter strain is the quotient of these values
  . (4) We choose
  of the
  daughter virions to infect the next generation of cells using effective fitness weighted selection without replacement, such that in each selection event the probability of selecting a particular daughter virion
  is
is  . The role and prevalence of HCV recombination remains unclear [64–66], and in this work we do not make any provision for cellular superinfection and recombination. (5) The
  infected cells are re-seeded with the selected daughter virions, and the T-cell dynamics updated to reflect their response to the changing viral population (see section 2.3). The iterative procedure then cycles through steps (2–6), with each cycle representing a complete Fisher–Wright generation.
The parameters of the Fisher–Wright model are specified as follows and listed in table 1. The in vivo mutation rate of HCV is known to be approximately  mutations per nucleotide per replication cycle [67, 68]. Given the uncertainties and potential variance in this value, we verified that the predictions of our model were robust over the range
  (figure S1 in supplementary data (stacks.iop.org/PhysBio/16/016004/mmedia)). Infected hepatocytes can have up to 40 replication complexes [69] and replication can take ~6 h [11], thus the number of progeny per HCV infected hepatocyte per day is approximately
  . However, numerical testing of our model showed that its dynamical predictions remained essentially unchanged above a threshold value of
  virons/cell.generation, allowing us to adopt a substantially smaller value of
  virons/cell.generation for computational efficiency. The Fisher–Wright model lumps the processes of mutation and selection between non-overlapping generations [53–55]. Based on the half-life of HCV infected hepatocytes [11, 70–72], the time scale of each generation is set to seven days of elapsed time. The effective population size is the population of the idealized model that possesses the same population genetic behaviors as the true system [46, 73]. Estimates of the effective population of infected cells
  for HCV were not readily available from literature, but work on HIV has provided estimates in the range
  –
– [45, 46, 74] and previous Fisher–Wright population genetic simulations of HIV have employed values of
  –
– [55]. In this work, we elected to employ
  as a value near the center of this range and performed numerical tests to verify that the model predictions were robust over the range
  (figure S2 in supplementary data). We note that the value of the product
  lies close to unity, indicating that the role of stochastic fluctuations in a finite population are anticipated to play an important role, and we should not expect the viral dynamics to be be satisfactorily modeled using quasispecies theory [45, 46, 55, 75].
Table 1. Parameters implemented in the Fisher–Wright model of the viral dynamics.
| Symbol | Parameter | Value | Units | Reference |
|---|---|---|---|---|
 |
Viral mutation rate |  |
mut · nucleotide · (replication cycle) · (replication cycle) |
[67, 68] |
 |
Virion production rate | 10 | virions · cell · generation · generation |
[11] |
 |
Effective population of infected cells |  |
cells | [45, 46, 74] |
2.3. Master equation model of CD8 T-cell dynamics

The NS5B protein is recognized by cognate cellular immune responses when it is subjected to intracellular degradation and its fragments presented on the cell surface by major histocompatibility complex (MHC) molecules within a peptide-MHC (pMHC) complex [76]. In this work, we focus exclusively on the dynamics of cytotoxic T lymphocytes (CTLs)—also known as CD8 T-cells or killer T-cells—possessing cognate HCV epitopes lying within the NS5B protein. These T-cells operate by inducing programmed cell death of HCV infected hepatocytes that present epitopes within pMHC class I complexes to which the T-cell receptor (TCR) binds sufficiently strongly. A sophistication of our approach would also consider the role of CD4
 T-cells (helper T-cells). We model the CTL dynamics using a variant of the approach presented by Read et al [45].
Our model proceeds as follows. We first reference the human leukocyte antigen (HLA) haplotype of the infected individual against the Immune Epitope Database (www.iedb.org) [77] to identify the number of cognate CTL responses possessed by the host against the HCV NS5B protein. This defines the number of CTL variants to be tracked within our model. Naïve CTLs are born, replicate, and die at prescribed rates. Naïve CTLs are activated by TCR-pMHC binding to cognate epitopes presented by infected cells. The virus can evade immune recognition by diminishing the binding strength through mutations within the epitope, but these mutations also typically incur a penalty in intrinsic fitness as prescribed by the empirical fitness landscape (section 2.1). Activation of a naïve CTL results in its differentiation into a first generation effector cell. Effector cells proliferate, die, and differentiate into memory cells at prescribed rates, with proliferation limited to a specific number of generations. Memory cells die at a prescribed rate, and—similar to naïve cells—differentiate into first generation effector cells upon TCR-pMHC binding to infected cells, but do so with an elevated activation rate reflecting their previous exposure to their cognate epitope.
The dynamical model is represented mathematically by the following set of coupled ordinary differential equations (ODEs) [45],


For CTLs targeting epitope  ,
,  is the number of naïve cells,
  is the number of effector cells of generation
  , and
, and  the number of memory cells. Effector cells are limited to proliferate for
  generations. The number of hepatocytes infected with viral strain
  is
is  . The TCR-pMHC binding affinity
  between CTL
  in viral strain
  is specified using the MHC I binding prediction tool (v. 2.13) from the Immune Epitope Database (http://tools.iedb.org/mhci/download/) [78]. We used the IC
 values from the ANN method [79–81] for the HLA molecules covered by that method and the score for the consensus method [78] otherwise. Denoting this score as
  —where lower scores correspond to stronger binding—we define the binding affinity as
  , where
  is the score for epitope
  binding to CTL
  and
and  is minimum score for a given method over the list of known epitopes. This definition sets
  to unity for the strongest binding TCR-pMHC pair, with weaker binding pairs assigned affinities progressively closer to zero. The term
  may be interpreted as the effective number of infected cells available to activate naïve or memory responses against epitope
  accounting for the number of cells infected by each viral strain
  and the TCR-pMHC binding affinity to the cognate epitope. Estimates for the rate constants in the model are available from experimental data and are collected in table 2 [82–88]. The small effective population sizes of infected hepatocytes and T-cells means that stochastic effects are anticipated to play an important role in governing the CTL dynamics [45]. We integrate the coupled CTL ODEs deterministically using a 4th order Runge–Kutta integrator, and—to explicitly expose the role of stochasticity—also stochastically by converting them into a discrete master equation reaction network that we simulate using Gillespie dynamics [45, 89]. The Fisher–Wright dynamics proceed in discrete generations set by the infected cell half-life, whereas the T-cell dynamics evolve continuously in time. We match the dynamical time scales of each system by sequentially advancing the viral dynamics by a single discrete generation under a fixed T-cell population, then numerically integrating the T-cell dynamics for the period of a single Fisher–Wright generation under a fixed viral population. In this manner, the viral and T-cell dynamics are alternately propagated through time in time steps corresponding to the duration of a single Fisher–Wright generation.
Table 2. Rate constants implemented in the master equation / coupled ODE model of CD8 T-cell dynamics.
| Symbol | Parameter | Value | Units | Reference |
|---|---|---|---|---|
 |
Naïve cell activation rate |  |
cell · d · d |
[45] |
 |
Memory cell activation rate |  |
cell · d · d |
[45] |
 |
Naïve cell replication rate |  |
d |
[45, 82] |
 |
Effector cell death rate | 0.2 | d |
[45, 87] |
 |
Terminal effector cell death rate | 3 | d |
[45, 87] |
 |
Effector cell replication rate | 6 | d |
[86, 87] |
 |
Naïve cell death rate |  |
d |
[45, 82] |
 |
Effector cell to memory cell rate | 0.03 | d |
[45] |
 |
Memory cell death rate | 0.03 | d |
[45, 87] |
 |
Naïve cell birth rate | 0.1 | cells · d |
[45, 83, 85] |
 |
Effector cell division limit | 9 | — | [45, 86, 88] |
Coupling between the CTL and viral quasispecies dynamics occurs through the susceptibility of each viral strain  to CTL immune pressure. The effective fitness
  is the quotient of the intrinsic strain fitness
  prescribed by the fitness landscape and the instantaneous susceptibility
  of that strain to CTL pressure (section 2.2). We define the instantaneous susceptibility of strain
  as,
as,

and—appealing to equation (1) and the relation  (see section 2.1)—the intrinsic and effective fitness of strain
  are,
are,


where we recall  as an unimportant proportionality constant since selection is performed on the basis of relative effective fitness (section 2.2). The form of the susceptibility can be understood as follows. The quantity
  is the total number of CTL effector cells of all generations currently targeting epitope
  . The quantity
  may then be interpreted as the total effective number of CTLs targeting each epitope
  accounting for the CTL clonal counts and the TCR-pMHC binding affinity to their cognate epitopes in strain
  . The net CTL immune pressure experienced by strain
  is then the total effective number of CTLs scaled by the fitness penalty per effective CTL
  .
.  is the mean value taken over all
  in our empirical fitness landscape, and
  is a parameter controlling the relative magnitude of the penalty associated with immune pressure to the average penalty associated with a point mutation. Equation (9) makes clear that the net effect of immune pressure is to act as a dynamic perturbation to the topography of the intrinsic fitness landscape that raises the effective energy of viral strains subject to CTL targeting to
  , thereby reducing their effective fitness. Previous work by Shekhar et al and Barton et al have employed similar treatments of immune pressure employing uniform and time-invariant values of
  that are abrogated upon non-synonymous mutations within the epitope [31, 55]. The present work employs a more realistic model for CTL penalty to reflect both the continuum of possible TCR-pMHC binding affinities and the dynamics of clonal CTL expansion and contraction. Barton et al showed viral escape pathways and relative escape rates to be robust to the particular value of the immune penalty provided that this was greater than the average cost of mutational escape so as to provide a selective advantage to escape mutants [31]. Following this work, we adopt
  such that the immune penalty associated with recognition by one effective CTL is twice the average cost of a point mutation.
To simulate the natural immune responses of an infected individual in the absence of vaccine or drug pressure we initialize the CTL populations cognate to epitope  with 200 naïve cells, 0 effector cells, and 0 memory cells. There have been several efforts to quantify the populations of infected cells [11, 90], naïve CTLs (total and epitope specific) [84, 85, 90], and effector cells [91] during HCV infection. Since we are working with an effective population size
  for the infected cells, the number of immune cells likewise represent effective population sizes and we specify the initial number of naïve CTLs to approximately preserve their experimental ratio relative to infected hepatocytes. To simulate the effect of prophylactic vaccination against a particular HCV epitope
  , we initialize the populations of the cognate CTL with 200 naïve cells, 0 effector cells and 15 memory cells. Memory cells generated during an initial infection activate at a far higher rate than naïve cells (see table 2) offering improved protection against subsequent challenge by the same pathogen. Vaccines work by promoting the of creation of memory responses without inducing a full-blown infection [92]. The number of initial memory cells was selected based on the size of the memory population generated by the most reactive epitopes in our simulations in the absence of vaccination.
2.4. Likelihood evaluation of longitudinal sequencing data
To test the predictions of our model, we compare its predictions for the infection time course against longitudinal sequencing data sampling the viral load and diversity within each host as a function of time. To make this comparison quantitative, we compute the likelihood of observing the specific mutational time courses observed in the patient given the parameters of our model. We begin by writing the likelihood of the whole time course for a specific amino acid position as the product of the likelihoods of seeing the mutations at each time point,

where  represents the number of sequences containing a particular mutation
  at time
  ,
,  is the probability predicted by our dynamical model of observing mutation
  at time
  , and the time courses of mutations and probabilities can be expanded as
  and
and  . Assuming a multinomial distribution, the likelihood of the observed mutations
  at time
  is,
is,

where the prefactor is a multinomial coefficient that accounts for the different permutations of mutations among the observed strains. The reported likelihood for a patient's sequence data is the average of the likelihood for the individual positions. In calculating our likelihoods, we make the simplifying assumption that mutations at the various positions are uncorrelated. This approximation provides us a simple route to assign a single likelihood to the observed mutational time course of the complete sequence, but we do appreciate that more sophisticated approaches would explicitly treat mutational correlations between positions due to epistatic couplings.
The range of likelihoods that can be assigned by our model to the observed time course of mutations at a particular position can vary substantially with position. In order to compare likelihoods between different positions, it is useful to instead report the quotient  , where
  is the maximum possible likelihood that can be assigned by our model. This quotient represents as a fraction the point on the range
 ![$[0,P^{\rm max}]$](https://content.cld.iop.org/journals/1478-3975/16/1/016004/revision2/pbaaeec0ieqn157.gif) at which the calculated value of
at which the calculated value of  resides, thereby facilitating comparisons across positions. The maximum likelihood
  occurs when
  , which corresponds to setting the model probability of observing mutation
  at time
  equal to the observed fraction of these mutations at that time point within the longitudinal sequencing data. This can easily be seen by taking the derivative of the likelihood with respect to
  and setting it to zero. Note that
  , so one of the parameters—arbitrarily we choose
  —can be written in terms of the others,
  , and for ease of mathematical manipulation, we utilize the log-likelihood,

Now substituting in  we demonstrate that this is a stationary point that maximizes the likelihood,

The maximum likelihood for the whole sequence is defined as the average of the maximum likelihoods at each individual position.
To estimate the statistical significance of our model's ability to predict mutational pathways for each site we estimate p-values for our calculated likelihoods by generating 50 000 likelihoods using  values sampled uniformly at random over the interval [0,1) and renormalized as
  , then calculating the fraction of results that lie above the computed likelihood. The p-value can be interpreted as an estimate of the probability of obtaining a likelihood equal to or greater than the observed value of the likelihood
  calculated from our model by random guessing of the mutational probabilities
  . Adopting a significance threshold of
  , if p
  0.001 then we can reject the null hypothesis that our model is no better than random guessing and thereby lend support to the predictive capability of our model. Contrariwise, if p
  0.001 then we cannot reject the null hypothesis and must conclude that our model is indistinguishable from random guessing. We compute the mean of the p-values for each amino acid position to report an average p-value for the patient.
2.5. Computational implementation
We employed the data-driven HCV-1a NS5B fitness landscape previously computed as detailed in [16]. The landscape is specified by the fitted  parameters that are loaded into the dynamical simulator from a text file. The
  specifying the TCR-pMHC binding affinities are precomputed for all possible mutants of the particular CTL epitopes considered in our calculations using the MHC I binding prediction tool (v. 2.13) from Immune Epitope Database (http://tools.iedb.org/mhci/download/) [78] and saved to file to be ingested by the dynamical simulator as a lookup table. The computational model of the coupled agent-based Fisher–Wright viral dynamics and ODE / master equation treatment of the host CTL dynamics was implemented in an in-house C++ code employing OpenMP. Every simulation was conducted once employing deterministic integration of the CTL dynamics using a 4th order Runge–Kutta integrator and 99 times by stochastic integration using Gillespie dynamics [45, 89] to generate an ensemble of dynamical realizations. Acceleration of a tight computational bottleneck associated with selection of the daughter virions according to relative effective fitness without replacement was achieved by employing parallel roulette selection [93]. The execution speed of the code employing stochastic integration of the clonal dynamics of five CTL populations is 0.5 wall clock hours per Fisher–Wright generation on 5
  2.8 GHz Intel E5-2680 CPU cores. Simulations were conducted on the Blue Waters supercomputer at the University of Illinois at Urbana-Champaign [94, 95] and the superMIC, Comet, and Bridges XSEDE supercomputing resources [96]. We have made our simulator available for open-source download at https://github.com/GregoryRHart/Population_Dynamics.
3. Results
We first validate the predictive capacity of our dynamical model to predict the pattern and timing of mutations observed in longitudinal sequencing data extracted from HCV infected hosts. We then proceed to use the validated model to rationally design tailored HCV vaccines predicted to suppress viral escape and cripple fitness.
3.1. Validation of dynamical model against longitudinal sequencing data
To validate the dynamic model of coupled host-pathogen dynamics detailed in section 2 we generated simulated HCV infection courses within seven individuals—023, 0684MX, 1086MX, BR111, BR554, M003, and P03_32—who became chronically infected with HCV, did not receive drug treatment, and for whom longitudinal sequencing data is available over the period of 0.5 to 49 months [97–99]. The patients are drug naïve such that the viral evolutionary dynamics were subject only to pressure from the host immune responses and the time courses are therefore well suited to validate our model of the host-pathogen dynamics. Support for our model is provided if the patterns and timing of mutations observed in the longitudinal sequencing data is in agreement with the predictions of our simulated dynamics.
We modeled the clonal dynamics of all CTL responses against known NS5B epitopes consistent with the host HLA haplotypes as found in the Immune Epitope Database (www.iedb.org/) [78]. Patient P03_32 possessed a measured CTL response against an NS5B epitope B*57 LGVPPLRAWR inconsistent with the reported HLA haplotype of A*01, A*03, B*08, and B*35. There are no known CTL epitopes corresponding to this haplotype, suggesting that the patient may have been immunologically mischaracterized. Nevertheless, we modeled the immune dynamics corresponding to this haplotype by simulating only the observed response restricted by the HLA possessed by the patient that had the strongest binding affinity for that epitope. The TCR-pMHC binding affinities  required by our model (section 2.3) were estimated using the MHC I binding tool (v. 2.13) from the Immune Epitope Database (http://tools.iedb.org/mhci/download/) [78]. In cases where multiple HLA molecules restricted the same epitope, we assumed the epitope to be restricted by the HLA molecule with the strongest binding affinity. We initialized each simulation from a population of infected cells uniformly initialized with the first sequence observed in the patient—typically estimated to have been drawn 2–9 weeks post-infection—except for patient BR554 for whom the infecting strain was known [98]. In comparing our model predictions to the data we focused only on those amino acid positions in NS5B at which mutations were observed within the longitudinal data and/or at which mutations reached a majority (i.e. came to occupy 50% or more of the viral population) at one or more time points in our simulation trajectories. We report in tables S1–7 the supplementary data, the longitudinal sequence data for this set of positions in each patient along with the patient HLA types and restricted NS5B epitopes. For patients BR111, BR554, M003, and P03_32, the absolute counts of each mutant strain were reported to provide a direct—although clearly not exhaustive—accounting of
  . For patients 023, 0684MX, and 1086MX the data were reported as relative strain prevalences
  without stating the absolute number of sequences
  . To obtain estimates of
  we set
  to be commensurate with the other patients in the corpus for which multiple strains were reported. We verified that our computed likelihoods
  did not change by more than 22% and the p-values with which we assess the significance of our computed likelihood values did not rise above (i.e. become any less significant than)
  as the number of sequences was varied over the range
  –100.
–100.
For each patient we generated 99 stochastic realizations of the infection course modeling the viral dynamics using an agent-based Fisher–Wright dynamics (section 2.2) and the CTL dynamics by Gillespie integration of the master equation network (section 2.3). By averaging over the ensemble of stochastic trajectories, we estimate the probability  of observing a particular mutation
  at a particular time point
  and combine these probabilities with the mutant counts
  in the longitudinal sequencing data to compute the likelihood of the observed mutational time course prescribed by our model (section 2.4). The Fisher–Wright model was parameterized such that each non-overlapping generation corresponds to seven days of elapsed time, but the simplistic nature of this model means that this time mapping may be imprecise. Accordingly, we rescaled time to achieve the best agreement over the longitudinal sequencing data for all seven patients considered. Specifically, we performed a temporal rescaling of the population fitness trajectories predicted by our model
  , where the scaling factor
  was optimized to minimize the sum of squared errors over all seven patients between the fitness trajectories predicted by our model and the mean fitness assigned to the observed strains at each longitudinal measurement point. This required no modification of our model or the parameters therein, but rather a post hoc recalibration of the the effective time in our model trajectories that can be conceived of as an empirical tuning of the time scale of our model against biological data. The optimal rescaling was achieved such that one Fisher–Wright generation corresponds to 7.8 d of infection, which is close to the seven days estimated from the half-life of HCV infected hepatocytes (section 2.2).
We provide in figure 1 an example of the viral and CTL time courses predicted by our dynamical model for patient 0684MX. The initial dip in the mean intrinsic fitness  corresponds to the emergent immune pressure forcing deleterious mutations in the virus before the emergence of compensatory escape mutations that restore intrinsic fitness to very close to the initial level (figure 1(a)). The mean effective fitness
  exhibits similar trends, although the difference between the deterministic (dashed line) and stochastic (solid line) integration of the CTL dynamics is greatly magnified (figure 1(b)). This illuminates the crucial importance of explicitly treating stochastic effects when dealing with small effective population sizes, and the spurious results that can emerge from a deterministic treatment that admits fractional (i.e. non-integer) counts of cells. Of the six CTL targets restricted by this patient, the RLIVFPDLGV epitope induces a larger and more durable CTL response than the other five (figure 1(c)). This can be understood since the average binding affinity for escape mutations within RLIVFPDLGV are generally higher than for the other epitopes, meaning that this CTL target is less able to evade immune surveillance. We report in table 3 the likelihood assigned by our model to the longitudinal sequencing data in each of the seven patients along with p-values and the maximum attainable likelihood. In 4/7 patients (023, BR554, BR111, 1086MX) we observe high likelihood values in excess of 40% of the maximum likelihood and with significant p-values (
 ). In 2/7 patients (0684MX, M003) we report moderately large likelihoods of 37% and 28% of the maximum likelihood and significant p-values (
 ). Only for patient P03_32 is our likelihood small and insignificant (
 ,
,  ). As detailed above, the reported CTL responses against the virus launched by this host are inconsistent with the reported HLA haplotype, suggesting that the patient may have been immunologically mischaracterized and the reported CTL epitopes unreliable. Disregarding the results for P03_32, the high and statistically significant likelihoods assigned by our model to the longitudinal sequencing data in the six remaining individuals provides strong support for the predictive capacity of our dynamical model in predicting the mutational patterns and rates of intrahost viral evolution.

Figure 1. Simulated time course of the coupled host-pathogen dynamics in patient 0684MX. (a) Time evolution of the mean intrinsic fitness  of the viral quasispecies over the infection course as predicted by our agent-based Fisher–Wright model. (b) Time evolution of the mean effective fitness
  of the viral population accounting for the instantaneous susceptibility
  of each viral strain to the dynamically evolving CTL clonal populations. (c) Time evolution of the clonal populations of CTL effector cells against each of the six NS5B T-cell epitopes restricted by this host. Time courses are reported for the deterministic numerical integration of the CTL coupled ODEs (dashed lines) and the mean of 99 independent stochastic realizations of the corresponding discrete master equation network simulated using Gillespie dynamics (solid lines). Error bars are reported where doing so would not obscure the data, and correspond to standard deviations in the energy
  over the 99 Gillespie realizations transformed into standard deviations in fitness
  .
.
Download figure:
Standard image High-resolution imageTable 3. The likelihood assigned by the dynamical model to the observed longitudinal sequencing data for each of the seven patients. The likelihood  is computed according to equations (10) and (11) using the parameters of our model. The maximum likelihood
  represents the upper bound on the likelihood associated with a particular mutational time course. The p-values associated with
  for each amino acid position are estimated by computing the likelihood associated with 50 000 random samples of the likelihood model parameters and calculating the fraction that lie above the computed likelihood. The p-values for each position are then averaged to report an average p-value for the patient.
| Patient | Likelihood,  |
Max likelihood,  |
 |
p-value |
|---|---|---|---|---|
| 023 | 0.75 | 0.80 | 0.94 |   |
| BR554 | 0.49 | 1.00 | 0.49 |   |
| BR111 | 0.47 | 1.00 | 0.47 |  |
| 1086MX | 0.36 | 0.85 | 0.42 |   |
| 0684MX | 0.35 | 0.94 | 0.37 |   |
| M003 | 0.11 | 0.40 | 0.28 |  |
| P03_32 |  |
1.00 |  |
0.86 |
3.2. Computational design of tailored NS5B CTL immunogens
We have previously validated the predictions of the HCV-1a NS5B fitness landscape against a battery of experimental and clinical data to show that it accurately predicts in vitro replicative fitness, clinically observed escape mutations, and known protective HLA haplotypes [16]. In section 3.1 we showed that the dynamical model of the host-pathogen dynamics over this empirical landscape developed in the present work is a good predictor of the observed viral escape mutation patterns and rates. We now proceed to use the validated dynamical model to understand and design NS5B immunogens to offer protection in suppressing viral fitness and providing durable resistance to escape mutations. Due to the high cost of the dynamical simulations in exhaustively evaluating all possible immunogen designs we selected two of the patients considered in the previous section—0684MX [99] and BR554 [98]—as candidates for whom to perform proof-of-principle tailored immunogen design. This work establishes the foundations for a more comprehensive design effort in which immunogens are optimized over the full HLA haplotype distribution within a particular demograph of vaccine recipients, considers the variety of infecting HCV strains, and is expanded to immunogen epitopes in all HCV proteins.
Our vaccine design strategy using the dynamical model is as follows. It is known that CTL vaccines reliant on the delivery of entire viral proteins can elicit dominant responses against epitopes from which mutational escape is facile, and which can eclipse potentially protective subdominant responses against vulnerable viral targets [16–18, 37, 42, 100–102]. Furthermore, it is desirable to minimize the size of the immunogen to control vaccine cost and complexity [103]. Accordingly, we consider the design of epitope-based immunogens designed to prime specific immune responses. For each patient we identify all NS5B CTL epitopes restricted by the host based on their HLA haplotype [78], and then exhaustively generate all immunogen candidates formed from combinations of these epitopes. We restrict this list to those immunogens containing at most one epitope restricted by each HLA allele to avoid any potential immunodominance issues [17, 18, 102]. In doing so we eliminate from our design protocol those immunogens in which responses against particular CTL epitopes restricted by the same HLA allele may be blunted by the effects of immunodominance, and which therefore may be less efficacious than our model would predict. We then use our dynamical model to simulate the infection course within the patient under each vaccine candidate and in the absence of vaccination by conducting an ensemble of 99 simulations in which the CTL dynamics are stochastically integrated using Gillespie dynamics. As before, the infected cells in each simulation were initialized with the first sequence observed in the patient—typically estimated to have been drawn 2–9 weeks post-infection—except for patient BR554 for whom the infecting strain was known [98]. We model vaccination by seeding the initial CTL population with a pool of memory cells against the epitopes in the vaccine (section 2.3). Each immunogen candidate is scored in its ability to induce robust and durable viral control by evaluating relative to the unvaccinated dynamics (i) the maximum fitness penalty imposed upon the mean intrinsic fitness of the viral population  and (ii) the length of time over which the fitness penalty is sustained
  . We present in figure 2 an example of unvaccinated and vaccinated dynamics in patient 0684MX to illustrate these two measures. Representing the minimum mean intrinsic fitness of the viral population attained over the infection time course under no vaccine and under a particular vaccine candidate
  as
as  and
and  , we define
  . Specifying the full width at half minimum of the trough at which
  and
and  are attained as
  and
and  , we define
  .
.

Figure 2. Predicted time course for the average intrinsic fitness  of the viral population in patient 0684MX (a) in the absence of vaccination and (b) under vaccination with an immunogen containing the two epitopes (A02 RLIVFPDLGV, B27 ARMILMTHF). Vaccination is treated in our model by establishing an initial pool of memory cells against the epitopes in the immunogen. The solid line represents the mean of 99 stochastic realizations of the dynamical evolution generated by Gillespie dynamics. The dashed line represents the results of the deterministic numerical integration of the CTL dynamics that we present for comparative purposes to illuminate the import role of stochasticity in the dynamics. The efficacy of a particular vaccine immunogen
  is measured relative to the unvaccinated dynamics according to the maximum fitness penalty imposed upon the mean intrinsic fitness of the viral population
  (vertical arrows) and the length of time over which the fitness penalty is sustained
  defined as the full width at half minimum of the minimum fitness trough (horizontal arrows). These quantities provide a measure of the strength and durability of the vaccine-induced protection.
Download figure:
Standard image High-resolution imageA number of other measures of efficacy are possible, but these two choices represent a complementary pair assessing the strength and durability of the response. This choice is also compatible with the simple Fisher–Wright model we employ for the viral dynamics that uses a fixed population size of infected cells such that infection can never be cleared. We observe that more sophisticated models of the viral dynamics employing a fluctuating number of infected cells might be employed that would permit measures of efficacy based on the viral load and admit viral clearance for highly efficacious immunogens [104]. Nevertheless, we expect the depth and duration of the fitness penalty to be good proxies for immunogen efficacy within the constraints of our model. The duration of control is one of the primary factors absent in our previous static vaccine design procedure [16], and the present dynamical design protocol explicitly incorporating the coupled host-pathogen dynamics is expected to present a more powerful and reliable design tool. We test this hypothesis by comparing the simulated infection dynamics under the optimal static and dynamic vaccine immunogens. We now proceed to describe the results of our design procedure for the two patients 0684MX and BR554.
3.2.1. Patient 0684MX
Patient 0684MX possesses HLA alleles A*02 and B*27, each of which restrict three CTL epitopes in NS5B. This produces a total of 15 possible immunogen candidates—three containing a single A*02 epitope, three containing a single B*27 epitope, and nine containing one A*02 epitope and one B*27 epitope—that we list in table 4. A scatter plot of the performance of each immunogen candidate in magnitude  and duration
  of control is presented in figure 3.

Figure 3. Evaluation of the 15 CTL immunogen candidates for patient 0684MX using the dynamical simulator (black crosses). The unvaccinated infection dynamics are also considered to provide a performance baseline (green circle). The horizontal and vertical lines demarcate the values of  and
and  in the absence of vaccination. Each immunogen is scored relative to the unvaccinated dynamics by the maximum fitness penalty imposed upon the mean intrinsic fitness of the viral population
  and the length of time over which the fitness penalty is sustained
  . Those immunogens for which no other candidate offers superior performance in both
  and
and  define the dynamically optimal Pareto frontier (red circles). Performing immunogen design using the fitness landscape alone in the absence of the dynamical simulator identifies the statically optimal candidates (blue circles). Candidates in the upper-left quadrant are superior to no vaccination in both the magnitude and duration of response, those in the upper-right and bottom-left are superior in one metric, and those in the bottom-right are inferior in both.
Download figure:
Standard image High-resolution imageTable 4. The 15 possible CTL immunogen candidates considered for patient 0684MX using no more than one epitope for each HLA. Each immunogen is scored by performing simulations of the host-pathogen infection dynamics and determining the the maximum fitness penalty imposed upon the mean intrinsic fitness of the viral population  and the length of time over which the fitness penalty is sustained
  as measured relative to the unvaccinated dynamics. The dynamically optimal immunogens indicated D are defined as those residing on the (
 ,
,  ) Pareto frontier. Of these dynamically optimal candidates, the sole immunogen providing superior performance relative to no vaccination along both performance measures—
 1 and
1 and 
 1—is indicated by D
 . Those immunogens previously identified as optimal by our static design approach are indicated by S.
| Epitopes |  |
 |
Optimal? |
|---|---|---|---|
| A*02 ALYDVVTKL | 0.74 | 0.69 | |
| A*02 GLQDCTMLV | 0.73 | 0.81 | D |
| A*02 RLIVFPDLGV | 0.99 | 1.19 | |
| B*27 ARHTPVNSW | 0.81 | 0.81 | |
| B*27 ARMILMTHF | 0.83 | 0.94 | S |
| B*27 GRAAICGKY | 1.00 | 1.06 | |
| A*02 ALYDVVTKL, B*27 ARHTPVNSW | 0.83 | 1.00 | S |
| A*02 ALYDVVTKL, B*27 ARMILMTHF | 0.68 | 0.75 | D |
| A*02 ALYDVVTKL, B*27 GRAAICGKY | 0.87 | 1.19 | |
| A*02 GLQDCTMLV, B*27 ARHTPVNSW | 0.84 | 1.06 | |
| A*02 GLQDCTMLV, B*27 ARMILMTHF | 0.81 | 1.06 | |
| A*02 GLQDCTMLV, B*27 GRAAICGKY | 1.04 | 0.75 | |
| A*02 RLIVFPDLGV, B*27 ARHTPVNSW | 0.97 | 1.13 | |
| A*02 RLIVFPDLGV, B*27 ARMILMTHF | 0.79 | 1.19 | D |
| A*02 RLIVFPDLGV, B*27 GRAAICGKY | 0.88 | 1.19 |
Of the 15 possible immunogen candidates, seven are predicted to offer improved performance in both magnitude and duration of protection relative to no vaccination, seven are better in one of the two measures, and one is poorer in both. These results demonstrate the capacity of epitope-based vaccines to substantially perturb the natural immune dynamics by priming particular CTL responses, and the utility of a computational immunological simulator in identifying those that prime the most beneficial responses. Within the two-dimensional ( ,
,  ) optimization space, we identify the three candidates residing on the Pareto frontier [105] (figure 3, red circles). These candidates are Pareto optimal in the sense that they are not dominated by any other candidate superior in both strength and duration of control. Of these three dynamically optimal candidates—A*02 GLQDCTMLV, (A*02 ALYDVVTKL, B*27 ARMILMTHF), and (A*02 RLIVFPDLGV, B*27 ARMILMTHF)—only the latter is superior to no vaccination along both performance measures, and therefore represents the overall optimal immunogen candidate for this patient according to our computational design approach. This immunogen offers a ~20% suppression of mean viral fitness and a ~20% increase in the duration of control relative to no vaccination for this particular infecting HCV strain, and—subject to good performance against other infecting strains—it is this candidate that we would propose to be incorporated into a CTL vaccine targeting the NS5B protein for individuals possessing HLA alleles A*02 and B*27. As observed in our previous work, B*27 ARMILMTHF is an immunodominant epitope restricted by the B*27 HLA allele that is correlated with HCV control and clearance [16]. It forms part of the overall optimal immunogen, but delivered alone it is superior relative to no vaccination in
  and inferior in
  .
.
We compare the results of our dynamic vaccine design procedure to those immunogen candidates previously proposed using a static design procedure based only on the NS5B fitness landscape in the absence of simulations of the host-pathogen dynamics [16]. These candidates are Pareto optimal in a two dimensional space defined by the size of immunogen (number of epitopes) and suppression of mean fitness of a viral population equilibrated to the NS5B fitness landscape under the constraint that no viral strain can be fully wild-type within the epitope regions targeted by these immunogens. The statically optimal candidates perform well in terms of  , but the absence of any dynamical design criterion means that they have no better, or even worse, performance in terms of
  than no vaccination (figure 3, blue circles). There are similarities in the epitope compositions of the dynamically optimal and statically optimal designs—the two static designs and two of the dynamic designs contain either A*02 ALYDVVTKL or B*27 ARMILMTHF (table 4)—and so we might conceive of the dynamical design procedure as making adjustments to the static design to improve the longevity of control.
We also note the interesting prediction that one immunogen candidate (A*02 GLQDCTMLV, B*27 GRAAICGKY) leads to poorer performance in both magnitude and duration of the response than no vaccination. This result can be understood by following the history of the CTL response against the six CTL epitopes restricted by this patient relative to the unvaccinated histories (figure 4(a)). Priming memory responses against A*02 GLQDCTMLV and B*27 GRAAICGKY raises rapid and robust CTL responses against these two epitopes, but also results in a delayed onset of responses against the A*02 RLIVFPDLGV and B*27 ARMILMTHF epitopes that were identified to constitute the dynamically optimal immunogen candidate (table 4). These latter responses remain relatively weak until approximately 12 weeks post infection, at which time the virus has been subject to early CTL pressure against epitopes from which mutational escape is facile and been provided a window of time during which to diversify and explore a variety of mutational escape routes from the host immune pressure. This behavior is reminiscent of 'original antigenic sin' or Hoskins effect, wherein immunological memory traps the immune system into an initially ineffectual response [106, 107]. Conversely, vaccinating with the dynamically optimal immunogen (A*02 RLIVFPDLGV, B*27 ARMILMTHF) generates a ~25% stronger response relative to no vaccination against these epitopes over the same time period (figure 4(b)). These findings illuminate the danger of priming memory responses against poor epitopes that can eclipse potentially protective responses against vulnerable epitopes, and militates against the delivery of immunogens comprising entire viral proteins in favor of a rationally designed epitope-based vaccination strategy.

Figure 4. CTL dynamics of the host immune response against all six epitopes restricted by patient 0684MX under (a) vaccination with a poor immunogen candidate (A*02 GLQDCTMLV, B*27 GRAAICGKY), and (b) vaccination with the dynamically optimal immunogen candidate (A*02 RLIVFPDLGV, B*27 ARMILMTHF). Data are reported relative to the unvaccinated dynamics as a percentage of the number of effector cells at that same time point in the average of 99 realizations of the unvaccinated Gillespie dynamics. Responses against the epitopes contained within the dynamically optimal immunogen are bolded. Vaccination with an immunogen containing optimal epitopes provides rapid and robust protective responses against the virus that leads to strong and durable control (b). Vaccination against poor epitopes (a) can eclipse these protective responses relative to no vaccination, suppressing their onset and providing the virus with a window of time over which to diversify and escape.
Download figure:
Standard image High-resolution image3.2.2. Patient BR554
Patient BR554 possesses HLA alleles A*02 and A*31 that restrict three and one NS5B CTL epitopes, respectively, to admit a total of seven possible immunogen candidates (table 5). The scoring of each immunogen candidate in  and
and  is illustrated in figure 5.

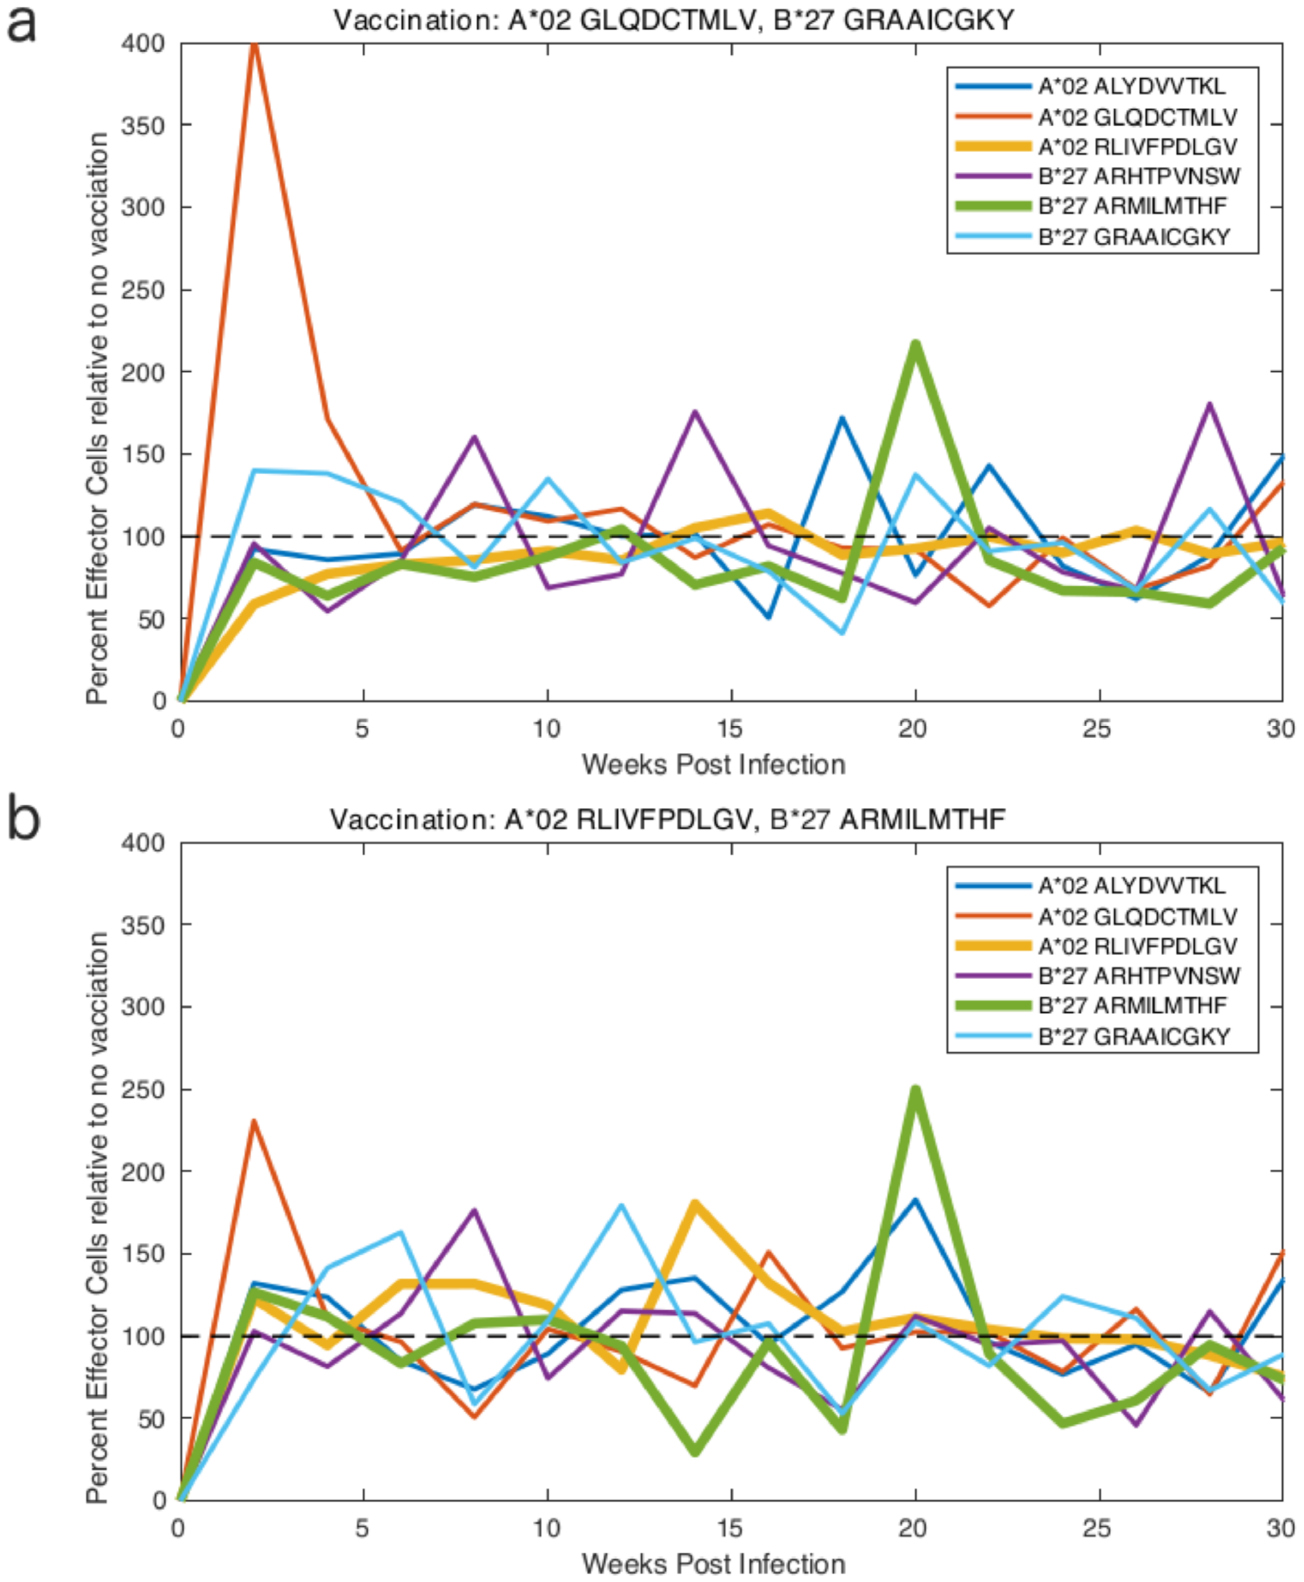
Figure 5. Evaluation of the seven CTL immunogen candidates for patient BR554 using the dynamical simulator (black crosses). The unvaccinated infection dynamics are also considered to provide a performance baseline (green circle). Each immunogen is scored relative to the unvaccinated dynamics by the maximum fitness penalty imposed upon the mean intrinsic fitness of the viral population  and the length of time over which the fitness penalty is sustained
  . Those immunogens for which no other candidate offers superior performance in both
  and
and  define the dynamically optimal Pareto frontier (red circles). Performing immunogen design using the fitness landscape alone in the absence of the dynamical simulator identifies the statically optimal candidates (blue circle). No candidate provides superior responses in both
  and
and  relative to no vaccination.
Download figure:
Standard image High-resolution image
Table 5. The seven possible CTL immunogen candidates considered for patient BR554 using no more than one epitope for each HLA. Each immunogen is scored by performing simulations of the host-pathogen infection dynamics and determining the the maximum fitness penalty imposed upon the mean intrinsic fitness of the viral population  and the length of time over which the fitness penalty is sustained
  as measured relative to the unvaccinated dynamics. The dynamically optimal immunogens indicated D are defined as those residing on the (
 ,
,  ) Pareto frontier. Those immunogens previously identified as optimal by our static design approach are indicated by S.
| Epitopes |  |
 |
Optimal? |
|---|---|---|---|
| A*02 RLIVFPDLGV | 1.01 | 0.84 | |
| A*02 ALYDVVTKL | 1.06 | 0.95 | |
| A*02 GLQDCTMLV | 1.05 | 0.95 | |
| A*31 VGIYLLPNR | 1.06 | 0.95 | S |
| A*02 RLIVFPDLGV, A*31 VGIYLLPNR | 1.03 | 1.05 | D |
| A*02 ALYDVVTKL, A*31 VGIYLLPNR | 0.75 | 0.84 | D |
| A*02 GLQDCTMLV, A*31 VGIYLLPNR | 1.04 | 0.95 |
In this case, we find five of the seven possible immunogens to provide inferior performance to no vaccination in both  and
and  . Of the remaining two, one has a superior
  but inferior
  (A*02 ALYDVVTKL, A*31 VGIYLLPNR), and one an inferior
  but superior
  (A*02 RLIVFPDLGV, A*31 VGIYLLPNR). No candidate offered superior performance in both measures. The Pareto frontier for this patient therefore comprises the two candidates residing in the upper-right and lower-left quadrants (figure 5, red circles) and there is no dominant candidate that can be declared the overall optimum. The result of the dynamical design procedure is to suggest that priming vaccine-induced immune responses within NS5B against this particular infecting HCV strain may not be a useful vaccination strategy for hosts possessing HLA alleles A*02 and A*31, and vaccine-induced CTL responses may be better directed against other regions of the viral proteome.
Compared to patient 0684MX the dynamical simulations also show the influence of vaccination to be more muted, with the measured behavior more tightly grouped around the unvaccinated performance in ( ,
,  ) space. Most of the candidates, including the statically optimal design, fall into the lower-right quadrant where performance is poorer than no vaccination. This result reinforces the value of the design protocol in explicitly modeling the coupled host-pathogen dynamics and avoiding the pitfalls of original antigenic sin [106, 107].
4. Conclusions
Data-driven viral fitness landscapes provide a powerful tool to understand and predict viral mutation and evolution. By coupling these landscapes to explicit dynamical models of the viral quasispecies and the host immune response, we have constructed a computational simulator of the coupled host-pathogen dynamics to model intrahost viral evolution. We constructed this simulator for the HCV-1a RNA-dependent RNA polymerase (protein NS5B) and the cognate CTL immune pressure. Viral dynamics are treated by an agent-based Fisher–Wright model. CTL dynamics are modeled by a set of coupled ordinary differential equations that we integrate stochastically using Gillespie dynamics to model the effects of small effective population sizes. High levels of recognized viral strains stimulate the proliferation of cognate CTLs, and elevated CTL levels impose fitness penalties upon recognized viral strains.
We demonstrated that the model can robustly recapitulate the patterns and timing of mutations that arise over the course of infection by comparing the model predictions against longitudinal sequencing data. This provides strong support that our relatively simple model is sufficiently realistic to account for the salient features of the viral evolution and coupled host immune responses. We then used the dynamical model to perform exhaustive computational evaluation of putative immunogen candidates for two selected individuals. We evaluate each immunogen candidate according to the magnitude and longevity of protection to identify good potential CTL immunogen formulations for incorporation into a possible vaccine. Moreover, our model provides new understanding of the underlying CTL dynamics that lead to the observed behaviors. In one individual, we identify a NS5B epitope-based immunogen candidate that offers superior strength and duration of protection relative to no vaccination. In the other individual, our model predicts that none of the possible immunogens can simultaneously offer elevated magnitude and longevity of protection, and suggest that a CTL vaccine immunogen may more profitably incorporate epitopes from other viral proteins. A number of immunogen candidates also lead to behavior reminiscent of original antigenic sin, in which priming of immune responses against poor viral targets can compromise responses against potentially more protective targets.
We also compare the dynamically optimal candidates against those developed by a static design protocol in which immunogens were selected to maximally suppress the mean fitness of a viral population equilibrated to the underlying fitness landscape. The observed impact of the dynamic design protocol was to typically adjust the static immunogen formulations to also provide longevity of protection and avoid original antigenic sin. Analysis of the CTL and viral time courses provides understanding of the particular escape pathways that are blocked, and how the viral quasispecies is shepherded over the fitness landscape by the host immune pressure.
This work establishes and validates a dynamic simulator of HCV evolution over an empirical fitness landscape determined for one viral protein, and presents a proof-of-principle demonstration of its utility in computational vaccine design. By exhaustively evaluating the efficacy of putative immunogen candidates, the simulator may be used to identify a small number of formulations for potential incorporation into an epitope-based immunogen and provide precepts for rational immunogen design. This computational screen can offer savings in time, labor, and expense associated with experimental and clinical vaccine testing.
The present work considers only a single HCV protein but as fitness landscapes become available for the other proteins and computational power increases, we anticipate that this approach may be extended to the design of full proteome epitope-based vaccines incorporating T-cell and antibody epitopes. We also observe that our approach may be straightforwardly extended to any virus for which empirical fitness landscapes and host immune targets are known. We also only considered the tailored immunogen design for two individuals with particular HLA haplotypes and infecting strains corresponding to a form of personalized medicine. Extension of the approach to the design of a vaccine for a particular demographic group or geographical region would require that the design strategy be expanded to the distribution of HLA types within the population and optimized over the distribution of potential infecting viral strains. Such an immunogen would offer broad protection to the whole population to present a more cost-effective and scalable vaccination strategy than individualized vaccines optimized for specific HLA haplotypes. Although computationally intensive, it is not outside the reach of computational tractability to conceive of a multi-scale model of viral infection in which we explicitly couple our model of intrahost viral dynamics to an epidemiological model infection within a community, thereby establishing a powerful and realistic treatment of the multi-scale nature of viral infection dynamics.
Acknowledgments
This research is part of the Blue Waters sustained-petascale computing project, which is supported by the National Science Foundation (awards OCI-0725070 and ACI-1238993) and the state of Illinois. Blue Waters is a joint effort of the University of Illinois at Urbana-Champaign and its National Center for Supercomputing Applications. This work used the Extreme Science and Engineering Discovery Environment (XSEDE), which is supported by National Science Foundation grant number ACI-1548562, superMIC at the Louisiana State University Center for Computation and Technology, Comet at the San Diego Supercomputer Center, and Bridges at the Pittsburgh Supercomputing Center through allocation MCB160029.