

Abstract
The Dark Energy Spectroscopic Instrument (DESI) is a 5000 fiber multi-object spectrometer now being installed at the prime focus of the 4 m Mayall telescope at Kitt Peak. Using DESI to measure ∼35 million galaxy redshifts and using the Baryon Acoustic Oscillation (BAO) technique to measure distances, the results will probe the nature of the recently discovered mysterious component of our universe called dark energy. Computer controlled robotic positioners move the 120 μm diameter fibers to positions of galaxies whose location on the sky have been obtained in a previous target selection imaging survey. To achieve good throughput the fibers should be centered on the target position to within 3 μm. The robotic positioners however are only capable of a 50 μm precision on their first move. To achieve the desired precision, the Fiber View Camera (FVC) system has been implemented. The FVC, located near the hole in the primary mirror of the Mayall telescope, has been designed to take an exposure of the focal plane, located at the prime focus some 12 m above the FVC, after the robotic positioners have completed their first move. The FVC is intended to measure the fiber locations with a precision of 3 μm and issue a set of fiber coordinate corrections for the second move correcting the fiber positions by the robotic positioners. Tests show that after two iterations better than 99% of the fibers will be in their intended location to within the desired precision. This paper describes the design of the FVC system, the R&D program preceding the final design, and the tests that have been carried out to demonstrate that the FVC can achieve the required precision.
Export citation and abstract BibTeX RIS

Original content from this work may be used under the terms of the Creative Commons Attribution 3.0 licence. Any further distribution of this work must maintain attribution to the author(s) and the title of the work, journal citation and DOI.
1. Introduction
The Dark Energy Spectroscopic Instrument (DESI) is a ground-based project with the primary goal of studying the nature of dark energy using the Baryon Acoustic Oscillation (BAO) method (Flaugher & Bebek 2014). The DESI instrument is a robotically actuated, fiber-fed spectrograph capable of taking up to 5000 simultaneous spectra over a wavelength range from 360 nm to 980 nm. The 120 μm diameter fibers feed ten three-arm spectrographs with resolution R = λ/Δλ between 2000 and 5500, depending on wavelength. The fiber positioners and guiders are being installed at the prime focus of the new wide field optical correctors on the 4 m Mayall telescope in Kitt Peak, Arizona. The new optical corrector will provide a three-degree diameter field of view. The spectrographs are being installed beneath the telescope floor in the same building.
The fibers feeding the spectrographs will be positioned on the focal plane by computer controlled robotic positioners (Schubnell et al. 2016) at the locations of galaxies selected from a previously carried out target selection survey (Dey et al. 2018). To keep the throughput of the fibers as high as possible, it is desired to position the center of the fibers on the galaxy location with a 3 μm precision on the focal plane (this corresponds to 0.05 arcsec on the sky). The robotic positioners, however, are capable of achieving only a 50 to 100 μm precision on their first move. The function of the Fiber View Camera (FVC) system is to obtain the desired 3 μm precision in the following way. After the robotic positioners have completed their first round of positioning the 5000 fibers, the FVC camera will be instructed to take an exposure of the entire focal plane, calculate the positions of each fiber to a 3 μm precision, and feed this information back to the computer system controlling the positioners. Based on the differences between the FVC measured actual position and the desired position of each fiber, a correction move will be given to the fibers. This correction move will be typically quite small, less than 100 μm, and can be carried out with a much higher precision than the first move by the positioners. Tests (Schubnell et al. 2016) have shown that after two iterations of this procedure better then 99% of the fibers will reach their positions with the desired precision. A similar device, called the Metrology Camera System, has been developed for the Prime Focus Spectrograph for the Subaru Telescope, with comparable goals and performance to the FVC system described here (Wang et al. 2014).
A secondary function of the FVC camera will be to tie the local positions of fibers in the DESI focal plane to their corresponding astrometric position on the sky. This will be achieved by situating 10 guide cameras (guide and focus arrarys (GFAs)) at the edge of the DESI focal plane, uniformly distributed around the circumference. Each FVC image of the focal plane will show not only the fiber positions, but also the position of illuminated fiducials mounted to each GFA. With the GFAs recording images of astrometric sources on the sky, the resulting field astrometry will determine the celestial coordinates of the nearby fiducials. The astrometric positions of the fibers will then be determined from their positions in the FVC image relative to the GFA fiducials.
Section 2 of this paper will describe the design of the FVC system. Section 3 will describe the R&D program on the prototype system and Section 4 will describe the final implementation of the FVC. Section 5 will describe the illuminated fiducials that will be used to calibrate each exposure, and Section 6 will describe the FVC software. Section 7 will describe results of the ProtoDESI test run on the Mayall telescope.
2. Design of the FVC System
The performance requirements on the FVC system are summarized in Table 1. A main design consideration was to be able to see the entire 815 mm diameter focal plane, located at the prime focus of the Mayall telescope, in a single field of view. A convenient location of the FVC is near the hole in the primary telescope mirror, looking up at the prime focus, approximately 12.5 m below the focal plane, as shown in Figure 1. An approximately 40 mm wide CCD in the FVC calls for a desired demagnification by the FVC of 20 to 25. This location has the complication that the FVC sees the focal plane through the distortions of the telescope corrector optics. Given the distortions of the corrector optics a 600 mm focal length lens on the FVC is needed to accomplish this. To allow the FVC to record the fiber positions, the fibers will be back illuminated from the spectrometer enclosure by monochromatic light with 470 nm wavelength during the FVC exposures. The 470 nm was chosen as a convenient wavelength near the peak sensitivity of the FVC CCD detector.
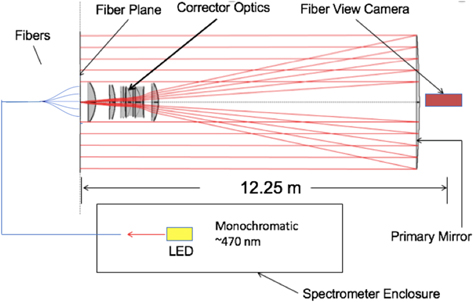
Figure 1. Location of the Fiber View Camera in the Mayall telescope. The red lines indicate rays from an object on the sky and are shown to indicate that the FVC does not obstruct any of the light entering the telescope. The blue lines show the back illuminated fibers whose light then pass through the corrector optics to the FVC.
Download figure:
Standard image High-resolution imageTable 1. FVC Performance Requirements
| Parameter | Requirement |
|---|---|
| Fiber position measurement precision | 3 μm |
| Nearest-neighbor distance | 1 mm |
| Exposure, readout, and computing time | 5 seconds |
Download table as: ASCIITypeset image
After considerable research into available components, the following design for the FVC was arrived at, as summarized in Table 2.
Table 2. FVC Design Components
| Feature | Value |
|---|---|
| CCD | Kodak KAF-50100 |
| Pixel count | 50 Mpixels |
| Pixel array | 6132 × 8176 |
| Pixel size | 6 μm × 6 μm |
| Active area | 37 mm × 49 mm |
| Quantum efficiency | 25% |
| Dark current at 25oC | 15 e/pix/sec |
| Read noise | 12.5 e |
| LENS | Canon EF600 mm f/4 L II USM |
| Focal length | 600 mm |
| Maximum aperture | 150 mm |
| Demagnification | 25 |
| ELECTRONICS | FLI Microline 50100 |
| Readout rate | 12 MHz |
| Cooling | Thermoelectric and air-cooled |
| Focusing, aperture setting, shutter | Computer controlled |
| OPERATING PARAMETERS | |
| Exposure time | 1 second |
| Readout time (6 × 6 Mpix area) | 3 seconds |
| Lens setting | f/21 |
| CCD temperature | −10° C |
| Dark current at −10° C | 0.5 e/pix/sec |
| Camera body temperature | Telescope ambient |
Download table as: ASCIITypeset image
As mentioned above, the FVC sees the focal plane through the corrector optics designed by DESI for the Mayall telescope (Doel et al. 2014; Miller et al. 2018). After the design of this corrector optics was finalized, the effects of the distortions on the FVC images were carefully simulated using the beam trace program BEAM4 (Lampton 1985) with the detailed design parameters of the corrector. It was found that the ∼5 μm images of the fibers on the FVC CCD (120 μm diameter fibers demagnified by 25) were not noticeably degraded by the corrector optics. However, a non-negligible radial distortion of several hundred microns on the FVC image plane was introduced that will have to be corrected for. The demagnification of the FVC was also affected, making the demagnification with a 600 mm lens at 12.5 m closer to 25 than to 20. The corrections for the corrector optics, as well as the distortions of the 600 mm FVC lens will be carried out in the following way. There will be 120 illuminated fiducials on the focal plane (see Section 6) whose positions will be precisely measured before the focal plane is installed on the telescope. These fiducials will be recorded in each FVC image taken. Simulations show that a third-order polynomial formula is sufficient to correct the distortions to the desired precision. This correction will be done separately for each exposure of the FVC so that any slight shifting of the position of the FVC with respect to the focal plane due to the motion of the telescope as well as thermal effects will also be corrected for as well.
Although the fiducials can be used to locate the fibers as described, it is not an essential requirement of the system. This is because the placement of the FVC near the vertex of the telescope primary ensures that when the fibers are on target, their positions in the FVC image are nearly coincident with the locations their targets would have if the FVC where imaging the sky directly (allowing for a reflection). Knowledge of the FVC lens distortion alone, and the local distortion of the DESI corrector near the fiducials on the Guide Cameras will be sufficient to guide the fibers on target (Kent 2018).
3. The R&D Program
An R&D program was carried out at Yale University to ascertain that an FVC system could achieve the requirements listed in Table 1. A prototype camera was constructed. A Finger Lakes Instrument (FLI) Proline 50100 camera6 was used, which is identical to the FLI Microline camera used in the final camera except for a slightly different shape camera body and a slower readout time. At that early stage in DESI design the plan was to locate the FVC above the hole in the Mayall telescope primary mirror about 8 m below the DESI focal plane, so a 400 mm Canon lens was used in the prototype camera. Figure 2 shows a photo of the final camera with the 600 mm lens. An important point to note is that the glass window of the FLI camera had to be replaced by an optical flat glass to eliminate the distortion introduced by the standard glass window originally provided by FLI.
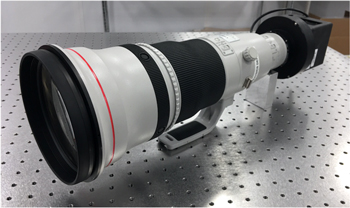
Figure 2. Fiber View Camera with the 600 mm lens.
Download figure:
Standard image High-resolution imageAn 8 m long test bench was set up in a Yale cleanroom with a test focal plane at one end and the FVC on the other. The test focal plane consisted of an invar plate 18 by 24 inches with 64 embedded optical fibers, each of 120 μm diameter (the same as the final DESI instrument). The positions of these fibers were measured with a precision of 1.5 μm using a high-precision optical measuring machine at Yale.7 The fibers were back illuminated with 470 nm monochromatic light. Many FVC exposures were taken with varying conditions such as exposure time, lens aperture, fiber illumination level, temperature, and camera orientation. As a reminder, a 3 μm precision on the focal plane at a demagnification of 25 means a 0.12 μm precision on the FVC CCD, or 1/50 of a 6 μm pixel. To achieve this required the development of highly optimized set of centroiding algorithms, described in Section 6, which did in the end succeed. One very important parameter in achieving this precision is the image FWHM on the CCD. The 120 μm fibers at a demagnification of 25 produce a 4.8 μm image, which typically falls into one 6 μm pixel, and there is not enough flux in neighboring pixels to allow good interpolations for centering. It was found that a FWHM of 10 μm, or 1.6 pixels, gave the best centering. The centering degraded slowly as the image size became bigger. Closing the lens aperture down to f/21 gives a diffraction peak width of 10 μm. This was found to be a very robust way to operate the FVC, as the size of the diffraction peak at a given f stop is very stable. Another important consideration is the brightness of the illuminated fibers. It was found that a level producing between 10,000 and 40,000 electrons in a full CCD image was optimum. Below that range, statistics were limiting, and above that CCD pixels started to saturate. A light level producing 25,000 electrons was chosen as a good operating point. Under the best operating conditions, a precision somewhat better than the required 3 μm was achieved in a very stable way, as seen in Figure 3.
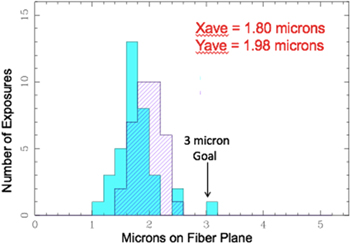
Figure 3. Fiber position precision on focal plane from lab tests at Yale University with the prototype 400 mm lens at 8 m with 1 second exposures. Solid histogram is X, crosshatched is Y.
Download figure:
Standard image High-resolution image4. Implementation of the Final Camera
4.1. The Final Camera and Lens
As discussed in Section 2, the final location of the FVC is near the vertex of the Mayall primary mirror approximately 12.25 m from the focal plane, as shown in Figure 1. Thus, the final FVC was constructed as summarized in Table 2 above with the FLI Microline 50100 camera and a 600 mm f/4 Canon telephoto lens. One important point was that the Canon lens came with automatic Vibration Correction (Image Stabilization) feature that allowed some of the elements inside the lens to move as the lens was moved around. This caused the FVC image to shift as the telescope was slewed to different positions. Canon was able to retrofit the lens, fixing all of its internal elements, eliminating this problem. However, to avoid the complexity inherent in the stabilization optics, an older-model 600 mm f/4 Canon telephoto lens was acquired, with this model having no image stabilization. We refer to this simpler model as Lens 1, and the newer lens with frozen stabilization elements as Lens 2. As in the prototype camera, the FLI camera body had to be outfitted with a Canon EF lens mount8 so that the Canon lenses can be conveniently mounted on the cameras and allow the computer control of the focus and aperture setting of the lenses. The lens also has a narrow-band (470 ± 50 nm) filter to reduce stray light entering the FVC.
4.2. The FVC Support Structure
The 600 mm lens was quite long (45 cm) and heavy (3.9 kg), so a support cage, shown in Figure 4, was built to hold the camera and the lens together in a stable position. This camera and lens support cage will mount to the rear face of the Mayall telescope primary mirror support cell, permitting a view of the fibers on the focal plane through the hole in the primary mirror. This location allows easy access for the camera cables and allows for the evacuation of hot air from the camera cooling fans.

Figure 4. Support cage for the FVC with the 600 mm lens.
Download figure:
Standard image High-resolution image4.3. Lab Tests of the Final FVC
A longer test bench has been set up at Yale with the same 18 by 24 inch test focal plane (see Section 3) and the final FVC camera with the 600 mm lens. In this setup, images have been taken of the focal plane from a 12 m distance. The precision on the fiber plane from these tests is shown in Figure 5. The precision at 12 m is slightly worse then at 8 m (as seen in Figure 3), but still quite acceptable. We believe that at least part of the difference between the 8 m and the 12 m results is due to air turbulence at 12 m in the Yale test setup.

Figure 5. Precision on the fiber plane with the 600 mm lens at 12 m with 1 second exposures. Solid histogram is X, crosshatched is Y.
Download figure:
Standard image High-resolution image4.4. Spare Camera and Lens
An identical FLI Microline 50100 camera with a Canon EF lens mount was purchased, and a second camera/lens support cage was built. This system has been assembled with a newer model Canon 600 mm lens (Lens 2; see Section 4.1) as a spare FVC system.
4.5. Lens Distortion Measurements
The optical distortion of both the final 600 mm lens (Lens 1) and the spare 600 mm lens (Lens 2) have been measured at Yale. Exposures with both lenses were taken of three different target plates. The first was the fiber plate discussed above with 64 fibers whose positions were measured to a 1.5 μm precision on the Yale optical measuring machine. The second was an optical quality glass plate with a few hundred etched marks whose positions were known to a few microns. The third was a 17'' by 17'' photographic star plate taken in the 1970 s with the Yale double astrograph (Lee & van Altena 1983). It contains thousands of star images whose positions have been measured to a 1 μm precision by the PDS digitizing machine of the Yale Astronomy Department (Lee et al. 1986). Data were taken at distances between 6 m and 12 m between the lens and the target plane. The combined data from all three targets was used to determine the distortions. The distortions are parametrized as third-order polynomials in Cartesian X and Y coordinates:
where X, Y are on the focal plane in mm, x, y are on the CCD in units of pixels. a10 and b01 are the magnifications in units of mm/pixel, a30, a12, b03 and b21 are in units of mm/pixel3. In units of pixel/pixel, a10 and b01 are equal to 1.0, and in units of pixels/pixel3, a30, a12, b03 and b21 show no significant dependence on distance. The parameters at 12 m are given in Table 3 for the two lenses.
Table 3. Distortion Parameters for the 600 mm Canon Lenses at 12 m
| Coefficient | Lens 1, Units of 10−11 mm/pixel3 | Lens 2, Units of 10−11 mm/pixel3 |
|---|---|---|
| a30 | −4.25 ± 0.02 | −0.043 ± 0.02 |
| a12 | −4.37 ± 0.02 | −0.191 ± 0.02 |
| b03 | −4.12 ± 0.02 | −0.157 ± 0.02 |
| b21 | −4.32 ± 0.02 | −0.147 ± 0.02 |
Download table as: ASCIITypeset image
All of the other third-order coefficients were consistent with zero for both lenses. The similarity of the four coefficients to each other for Lens 1 indicates that the distortions are mostly radial with close to rotational symmetry. It is interesting to note that Lens 2, the newer model lens that required alterations to freeze the stabilization optics, has much lower distortion than the older-model lens with no image stabilization optics. At the edge of the CCD at x = 3000 pixels the coefficients translate to a distortion of 1150 ± 5 μm on the image plane for Lens 1, and 42 ± 5 μm for Lens 2. Both will have to be corrected for, and the corrections are known to similar precision.
4.6. Thermal Tests
Two kinds of thermal tests were carried out for the camera, both 600 mm lenses, and the illuminated fiducials. The first was an operational test. All components were found to operate normally at −10° C and at +30° C. The distortion parameters were measured at 0° C and 20° C and showed no significant dependence on the temperature. Survival tests were carried out by finding that each component was operating normally after cycling eight times from −20° C to +60° C at a rate of 20° C per hour. The positions of the light spots on the illuminated fiducials (see Section 5) did not change significantly after the thermal cycling.
5. The Illuminated Fiducials
To be able to correct for the distortions caused by the DESI corrector optics on the Mayall telescope, as well as the FVC 600 mm lens, there will be fiducials that will be illuminated so they will appear in every image of the fiber plane taken by the FVC. There will be 10 fiducials spread out over each of the 10 pie-shaped petals that make up the DESI image plane, and 2 fiducials on each of the 10 GFA cameras on the outer edge of the focal plane, for a total of 120 fiducials. The physical location of the fiducials attached to each GFA will be measured to high precision with respect to each GFA's pixel array. Images of these GFA fiducials will tie the pixel coordinates of the FVC images to the celestial coordinates. The illuminated tip of the fiducials will be at the same level as the fiber tips in the positioners, as shown on Figure 6, for a petal (the fiber tips are not shown). The GFA camera is visible on the left hand corner of the petal, with two fiducials attached to the GFA camera shown in red.
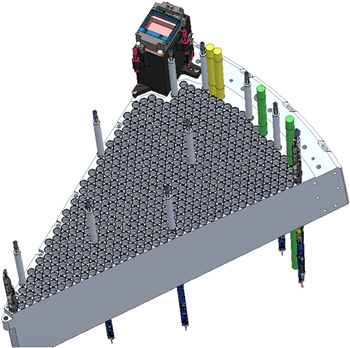
Figure 6. Location of the illuminated fiducials on the petals and the GFA cameras.
Download figure:
Standard image High-resolution imageEach fiducial has the shape of an 8 mm diameter tube (see Figure 7) with threads 86.5 mm below the tip that allows the fiducials to screw into the same holes on the petals that the positioners are inserted into. At the tip of each fiducial there is a glass block with a 3.5 mm diameter and 3.0 mm length, with a ground glass finish on the inside surface and an opaque blue chrome finish on the top surface. Four 10 μm diameter pinholes in a pattern shown in Figure 8 are etched in the top surface of the glass block that are illuminated by a monochromatic 470 nm LED below each glass block, as can be seen in Figure 7.

Figure 7. Sketch of the illuminated fiducials showing the locations of the glass block with the illuminated pinholes and the LED illuminating them.
Download figure:
Standard image High-resolution image
Figure 8. Left: the glass block at the tip of each fiducial; Right: the pattern of the four pinholes at the opaque top surface of the glass block. The spacing of the two pinholes that form the vertical leg on the figure above is 1.2 mm and the spacing between the two pinholes that form the horizontal leg is 1.6 mm.
Download figure:
Standard image High-resolution imageFor each fiducial, the location of each of the four pinholes has been precisely measured with respect to the circumference of the tip of the casing of each fiducial using an optical measuring machine at Yale. After insertion of the fiducials in each petal of the focal plane the position of each fiducial is measured using a touch probe measuring machine at Berkeley that measures the exact location of the circumference of the tip of the casing of each fiducial. The Yale measurements are then used to translate these touch probe measurements to get the precise location of the pinholes. The reason for a pattern of four pinholes rather than just one is that the rotational orientation of each fiducial after being screwed into the holes in the petals is uncertain but is clearly determined by the pattern of the four holes in the FVC image.
6. FVC Software
Software (hereafter the "FVC code") was written to both control the FVC and to detect and measure accurate centers for each illuminated fiber or fiducial pinhole in the FVC images. The code was written to meet the requirement that after readout of the image, the further identification and centering of the sources (5000 fibers plus 480 pinhole spots) could be achieved in <1 sec.
- 1.The usual CCD image preprocessing steps include corrections for pixel-to-pixel bias patterns, dark current patterns, and quantum efficiency patterns. For our CCD's the QE corrections are small enough that our measured errors are within our requirements, so we do not use flat fields. At our CCD operation temperature and readout time, the dark current contribution is mostly insignificant compared with the signal, except in the region of hot pixels. For this reason, we apply a dark correction. Our dark exposures will be taken with fibers and fiducials off but shutter open, so as to include any stray dome light. Our dark exposure times are one second, equal to our data exposure times, so the bias patterns in each are the same, and they are taken at the same CCD temperature. Our image correction is thus to simply subtract our average dark image from each signal image. However it should be pointed out that, unlike in most CCD imaging applications, we will not be dealing with faint images because we control generous levels of illumination for both the fibers and the fiducials, and we are not interested in measuring the illuminating light levels, so that the centering precision is quite insensitive to the preprocessing details.
- 2.Next find all image pixels with (a) a peak intensity exceeding a pre-tuned threshold and (b) grouped into connected regions with a pixel span no smaller or larger than a pre-tuned size range. The pre-tuning step (repeated a few times each night as necessary) determines the appropriate intensity and size threshold for detecting only the sources of interest and avoiding the detection of noise sources (e.g., hot pixels and cosmic rays).
- 3.Finally, we measure the centroids of each pixel group using code that was earlier developed to quickly and accurately fit the narrow intensity profile of stars in digitially scanned photographic plates (Lee & van Altena 1983). The two-dimensional intensity profile of each source is fit with an elliptical Gaussian. The code is robust in that it gives near-optimal centering precision for images with FHWM equal to 1.6 pixels, without any adverse undersampling issues that other centering algorithms can suffer from at this narrow width. Simulations were carried out to determine how close two images can be to each other and still be resolved. The 1 mm nearest-neighbor distance requirement stated in Table 1 was easily satisfied (not surprising as 1 mm on the focal plane is 40 μm or ∼6 pixels on the CCD where the images have a FWHM of 1.6 pixels). This code is run on an NUC computer with 4 Core-5i processors to achieve the 1 second requirement on the processing of the 5000 fibers and the 120 fiducials.
Additional code (hereafter the "matching code") was written to (a) match the detected sources in the image to the positions expected for each fiducial and fiber and (b) to determine the central location of the fiducials (in pixels) based on known position of the 4 pinholes with respect to the fiducial center (determined from earlier metrology). Special procedures were developed to handle cases where fiber locations were unknown (for example, after a power or computer failure), the orientation of fiducial spots were unknown, and where some fiducial spots were invisible (because of dust contamination).
7. The ProtoDESI Test Run
In the fall of 2016, DESI carried out a test run on the Mayall telescope with a number of final DESI components (Fagrelius et al. 2018). The purpose of this test run was to verify that the robotic fiber positioners, the Fiber View Camera system with its illuminated fiducials, and the GFA camera, were able to position the fibers on the correct positions to image several preselected target galaxies. A reduced size focal plane (175 mm diameter) was constructed with four actual fiber positioners, 16 illuminated fiducials, and one GFA camera. The positions of the fiducials on this focal plane were measured by the Berkeley CNN touch probe measuring machine by touching the circumference of the fiducial tips. The measurements at Yale of the location of the four pinholes on each fiber relative to the tip circumference was used to define the positions of the pinholes in the focal plane coordinate system. This reduced size focal plane was installed at the prime focus of the Mayall telescope at Kitt Peak. The FVC was installed in its final location under the primary mirror, approximately 12.25 m below the focal plane, with the final 600 mm lens and the final support structure. The prototype Proline 50100 camera was used, which, as already pointed out, is identical to the final Microline 50100 camera except for a small modification in the shape of the camera body.
After commissioning the instruments 450 exposures were taken of the focal plane with the FVC under various conditions, with exposure times varying from 0.5 to 10 seconds, keeping the fiber and fiducial illuminating light levels roughly constant to produce 15,000 electrons in the full images on the FVC CCD (this illumination level, more convenient in this test setup then the planned 25,000 electrons for DESI operations, was still well within the 10,000 to 40,000 electron acceptable illumination range). These exposures were made by necessity looking through the previously existing corrector optics on the Mayall telescope. The FVC images of the 16 fiducials were used to characterize the distortions caused by the Mayall corrector optics, using a third-order polynomial in x and y described in Section 4.5 above. The corrector optics distortions were determined to a high precision, combining all 450 exposures because the distortion was the same for all of them. Using this distortion correction the positions of the fiducials measured by the FVC were compared to their previously measured positions. The precision of the FVC measurements are shown in Figure 9 versus the exposure time.

Figure 9. Precision in the FVC measurement of the fiducials on the focal plane compared with their previously measured positions.
Download figure:
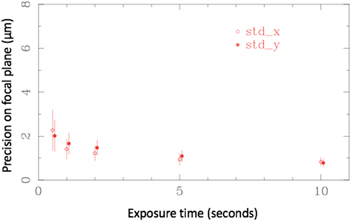
Standard image High-resolution imageThe position of the fibers in the three fiber positioners could not be measured before installing the focal plane on the telescope. They were, however, held fixed during the entire 450 FVC exposures. The distortion parameters from the fiducials were used to obtain a measurement of the three fiber positions from each FVC exposure. The error on the FVC measurement of the fiber positions was taken to be the rms of the different FVC measurements of each fiber. This measurement precision is shown versus exposure time in Figure 10.
As can be seen from Figures 9 and 10, the FVC measurement errors for the fiducials and the fibers are similar. There is a small improvement with exposure time which is not well understood. One explanation might be that there is a small air turbulence in the Mayall telescope with such a time structure that the distortions tend to average out over longer exposure times. The precision of the FVC measurements, however, satisfies the 3 μm requirement even at the 0.5 second exposure time. Thus, the air turbulence, if any, in the Mayall telescope does not spoil the FVC precision.
Figure 10. Precision in the FVC measurement of the fiber positions on the focal plane.
Download figure:
Standard image High-resolution image
8. Conclusion
This paper presents the design and implementation of the Fiber View Camera system that is intended to help the DESI multi-object spectrometer locate its 5000 fibers at their target position with the required precision. Tests that have been carried out show that the FVC is able to achieve the desired precision in measuring the location of the fibers on the DESI focal plane.
This research is supported by the Director, Office of Science, Office of High Energy Physics of the U.S. Department of Energy under contract No. DE–AC02–05CH1123 and by the National Energy Research Scientific Computing Center, a DOE Office of Science User Facility under the same contract; additional support for DESI is provided by the U.S. National Science Foundation, Division of Astronomical Sciences under contract No. AST-0950945 to the National Optical Astronomy Observatory; the Science and Technologies Facilities Council of the United Kingdom; the Gordon and Betty Moore Foundation; the Heising-Simons Foundation; the National Council of Science and Technology of Mexico, and by the DESI Member Institutions. The effort at Yale is supported by the Office of Science of the US Department of Energy through grant No. DE-FG02-92ER40704. The authors are honored to be permitted to conduct astronomical research on Iolkam Du'ag (Kitt Peak), a mountain with particular significance to the Tohono O'odham Nation.
Footnotes
- 6
Finger Lakes Instruments LLC, Lima, NY.
- 7
Model Avant ZIP 400, Optical Gauging Products, Rochester, NY.
- 8
Birger Engineering Inc, Boston, MA.