Abstract
In the early Galaxy, elemental abundances of the extremely metal-poor (EMP) stars contain abundant information about the neutron-capture nucleosynthesis and the chemical enrichment history. In this work, we study the abundance characteristics of Sr and Ba for the EMP stars in the [Sr/Ba] vs. [Ba/Fe] space. We find that there are three boundaries for the distribution region of the EMP stars. The weak r-process star CS 22897–008 lies on the upper end and the main r-process stars lie on the right end of the region. Near the right boundary of the distribution region, there is an Fe-normal belt. For the EMP stars in the belt, element Fe dominantly originates from the normal massive stars. The low-Sr stars ([Sr/Fe]≤−0.3) distribute in the region of the lower left of the Fe-normal belt and their Fe should originate partly from the prompt inventory. We find that the formation of the lower boundary of the distribution region is due to the pollution of the main r-process material and the formation of the right boundary could be explained by the combination of the weak r- and main r-process material. Furthermore, the formation of the left boundary is due to the pollution of the weak r-process material. Although the [Sr/Ba] ratios are related to the relative importance of the weak r-process material, the scatter of [Sr/Ba] ratios for the EMP stars mainly depends on the abundance ratio of the weak r-process.
Export citation and abstract BibTeX RIS
1. Introduction
Elemental abundance ratios of the extremely metal-poor (EMP) stars ([Fe/H]≤ −2.5) are used to probe the nucleosynthetic characteristics, since the stars are formed in the early Galaxy and the gas clouds in which the stars formed were polluted by only a few nucleosynthetic events (McWilliam et al. 1995; Ryan et al. 1996; Frebel & Norris 2015). Elements beyond zinc are believed to be created mainly by the slow (s) and rapid (r) neutron-capture (ncapture) processes. The r-process, building up about a half heavy elements in the universe, is divided into two subcomponents. The weak r-process, which is also called "lighter element primary process" (Travaglio et al. 2004) or "limited r-process" (Cain et al. 2018; Frebel 2018), can create the lighter n-capture elements within 38 ≤ Z < 56. The determinate astrophysical site (or sites) of the weak r-process remains (or remain) unclear (Frebel 2018). The main r-process can create both light and heavy n-capture elements. The site of the main r-process had long been debated (Sneden et al. 2008; Thielemann et al. 2011). Recently, neutron star mergers (NSMs) are believed to be the most promising site for the main r-process nucleosynthesis (Cowperthwaite et al. 2017; Drout et al. 2017; Thielemann et al. 2017; Ji & Frebel 2018; Côté et al. 2018). Based on the study of the r-process nucleosynthesis yields from the dynamical ejecta mass produced by NSMs GW170817, Abbott et al. (2017) reported that, if more than 10% of the ejecta is changed into the rprocess elements, NSMs could fully explain the r-process abundances in the Galaxy. Furthermore, the identification of strontium in the spectra of AT2017gfo from the mergers GW170817 (Watson et al. 2019) could be an evidence that the origin of the r-process elements is the NSMs. It is significant to note that the Sr abundances of the EMP stars are related to both the main r-process and the weak r-process, so the Sr abundance ratios contain the abundant information about n-capture nucleosynthesis and enrichment history of the early Galaxy. Furthermore, [Sr/Fe] ratios also contain the information about the astrophysical origin of the element Fe.
Because the metal-poor stars CS 31082-001 and CS 22892-052 are largely enhanced with the r-process elements (e.g., [Sr/Fe] ≃ 0.8, [Eu/Fe] ≳ 1.6) (Hill et al. 2002; Sneden et al. 2003) and exhibit a distinct r-process abundance pattern, they are considered as the main r-process stars (Sneden et al. 2008). On the other hand, the metal-poor stars HD 122563 and HD 88609 show low abundances of the n-capture elements (e.g., [Sr/Fe] ≃ 0, [Eu/Fe] < 0) (Honda et al. 2006, 2007) and are treated as the weak r-process stars (Honda et al. 2007; Montes et al. 2007). In order to investigate the astrophysical origins of the n-capture elements, the abundance characteristics of the EMP stars should contain the abundant information (McWilliam 1998; Honda et al. 2004). Because the lower limit of [Sr/Fe] ratios of the weak r-process stars is about − 0.3 ± 0.2 dex (Honda et al. 2004, 2007) and the upper limit of [Sr/Fe] ratios of the main r-process stars is about 0.8 ± 0.2 dex (Aoki et al. 2010), considering the observed uncertainties, the Sr abundances of the very metal-poor stars within the range of − 0.3 < [Sr/Fe] ≲ 1.0 should be explained by the combined contributions of the weak r-process and main r-process (Spite et al. 2018). On the other hand, some metal-poor stars show low Sr abundances with [Sr/Fe] ≲ −0.3 (Honda et al. 2004; Barklem et al. 2005; Franc¸ois et al. 2007; Hollek et al. 2011; Cohen et al. 2013; Roederer et al. 2014; Li et al. 2015a; Jacobson et al. 2015; Hansen et al. 2015; Mardini et al. 2019), which are lower than the observed [Sr/Fe] ratios of the weak r-process stars and are named as low-Sr stars in this work. Obviously, an additional Fe inventory is needed for explaining the low [Sr/Fe] ratios of the low-Sr stars. Qian & Wasserburg (2001) have suggested that, in the early Galaxy, there should exist another nucleosynthetic component originated from the first very massive stars. This component is called as the initial or prompt(p-) inventory and only produces Fe and light elements. However, the effect of the p-inventory on the abundances of the EMP stars has not been studied in detail. Using a three-component model with HNe, H and L. sources, Qian & Wasserburg (2008) quantitatively explained the great shortfall of the abundance ratios [Sr, Y, Zr/Fe] in some metal-poor stars with [Fe/H] ≲ −3. In recent years, much more abundance data of new detected EMP stars are presented (Lai et al. 2008; Mashonkina et al. 2010; Hollek et al. 2011; Cohen et al. 2013; Roederer et al. 2014; Mashonkina et al. 2014; Siqueira Mello et al. 2014; Li et al. 2015b,a; Jacobson et al. 2015; Hansen et al. 2015; Aoki et al. 2017; Cain et al. 2018; Spite et al. 2018; Mardini et al. 2019).
Recently, based on the abundance analysis of the EMP stars, Spite et al. (2018) reported that, within the first peak elements, the abundances are well correlated, which is similar to the correlation inside the abundances of the second-peak elements. However, they found that there is no correlation between any first peak element with any second peak element and the distribution of the EMP stars in [Sr/Ba] vs. [Ba/Fe] space shows a very complex enrichment picture. Spite et al. (2018) also pointed that the star CS 22897–008 is a r-poor star with high [Sr/Ba] ratio (1.59 ± 0.28) which is higher than the ratio of HD 122563. Although there have been many theoretical and observational studies of the r-process nucleosynthesis, the astrophysical information emerged from the abundance distribution of the n-capture elements of the EMP stars have not been revealed in detail. In this case, it is of the upmost importance to collect a large number of first and second peak elements in the metallicity range −4.5≲[Fe/H]≲ −2.5, to explore the nucleosynthesis processes and enrichment history in early Galaxy (Andrievsky et al. 2011; Siqueira Mello et al. 2014; Spite et al. 2018; Cowan et al. 2019). In order to better understand the abundance distribution of the n-capture elements, more detailed studies about the enrichment history of the EMP stars are still needed. This motivates us to study the abundance relations between Sr and other elements (Ba and Fe). In Section 2, we study the abundance relation of the EMP stars between the first peak element Sr and the second peak element Ba. The relation of Fe produced in the normal massive stars and the weak r-process elements, the effect of the p-inventory on the abundances of the low-Sr stars, the relation of the pollution tracks and the abundance boundaries, the relation of the scatter trend and the ratios of the r-process are studied in [Sr/Ba] vs. [Ba/Fe] space. Section 3 gives our conclusions.
2. The Abundance Distribution of the EMP Stars in the [Sr/Ba] vs. [Ba/Fe] Space
The elemental abundances of the very metal-poor stars can provide crucial clues in exploring the r-process nucleosynthesis in the early universe. Element Eu is believed to be the r-process element since Eu is dominantly produced by the r-process. On the other hand, Ba is believed to mainly originate from the s-process of the low and intermediate mass AGB stars in the solar system (Arlandini et al. 1999). However, for the lowest metallicities, Ba dominantly comes from the main r-process, since the long time-scale for the evolution of the AGB stars (Truran et al. 2002). Because the abundances of Ba have been measured for almost all stars with lower metallicity, as in many previous studies (Honda et al. 2004; Roederer 2013), we take Ba (instead of Eu) as the representative element of the main r-process. In this section, we will explore the abundance relation between the elements Sr and Ba. The observational and theoretical results of the previous studies (Honda et al. 2004; Franc¸ois et al. 2007; Andrievsky et al. 2011; Siqueira Mello et al. 2014; Spite & Spite 2014; Roederer 2017; Spite et al. 2018) imply that the [Sr/Ba] scatter should not be ascribed to one nucleosynthetic process. The distribution of [Sr/Ba] for the metal-poor stars could present important clues about the pollution of r-process material in the early Galaxy. So the quantitative study of the distribution of [Sr/Ba] for the more metal-poor stars is necessary.
Figure 1 shows the abundance ratios [Sr/Fe] of EMP stars as a function of [Fe/H]. The weak rprocess stars HD 122563 (Honda et al. 2007) and CS 22897–008 (Spite et al. 2018) are indicated as black triangles. The abundance ratios of four main r-process stars CS 31082–001, CS 22892–052, CS 29497–004, and SDSS J2357–0052 are adopted from Hill et al. (2002, 2017); Sneden et al. (2003); Aoki et al. (2010) and plotted as blue down triangles. For the other EMP stars, the abundances are taken from Westin et al. (2000); Cowan et al. (2002); Depagne et al. (2002); Johnson & Bolte (2002); Honda et al. (2004); Barklem et al. (2005); Franc¸ois et al. (2007); Lai et al. (2008); Mashonkina et al. (2010); Roederer et al. (2010); Hollek et al. (2011); Cohen et al. (2013); Roederer et al. (2014); Mashonkina et al. (2014); Siqueira Mello et al. (2014); Li et al. (2015b,a); Jacobson et al. (2015); Hansen et al. (2015); Aoki et al. (2017); Cain et al. (2018); Spite et al. (2018); Mardini et al. (2019). Note that, the carbon-enhance metal-poor (CEMP) stars with s-process enhancement (e.g. [Ba/Fe] > 1,[Ba/Eu]> 0) are excluded from the collected observational data because we focus on the r-process nucleosynthesis. From the figure we can see that, for the EMP stars with [Sr/Fe]>−0.3 (gray symbols), the [Sr/Fe] ratios are higher than that of HD 122563 and lower than those of the main r-process stars, which means that their Sr abundances should be explained by the mixture of the main r-process and the weak r-process material. On the other hand, the low-Sr stars ([Sr/Fe]≲−0.3) are indicated as the red squares. Because the [Sr/Fe] ratios of the low-Sr stars are lower than those of the weak r-process stars, an additional Fe inventory is needed for explaining the low [Sr/Fe] ratios. Figure 2 shows the [Ba/Fe] as a function of [Fe/H]. The symbols are the same as in Figure 1. We can see that, although most low-Sr stars are r-poor stars ([Ba/Fe]≤−0.5), the differences of Ba abundances of two groups are not distinct in the range −4.0≲[Fe/H]≲−2.5. However, the sample stars with [Fe/H]≲−4.0 or with [Ba/H]∼−5.5 (dotted line: [Ba/H]=−5.5) are the low-Sr stars.
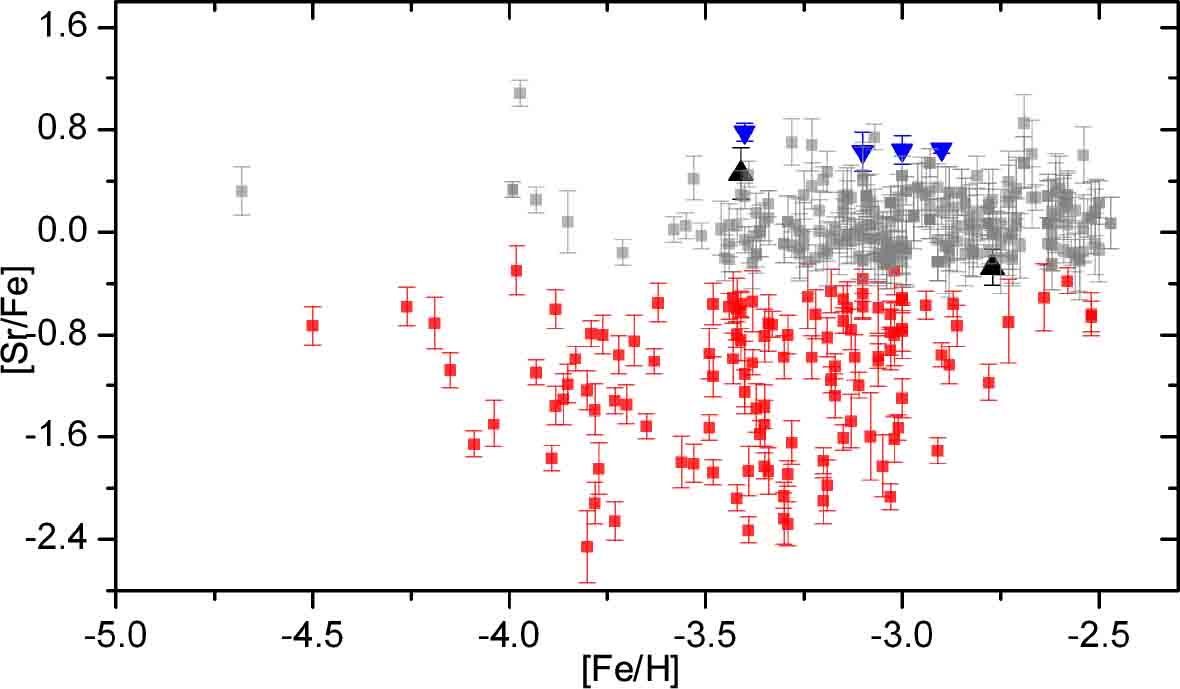
Fig. 1 Abundance ratios [Sr/Fe] of the metal-poor stars as a function of [Fe/H]. The triangles (black) and down triangles (blue) indicate the ratios of the weak r-process stars and the main r-process stars, respectively. The red squares indicate low-Sr stars and gray symbols represent other EMP stars.
Download figure:
Standard image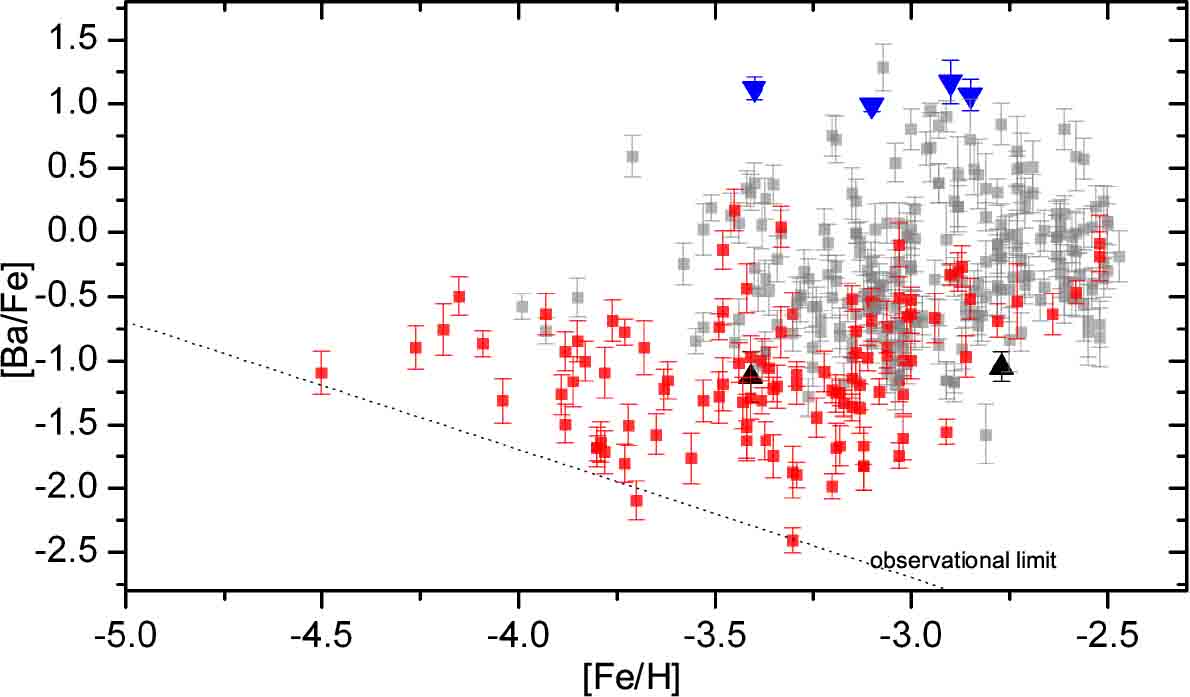
Fig. 2 Abundance ratios [Ba/Fe] of the metal-poor stars as a function of [Fe/H]. The data and symbols are the same as in Fig. 1. The dotted line indicates the observed limit.
Download figure:
Standard imageBecause Ba is produced by the main r-process and Sr can be produced by both the main r-process and the weak r-process, in order to reveal the abundance characteristics of the EMP stars in detail, in Figure 3, we present the Because Ba is produced by the main r-process and Sr can be produced by both the main r-process and the weak r-process, in order to reveal the abundance characteristics of the EMP stars in detail, in Figure 3, we present the [Sr/Ba] ratios as a function of [Ba/Fe] ratios. The data are the same as in Figure 1. The black horizontal dashed lines represent the ratios of HD 122563 (lower) and CS 22897–008 (upper), and their averaged ratio is indicated as a black horizontal solid line. The blue horizontal solid line represents the minimum ratios of [Sr/Ba] for the main r-process stars, and the blue horizontal dashed lines represent the typical uncertainties. Spite et al. (2018) have reported that there is no clear correlation between the abundance of a first peak element Sr and the abundance of a second peak element Ba. They pointed out that there is a minimum of [Sr/Ba] corresponding to its value in the r-rich stars and characteristics of the main r-process, and an upper limit of [Sr/Ba] corresponding to the line of [Sr/Ba] = −[Ba/Fe] + 0.7. From the figure we can see that there are three boundaries for the distribution region of the EMP stars and the right boundary is near the line of [Sr/Ba] = −[Ba/Fe] + 0.7. The higher ratios of the weak r-process star CS 22897–008 are [Ba/Fe]∼ − 1.0 ± 0.2 and [Sr/Ba] ∼ 1.59 ± 0.28 which are close to the upper vertex of the triangle. On the other hand, the main r-process stars lie on the right end of the lower boundary and the low-Sr star CS 30325–094 (red empty star) is close to the left end of the lower boundary of the region. For a given [Sr/Fe] ratio, the relation of [Sr/Ba] and [Ba/Fe] can be presented by a straight line with the slope of −1. In the figure, each of these lines is characterized by a value of [Sr/Fe].
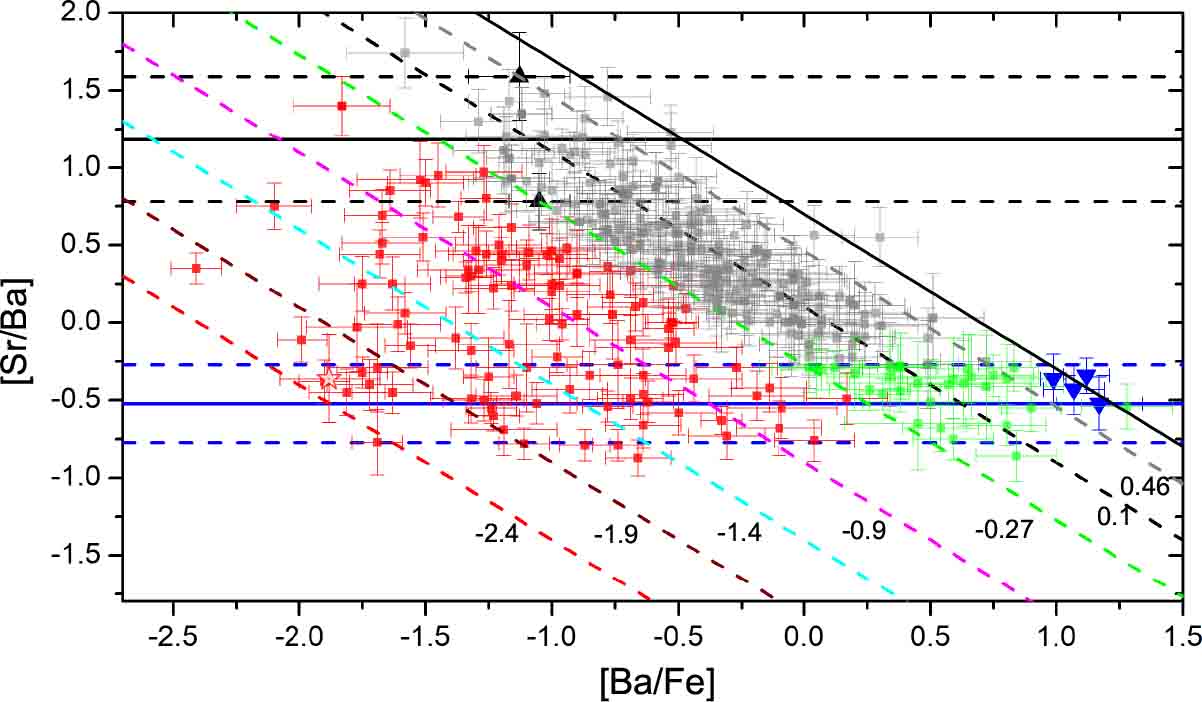
Fig. 3 The straight lines with various [Sr/Fe] ratios and Fe-normal belt in [Sr/Ba] vs. [Ba/Fe] space. The black horizontal dashed lines represent the ratios of HD 122563 (lower) and CS 22897-008 (upper), and their averaged ratio is indicated as a black horizontal solid line. The blue horizontal solid line represents the minimum ratios of [Sr/Ba] for the main r-process stars, and the blue horizontal dashed lines represent the typical uncertainties. The straight dashed lines with the slope of −1 characterized by various values of [Sr/Fe] represent various relations of [Sr/Ba] and [Ba/Fe]. The red empty star represents CS 30325-094. The solid line with the slope of −1 is the relation of [Sr/Ba] = −[Ba/Fe] + 0.7 from Spite et al. (2018).
Download figure:
Standard imageTaking the averaged abundance ratio ([Sr/Fe] = 0.1) of the weak r-process stars HD 122563 and CS 22897–008, in the figure, the weak r-process ratio is indicated by the inclined solid line with [Sr/Ba]> −0.27 which is the upper limit of the main r-process ratio. After considering the upper ratio ([Sr/Fe] = 0.46) and the lower ratio ([Sr/Fe] = −0.27), the weak r-process ratio can be indicated by a belt (gray squares). We can see that the right boundary of the region is close to the line through CS 22897–008, which means that the formation of the right boundary is mainly due to the weak r-process ratio. For the weak r-process stars HD 122563 and CS 22897–008, the averaged ratio [Sr/Fe] ∼ 0.1 means that the production of the weak r-process elements is coupled with that of Fe and the weak r-process event should occur in Fe core-collapse SNe with the progenitors of ∼ 11 − 25M⊙, since Fe is produced in the massive stars of ∼ 11 − 25M⊙ (Woosley & Weaver 1995; Qian & Wasserburg 2007). On the other hand, the [Sr/Ba] ratios of the stars indicted by the green squares are close to those of the main r-process stars, although their [Sr/Fe] ratios lie in the range of the weak r-process stars. Because the [Sr/Fe] ratios in the belt are close to the weak r-process ratio, the astrophysical origin of elements Sr and Fe of the EMP stars should be similar to those of the weak r-process stars. So the belt could be named as the Fe-normal belt and the stars in the belt could be named as Fe-normal stars. From the figure we can also see that the low-Sr stars (red symbols) distribute in the region of the lower left of the Fe-normal belt, which means that an additional Fe inventory is needed for explaining the phenomenon of the low-Sr stars. The belt and the low- Sr stars were not mentioned in Spite et al. (2018) for the reason of the small number of samples. Note that, based on the abundance analysis of four stars in ultra-faint dwarf galaxies (UFDs), Ji et al. (2019) discussed the most viable candidates for the sources of low Sr and Ba abundances at low metallicity and reported that the variations of [Sr/Ba] in UFDs cannot be explained by just a single r-process, and the astrophysical origin of low Sr and Ba abundances is still an open question.
Qian & Wasserburg (2001) have suggested that, in the early Galaxy, there should exist another nucleosynthetic component, i.e., p-inventory, originated from the first very massive stars. It is interesting to explore the effect of the p-inventory on the abundances of the low-Sr stars. In this case, for elements Fe, there are two possible astrophysical origins: normal Fe and prompt Fe. Taking the abundance ratio of the weak r-process as Fe-normal dominant ratio ([Sr/Fe] ∼ 0.1), in the figure, each of the straight dashed lines with a slope of −1 is also characterized by the contributed fractions of the p-inventory for the element Fe (green line: Fe-normal dominant, magenta line: 83.2%, cyan line: 95.0%, wine line: 98.7%, red line: 99.7%). We can see that, for a given [Sr/Ba] ratio, the [Ba/Fe] ratios decrease with increasing the contributed fraction of the p-inventory. For star CS 30325-094 which is indicated by the empty star, element Fe originates dominantly from the p-inventory.
Note that the right boundary of the distribution region decreases with increasing [Ba/Fe]. The weak r-process stars and the main r-process stars lie on the left end and the right end of the boundary, respectively. Obviously, the boundary could provide useful clue about the chemical enrichment of the gas clouds in which the stars formed. For a gas cloud polluted by the r-process material, the mass abundance of the ith element could be expressed as:
where f is the mass fraction of the r-process material. Mini and Mr are the initial mass of the cloud and the mass of the r-process material, respectively. Xi, ini and Xi,r are the initial mass abundance and the r-process abundance of the ith element, respectively. In order to explore the astrophysical reason of the right boundary formation, the initial abundance Xi, ini is taken from the abundances of the weak r-process star HD 122563 (Honda et al. 2007), CS 22897–008 (Spite et al. 2018) and the averaged abundance of them, respectively. The r-process abundance Xi,r (i.e., Xi,r = Xi,r,m ) is taken from the abundance of the main r-process star CS 31082-001 (Hill et al. 2002). Figure 4 shows the calculated results. The curves with arrows represent the pollution track when increasing the main r-process material. We can see that the track calculated from Equation (1) is consistent with the right boundary of the distribution region of the EMP stars within the uncertainties. The calculated result means that the formation of the right boundary is related to the pollution of the main r-process material.

Fig. 4 The pollution track of the main r-process material in a gas cloud with initial weak r-process abundances. The symbols are indicated as in Fig. 1. The curves (dashed line is from CS 22897–008, short dashed line is from HD 122563, and the solid line is from the averaged abundance of them) indicate the polluted results by the main r-process material.
Download figure:
Standard imageBecause the p-inventory only produces Fe and light elements and barely produces n-capture elements, the gas cloud in which the low-Sr stars formed had been polluted by the r-process material. Based on the [Sr/Fe] ratio of the straight line with a slope of −1 and the [Sr/Ba] ratio of HD 122563, the initial abundances of Sr and Ba of the gas cloud in which the low-Sr star formed can be derived. In this case, the abundances of the gas cloud polluted by the main r-process material can be calculated from Equation (1). In Figure 5, the curved lines indicate calculated pollution tracks with various initial [Sr/Fe] ratios (black line: [Sr/Fe]=0.1, magenta line: [Sr/Fe]=-0.9, cyan line: [Sr/Fe]=−0.9, cyan line: [Sr/Fe] = −1.4, wine line: [Sr/Fe] = −1.9, red line: [Sr/Fe] = −2.4). We can see that the distribution region of the low-Sr stars can be explained by the pollution of the main r-process material after considering the effect of the p-inventory. Furthermore, the horizontal line of the main r-process ratio is the asymptotic line of pollution tracks with various [Sr/Fe] ratios.

Fig. 5 Pollution from the main r-process material in [Sr/Ba] vs. [Ba/Fe] space. The curved lines indicate calculated pollution tracks with various [Sr/Fe] ratios (black line: [Sr/Fe] = 0.1, magenta line: [Sr/Fe] = −0.9, cyan line: [Sr/Fe] = −1.4, wine line: [Sr/Fe] = −1.9, red line: [Sr/Fe] = −2.4).
Download figure:
Standard imageBased on the abundance analysis of the EMP stars, Spite et al. (2018) have reported that the scatter of [Sr/Ba] strongly increases when [Ba/Fe] decreases. On the other hand, below [Ba/Fe] ≲ −1.0, the scatter of [Sr/Ba] does not continue to increase. These characteristics of the abundance distribution can also be seen from Figure 6. It is interesting to note that the observed left boundary is explicit: it is close to a straight line with [Ba/Fe] ⋍ −2.0 for [Sr/Ba] ≲ 0, while [Sr/Ba] ratio increase with increasing [Ba/Fe] ratio for [Sr/Ba]> 0. From the figure we can see that, for the left boundary, the lower end is close to the main r-process line (blue horizontal line) and the upper end is close to the abundances of the weak r-process stars. Taking the abundances of the lower end as the initial abundances, the abundances of the gas cloud polluted by the weak r-process material (i.e., Xi,r = Xi,r,w ) can also be calculated from Equation (1). In Figure 6, the wine short dashed curve indicates the pollution track of the weak r-process material. We can see that the left boundary of the EMP stars can be explained by the pollution of the weak r-process material. In another word, the formation of the left boundary is due to the pollution of the weak r-process material.
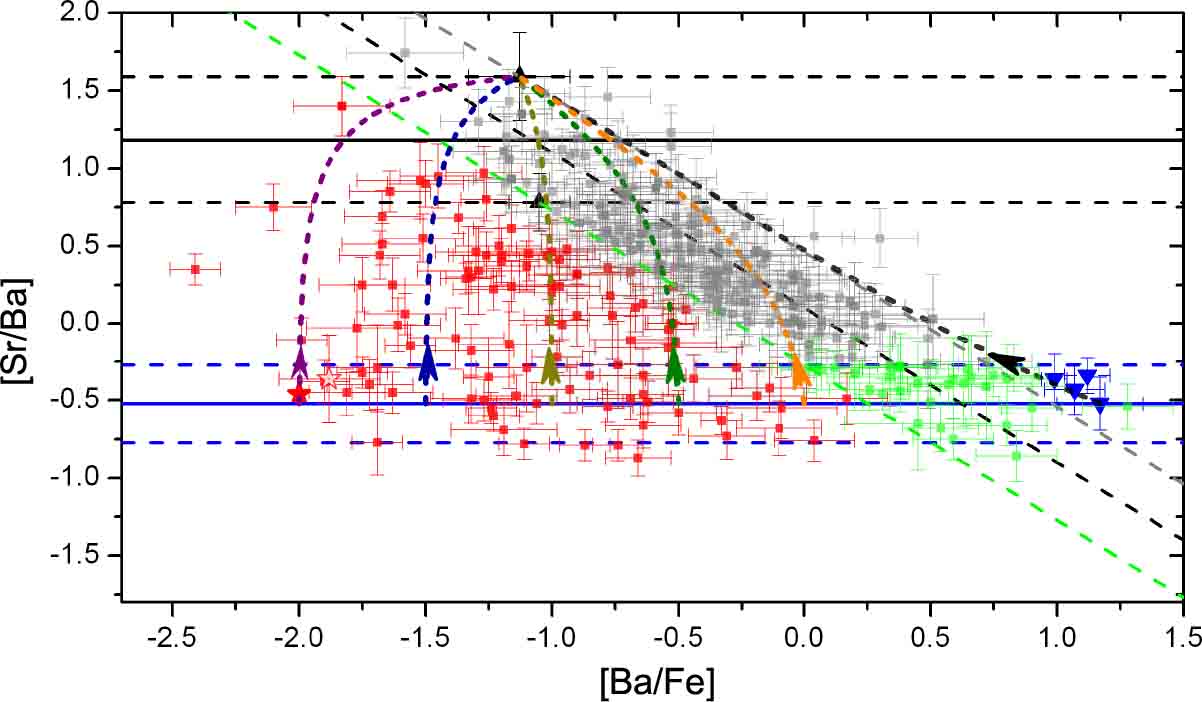
Fig. 6 The pollution of the weak r-process material in [Sr/Ba] vs. [Ba/Fe] space. The short dashed curves indicate calculated pollution tracks with various initial [Ba/Fe] ratios (wine for −2.0, royal blue for −1.5, dark yellow for −1.0, olive for −0.5, orange for 0, and black for 1.17). The violet horizontal line with arrow indicates the pollution track of the main r-process material.
Download figure:
Standard imageSpite et al. (2018) suggested that the distribution of [Sr/Ba] of the EMP stars should be explained by two independent steps: the first enrichment by the main r-process material and the second enrichment mainly by the weak r-process material. Taking the [Sr/Ba] ratio of the main r-process and various [Ba/Fe] ratios as the initial abundances, the abundances of the gas cloud polluted by the weak r-process material can also be calculated from Equation (1). In Figure 6, the short dashed curves indicate calculated pollution tracks with various initial [Ba/Fe] ratios (wine line: [Ba/Fe] = −2.0, royal blue line: [Ba/Fe]=−1.5, dark yellow line: [Ba/Fe] = −1.0, olive line: [Ba/Fe]=−0.5, orange line: [Ba/Fe] = 0, black line: [Ba/Fe] = 1.17). We can see that the distribution region of the EMP stars can be explained by the pollution of the weak r-process material, which is in agreement with the suggestion of Spite et al. (2018). Note that the pollution track with the highest initial [Ba/Fe] being close to the Fenormal belt reach the position of the weak r-process star CS 22897–008, which means that, although the [Sr/Ba] ratios are related to the relative importance of the weak r-process material (Spite et al. 2018), the spread trend of [Sr/Ba] ratios for [Ba/Fe] ≳ −1.0 is mainly constrained by the abundance ratio of the weak r-process. From the figure we can see that, although the pollution tracks converge at the position of the weak r-process star CS 22897–008, the pollution track with the highest initial [Ba/Fe] shows a flat trend (black short dashed line). The pollution tracks with lower initial [Ba/Fe] ratios are steeper for [Sr/Ba] ≲ 0, since the effect of pollution by the weak r-process material is higher for the gas cloud with lower initial [Ba/Fe] ratios.
In order to explain the position of left vertex of the region, we explore the abundance characteristics of the natal cloud polluted by the r-process material. Taking Xi, ini = 0 for n-capture elements, the abundances of the gas cloud polluted by the weak r-process and main r-process material can also be calculated. In Equation (1), adopting f=0.0007 and Xi,r = Xi,r,w + Xi,r,m , we can derive [Ba/Fe]=−2.0 and [Sr/Ba]=−0.46. In Figure 6, the calculated abundances are plotted by a filled star which is close to the left vertex of the distribution region of the EMP stars. The result means that, for the natal cloud polluted by the r-process, the effect of the main r-process is higher than that of the weak r-process, which should be the astrophysical reason that the abundance ratio of the left vertex of the region is close to the ratio of the main r-process.
Based on a chemical evolution model which is dependent on the nuclear equation of state (EOS), Famiano et al. (2016) studied the light r-process element enrichment and the scatter of [Sr/Ba] ratio in the metalpoor stars. In Figure 7, for comparison, we present their GCE results for various assumptions. For simplicity, we only show the special pollution lines at the boundaries and the line of [Sr/Ba]= = C[Ba/Fe] + 0.7. From the figure, we can see that the lines of the GCE model are near the Fe-normal belt when [Ba/Fe] < −0.5, then concentrate and become horizontal when [Ba/Fe]>0. This means that our results are consistent with the GCE results. The line of [Sr/Ba] = C[Ba/Fe] + 0.7 is near the right boundary, which means the astrophysical reason of the formation for the line (or right boundary) is due to the pollution of combination of the weak r- and main r-process material. The extremely metal-poor fast rotation massive star (FRMS) may be a possible site for the first peak elements (Chiappini et al. 2011; Frischknecht et al. 2016; Prantzos et al. 2018). Using the weak s-process production of FRMS, Cescutti et al. (2013) explained the spread of [Sr/Ba] in the EMP stars. However, they reported that the FRMS does not produce Eu. Figure 8 shows [Ba/Eu] vs. [Ba/Fe] for the EMP stars. From the figure we can see that, for the sample stars, the [Ba/Eu] ratios are lower than zero and their averaged ratio is near the solar main r-process ratio (Li et al. 2013). This implies that Ba and other neutron-capture elements in the sample stars should mainly come from the r-process (e.g., Montes et al. 2007; Famiano et al. 2016).
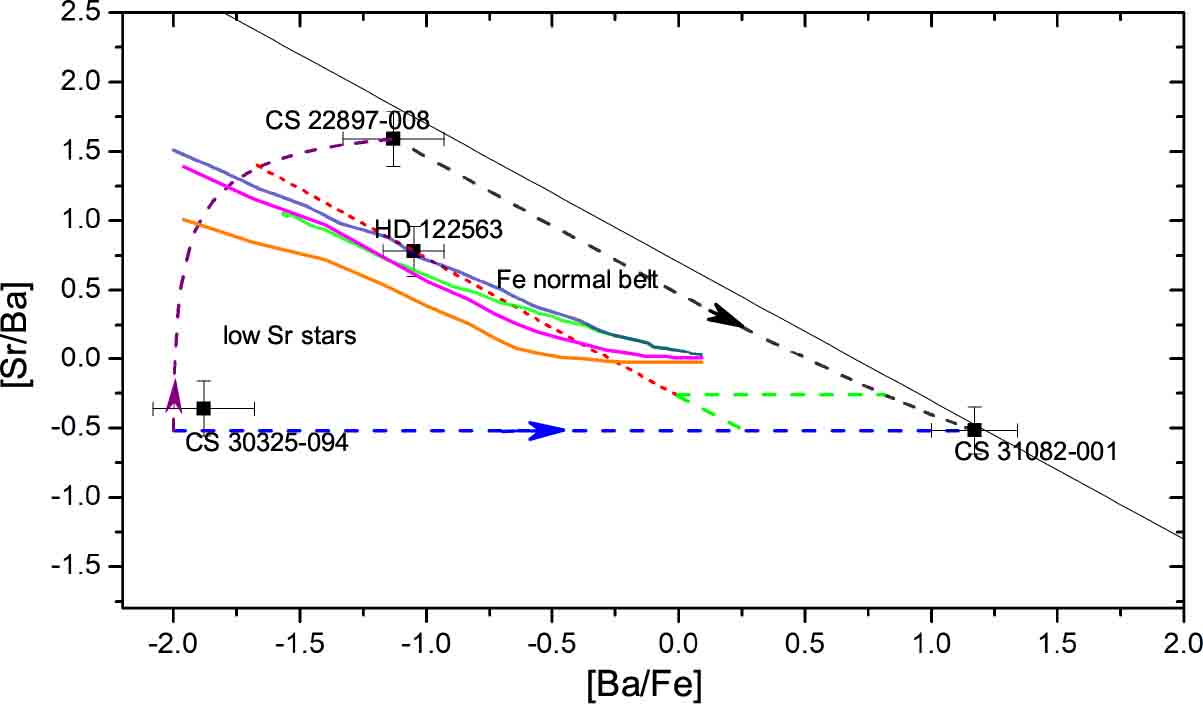
Fig. 7 Formation of the abundance boundary in [Sr/Ba] vs. [Ba/Fe] space for the early Galaxy. The blue dashed line represents the lower boundary which is due to the pollution of the main r-process material. The wine dashed curve represents the left boundary. The black dashed curve is right boundary which is the mixture of the weak r- and the main r-processes. The red short dashed line is the boundary of the Fe-normal belt (or Fe-normal stars) and the low Sr stars. The solid curves represent results of the chemical evolution model by Famiano et al. (2016) which is dependent on various equation of state (EOS)(O'Connor & Ott 2011) about the scatter of [Sr/Ba] in metal-poor stars (Orange is for LS180, magenta is for LS220, green is for LS375 and royal is for Shen). The solid line with the slope of −1 is the relation of [Sr/Ba] = −[Ba/Fe] + 0.7.
Download figure:
Standard image
Fig. 8 [Ba/Eu] vs. [Ba/Fe] in the early Galaxy. The horizontal solid line is the averaged value of the [Ba/Eu] ratios for the sample stars. The horizontal dashed line represents the r-process ratio of the solar system (Li et al. 2013).
Download figure:
Standard image3. Discussions and Conclusions
In early Galaxy, nearly all the n-capture nucleosynthesis and chemical enrichment information are contained in the abundances of the EMP stars with various r-enhancement levels. In order to understand the chemical enrichment history of the n-capture elements in the early Galaxy, we study the abundance relations between the first peak element Sr and the second peak element Ba in the [Sr/Ba] vs. [Ba/Fe] space for the EMP stars. The results are summarized as follows:
- Distribution region and three verticesThere are three boundaries and three vertices for the distribution region of the EMP stars. The lower boundary of the region is close to the main r-process ratio. The weak r-process star CS 22897–008 lies on the upper vertex and the main r-process stars lie on the right end of the lower boundary. There are three distinct abundance characteristics for the weak r-process stars, i.e., [Sr/Fe]∼0.1, [Sr/Ba]∼1.2, and [Ba/Fe]∼−1.0. For a gas cloud polluted by a weak r-process event, the observed ratios of [Sr/Fe]∼0.1 for the weak r-process stars means that the weak r-process elements are ejected from an SN II coupled with element Fe (i.e., normal Fe) and the ratio of the yield of weak r-process element to the yield of normal Fe is about a constant. In this case, element Fe in the gas cloud dominantly originates from the normal massive stars and the abundances of the main r-process elements are reduced because of the dilution by the weak r-process material. The pollution of weak r-process material directly leads to the higher weak r-process ratios ([Sr/Ba]∼1.6) and the lower main r-process ratios ([Ba/Fe]∼−1.0, [Eu/Fe]∼−0.5). There are two distinct abundance characteristics for the main r-process stars, i.e., [Ba/Fe] ≳ 1.0 and [Sr/Ba]∼−0.5. [Ba/Fe] ≳ 1.0 means that the production of main r-process elements does not couple with the iron group elements, which implies that the sites of the main r-process and the weak r-process are different. The two abundance characteristics lead to the main r-process stars lie on the right side of right vertex of the region.Because the abundances of CS 30325-094 (François et al. 2007) are close to the left vertex of the region, we take the abundances of the star as a representative. There are three abundance characteristics, i.e., [Sr/Fe]∼−2.4, [Ba/Fe]∼−2.0, and [Sr/Ba]∼−0.5. For the star, [Sr/H]∼−5.5 and [Ba/H]∼−5.5 which are close to the observational limits. [Sr/Fe]∼−2.4 means that element Fe in this star dominantly originates from p-inventory, since the ratio of [Sr/Fe] is lower than that of the Fe-normal stars about 2.4 dex. [Sr/Ba]∼−0.5 means that the natal cloud had been polluted by the main r-process material, which is in agreement with the suggestion by Spite et al. (2018). Because of the abundance characteristics of low-Sr and low-Ba, the abundances of CS 30325-094 can be treated as the start point of the pollution tracks of the main r-process material and the weak r-process material. The position of the left vertex can be explained by that, for the natal cloud polluted by the r-process, the effect of the main r-process is higher than that of the weak r-process.
- Fe-normal beltFrom the distribution of the EMP stars, we find that there are barely any sample stars lying on the weak r-process ratio ([Sr/Ba]∼1.6), which implies that, for a gas cloud polluted by a weak r-process event, the weak r-process elements are ejected from an SN II coupled with element Fe (i.e., normal Fe) and the ratio of the yield of weak r-process element to the yield of normal Fe is about a constant. In another word, element Fe in the weak r-process stars dominantly originates from the normal massive stars. Although [Sr/Ba]∼1.2 is a characteristic of the weak r-process, [Sr/Fe]∼0.1 has constrained the position of the weak r-process stars, which is the astrophysical reason that the weak r-process stars lie on top vertex of the region. There is a belt which is close to the weak r-process ratio, i.e., [Sr/Fe] = 0.1 ± 0.3. The sample stars in the belt could be named as Fe-normal stars, since the astrophysical origin of element Fe is similar to those of the weak r-process stars. The right boundary of the distribution region for the EMP stars is close to the right side of the belt for [Ba/Fe] ≲ 0.5.
- Low-Sr stars and p-inventoryThe low-Sr stars distribute in the region of the lower left of the Fe-normal belt and the additional Fe inventory is needed for explaining the phenomenon of the low-Sr stars. For the low-Sr stars, element Fe should originate partly from the p-inventory and the observed scatter of [Sr/Fe] is about 2.0 dex. For a given [Sr/Ba] ratio, the [Ba/Fe] ratios decrease with increasing the contributed fraction of the p-inventory.
- Three boundaries of the distribution region and pollution tracks of the r-process materialThe formation of the left boundary of the distribution region is due to the pollution of the weak r-process material and the formation of the lower boundary is due to the pollution of the main r-process material. It is interesting to note that the formation of the right boundary could be explained by the combination of the weak r- and main r-process material. In this case, the weak r-process star CS 22897–008 lie on the top end of the pollution track (e.g., the short dashed curve in Fig. 6), which implies that the main r-process elements, such as Ba and Eu, had already existed in the gas cloud which the weak r-process star formed. This is consistent with the suggestion that the enrichment of the heavy elements should undergo two independent steps: a first main r-process event and a second weak r-process event.
- Scatter trend of [Sr/Ba] ratios and the abundance ratios of the r-processThe right boundary could be treated as the track when increasing the pollution of the weak r-process material in the extremely enriched main r-process material. For [Ba/Fe] ≳ 0.5, the flat trend of the pollution track is in agreement with the predictions of the highest initial [Ba/Fe] by Spite et al. (2018). In this case, the scatter of [Sr/Ba] ratios increases with decreasing [Ba/Fe] weakly. On the other hand, for [Ba/Fe] < 0.5, the pollution track is close to the upper limit of the Fenormal belt. Consequently, the scatter of [Sr/Ba] ratios increases with decreasing [Ba/Fe] strongly. Spite et al. (2018) found that the scatter of [Sr/Ba] strongly increases when [Ba/Fe] decreases and suggested that the scatter depends on the relative importance of the weak r-process material. Our calculation implies that, although the [Sr/Ba] ratios are related to the relative importance of the weak r-process material, the scatter of [Sr/Ba] ratios mainly depends on the abundance ratio of the weak r-process.
In the past several decades, many researchers have performed investigations about the abundance characteristics and astrophysical sites of the r-process. The results of this work could present more information for understanding the abundance distributions of the n-capture elements in the EMP stars. Obviously, more detailed studies of the elemental abundances of the r-process enhanced stars are required.
Acknowledgements
We thank the referee for the helpful and constructive suggestions, which improved this paper greatly. This work has been supported by the National Natural Science Foundation of China under grants 11673007, 11547041, 11643007, and 11773009, the Natural Science Foundation of Hebei Province under grants A2018106014 and A2019208194.