
Abstract
The detection of error-related potentials (ErrPs) in tasks with discrete feedback is well established in the brain–computer interface (BCI) field. However, the decoding of ErrPs in tasks with continuous feedback is still in its early stages. Objective. We developed a task in which subjects have continuous control of a cursor's position by means of a joystick. The cursor's position was shown to the participants in two different modalities of continuous feedback: normal and jittered. The jittered feedback was created to mimic the instability that could exist if participants controlled the trajectory directly with brain signals. Approach. This paper studies the electroencephalographic (EEG)—measurable signatures caused by a loss of control over the cursor's trajectory, causing a target miss. Main results. In both feedback modalities, time-locked potentials revealed the typical frontal-central components of error-related potentials. Errors occurring during the jittered feedback (masked errors) were delayed in comparison to errors occurring during normal feedback (unmasked errors). Masked errors displayed lower peak amplitudes than unmasked errors. Time-locked classification analysis allowed a good distinction between correct and error classes (average Cohen- , average TPR = 81.8% and average TNR = 96.4%). Time-locked classification analysis between masked error and unmasked error classes revealed results at chance level (average Cohen-
 , average TPR = 60.9% and average TNR = 58.3%). Afterwards, we performed asynchronous detection of ErrPs, combining both masked and unmasked trials. The asynchronous detection of ErrPs in a simulated online scenario resulted in an average TNR of 84.0% and in an average TPR of 64.9%. Significance. The time-locked classification results suggest that the masked and unmasked errors were indistinguishable in terms of classification. The asynchronous classification results suggest that the feedback modality did not hinder the asynchronous detection of ErrPs.
Export citation and abstract BibTeX RIS

Original content from this work may be used under the terms of the Creative Commons Attribution 3.0 licence. Any further distribution of this work must maintain attribution to the author(s) and the title of the work, journal citation and DOI.
1. Introduction
Brain–computer interfaces (BCIs) convert mentally modulated brain activity into actions of an external device, constituting a resource that offers more independence to people with severe motor disabilities [1, 2].
In the context of BCIs, the brain activity is often measured non-invasively at the scalp level, using electroencephalography (EEG). The conversion of EEG signals into a device's actions is not flawless and hence BCIs sometimes misinterpret their users' intentions. These misinterpretations prompt increased frustration and lack of motivation among BCI users [3]. Therefore, BCIs can benefit from the incorporation of an error detection system in order to provide a smoother and robust interaction between user and external device. Such system can be used either to correct an action perceived as erroneous by the user (corrective approach) or to decrease the chance of future misclassifications (by adapting the classifier responsible for the action generation–adaptive approach) [4].
The development of an error detection system is possible because the recognition of an error elicits a neuronal response, which can be measured using EEG and is associated with a coarse differentiation between favorable and unfavorable outcomes [5]. The electrophysiological signature of error detection is named error-related potential (ErrP). Different types of ErrPs have been described in literature [4]. Response ErrPs occur in speeded response time tasks in which subjects are asked to respond as quickly as possible to a stimulus [6–9]. Observation ErrPs occur when subjects observe an error being committed by an external agent [10–12]. Feedback ErrPs occur when subjects receive the information that the action they performed was not correct [13]. Finally, interaction ErrPs occur in the context of BCIs, when users believe that the command they issued was misinterpreted by the interface [14, 15].
The inclusion of error detection systems in BCIs that control devices whose actions occur in a discrete way (discrete BCIs) is well established, both in the corrective and adaptive approaches [16–21]. However, BCIs controlling devices whose actions occur in a continuous manner (continuous BCIs) offer a more intuitive interaction with their users and have already been developed [22–24].
The study of error detection during continuous actions requires an asynchronous detection of errors and it is still in the early stages. Kreilinger et al studied interaction errors in a BCI that combined continuous and discrete feedback [22, 25]. Iturrate et al showed that errors can be detected during the observation of a continuous task [26], and Omedes et al detected them in an asynchronous manner [27]. Omedes et al also studied sudden and gradually unfolding errors in an observation task [28]. Milekovic et al showed that interaction errors can be detected during a task with continuous control and feedback using electrocorticographic recordings [29] and Spüler et al showed that it was also possible to do it using EEG [30].
One potential breakthrough of continuous BCIs would be to provide the users with full trajectory control of a cursor or a robotic arm. Nevertheless, existing studies on trajectory decoding from brain signals showed some instability in the decoded trajectory [31, 32]. We aim to investigate the effect of feedback's instability in error-related potentials during a task with continuous control and feedback. For that, we developed a task in which participants used a joystick to continuously control a cursor towards a target. The continuous feedback of the cursor position was either normal or jittered. The jittered feedback intended to mask the cursor's position. In some of the trials (error trials), the participants lost the control of the cursor during the trial, therefore not reaching the target (giving rise to masked and unmasked errors). We created this protocol with three main goals in mind. First, we want to investigate if the jittered feedback would affect the electrophysiological signature of the error signals. Second, we intend to perform time-locked classification of correct trials against error trials, and of masked errors against unmasked errors. Finally, we aim to detect error-related potentials in an asynchronous manner.
2. Materials and methods
2.1. Hardware and data acquisition
EEG data were recorded at a sampling rate of 1000 Hz using BrainAmp amplifiers and an actiCap system (Brain Products, Munich, Germany) with 61 active electrodes and three EOG electrodes. The amplifiers used have a 0.016 Hz hardware high-pass filter of first-order. The EEG electrodes were placed at positions Fp1, Fp2, AF3, AF4, F7, F5, F3, F1, Fz, F2, F4, F6, F8, FT7, FC5, FC3, FC1, FCz, FC2, FC4, FC6, FT8, T7, C5, C3, C1, Cz, C2, C4, C6, T8, TP9, TP7, CP5, CP3, CP1, CPz, CP2, CP4, CP6, TP8, TP10, P7, P5, P3, P1, Pz, P2, P4, P6, P8, PO9, PO7, PO3, POz, PO4, PO8, PO10, O1, Oz, and O2. The ground electrode was placed at position AFz and the reference electrode was placed on the right mastoid. The EOG electrodes were placed above the nasion and below the outer canthi of the eyes.
2.2. Participants and experimental environment
Fifteen volunteers (aged between 19 and 27 years old, nine male) participated in the experiment, which took place in a shielded room. The participants sat in a comfortable armchair, in front of a screen that displayed the experimental protocol. The refresh sampling rate of the screen was 60 Hz. The right armrest of the chair was removed and in its location was placed a table with a joystick on it. The joystick position was adjusted for each participant in order to allow its comfortable manipulation by the participants, whilst keeping their elbow on the table. After the experimental protocol was explained to the participants, they signed an informed consent form that had been previously approved by the local ethics committee.
2.3. Experiment overview
The experiment consisted of 12 blocks of 30 trials each. The trial duration was variable, lasting on average  s (mean ± SD). Between each trial, there was a 2.5 s break. Between each block, the participants could rest for as long as they needed. Half of the blocks consisted of masked trials. 30% of trials of each block were error trials, leading to the same number of masked and unmasked error trials.
2.3.1. Trial and task description.
At the beginning of a trial, four equally spaced squares were displayed on the upper part of a computer screen, at the same distance from its centre. On the lower part of the screen there was a red circle that represented the cursor. The squares and the circle were displayed on a gray area, inside which the cursor could move (see figure 1, top left image). In each trial, one of the squares was randomly selected by the paradigm as the target and therefore colored yellow, whilst the others were blue. All squares had the same probability of being selected. The cursor was controlled by the participants through a joystick. The displacement of the joystick corresponded to the direction of the movement of the cursor, which moved at a constant velocity. The task consisted in moving the cursor from its initial position to the target. A trial ended when the cursor reached the target or when it hit the boundary of the gray region (see supplementary video, available at stacks.iop.org/JNE/15/036031). The participants were instructed to shift their gaze to the target at the beginning of each trial and to keep it fixed on the target during the entire trial, to minimize the eye movements during the cursor movement.
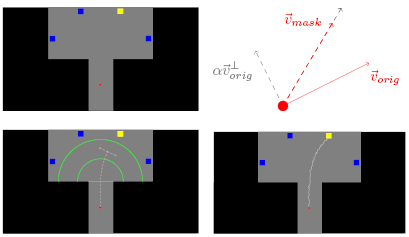
Figure 1. Top left: One of the four possible setups of the experimental protocol at the beginning of a trial. Top right: Schematic calculation of the cursor's velocity in the masked trials. The modified velocity vector is depicted with a dashed red arrow. Bottom left: Illustration of a possible cursor's trajectory and error onset in an unmasked error trial. All the green elements (semicircles and midline) were invisible to the participants. Bottom right: Illustration of a possible cursor's trajectory in a masked correct trial.
Download figure:
Standard image High-resolution image2.3.2. Masked trials.
In these trials, the cursor jittered perpendicularly to the direction of its movement. To achieve this effect, at each time-point was created a new velocity vector  , by combining the original velocity vector (
 ) and its orthogonal vector (
 ):
):  , with
 was then scaled to keep the velocity constant (see figure 1, top right and bottom right images). Masked trials can be either correct or error trials (as well as the unmasked ones).
2.3.3. Correct trials.
We considered as correct trials all the trials in which the participants successfully guided the cursor to the target (see figure 1, bottom right image). Participants completed on average  correct trials per block.
2.3.4. Error trials.
In these trials, the participants lost control over the cursor (error onset). The error onset occurred when the cursor was located within the green semicircles depicted in the bottom left image of figure 1 (at a uniformly random distance from the centre of the screen). At the error onset, the cursor moved perpendicularly to its last direction, until the trial ended. The side of the cursor's deviation was randomly assigned and each side had the same probability of being chosen. The participants were instructed to keep their gaze fixed on the target and to bring the joystick to its resting position when realizing that the control over the cursor was lost. The joystick automatically returns to the resting position when no pressure is applied.
2.4. Preprocessing
The EEG signal was resampled to 250 Hz and band-pass filtered between 1 and 10 Hz with a zero-phase Butterworth filter of order 4. To remove outlier channels, we calculated the variance of the amplitude of each channel during correct and error trials. The first and third quartiles (Q1 and Q3) of the channels' variance were used to calculate the IQR interval  . Channels whose variance lied outside
 ![$[Q1 -3 \times IQR, Q3 +3 \times IQR]$](https://content.cld.iop.org/journals/1741-2552/15/3/036031/revision2/jneaab806ieqn012.gif) were excluded, due to being considered extreme outliers [33]. Artifactual trials were rejected by visual inspection of the EEG channels. Additionally, error trials contaminated with eye movements around the error onset were removed. For that, error trials were epoched in the interval
were excluded, due to being considered extreme outliers [33]. Artifactual trials were rejected by visual inspection of the EEG channels. Additionally, error trials contaminated with eye movements around the error onset were removed. For that, error trials were epoched in the interval ![$[-0.5, 1.0]$](https://content.cld.iop.org/journals/1741-2552/15/3/036031/revision2/jneaab806ieqn013.gif) s, time-locked to the error onset (t = 0 s) and the variance of the horizontal and vertical derivatives of the EOG channels during this period was calculated. Error trials whose variance would be higher than
s, time-locked to the error onset (t = 0 s) and the variance of the horizontal and vertical derivatives of the EOG channels during this period was calculated. Error trials whose variance would be higher than  were removed. The maximum number of removed channels per subject was 3 (
 (mean ± SD)). On average,
  % of the error trials and
  % of the correct trials were excluded (mean ± SD).
2.5. Electrophysiological analysis
After the preprocessing, correct and error trials were epoched, retaining a 1.5-s window interval per trial. In the correct trials, we chose the interval ![$[-0.5, 1.0]$](https://content.cld.iop.org/journals/1741-2552/15/3/036031/revision2/jneaab806ieqn018.gif) s, time-locked to the cursor crossing the horizontal midline of the screen (t = −0.5 s). The horizontal midline of the screen is depicted in the bottom left image of figure 1. In the error trials, we chose the interval
s, time-locked to the cursor crossing the horizontal midline of the screen (t = −0.5 s). The horizontal midline of the screen is depicted in the bottom left image of figure 1. In the error trials, we chose the interval ![$[-0.5, 1.0]$](https://content.cld.iop.org/journals/1741-2552/15/3/036031/revision2/jneaab806ieqn019.gif) s, time-locked to the error onset (t = 0 s).
s, time-locked to the error onset (t = 0 s).
2.6. Time-locked classification
After the preprocessing, the EEG signal was low-pass filtered and resampled to 50 Hz. For the time-locked classification of correct trials against error trials, we used a shrinkage-LDA classifier with two classes (correct and error), which was tested using a ten times five-fold cross-validation [34]. The features used to train the classifier for the correct class consisted of the amplitudes of all EEG channels during the correct trials (masked and unmasked) in the ![$[0.1, 0.5]$](https://content.cld.iop.org/journals/1741-2552/15/3/036031/revision2/jneaab806ieqn020.gif) s, time-locked to the cursor crossing the horizontal midline of the screen (t = −0.5 s). The features used to train the classifier for the error class consisted of the amplitudes of all the EEG channels during the error trials (masked and unmasked) in the interval
s, time-locked to the cursor crossing the horizontal midline of the screen (t = −0.5 s). The features used to train the classifier for the error class consisted of the amplitudes of all the EEG channels during the error trials (masked and unmasked) in the interval ![$[0.1, 0.5]$](https://content.cld.iop.org/journals/1741-2552/15/3/036031/revision2/jneaab806ieqn021.gif) s, time-locked to the error onset (t = 0 s).
s, time-locked to the error onset (t = 0 s).
We also performed a time-locked classification of masked error trials against unmasked error trials. In this case, we used the same classification procedure described above but now with two other classes: unmasked errors and masked errors. The features used to train the classifier were the same as the ones described for the error class, but taking into consideration the type of trial (masked or unmasked).
In order to assess the performance of the time-locked classification, we used the true positive rate (TPR), the true negative rate (TNR) and the Cohen-κ coefficient as performance measures [35]. The chance-level results were calculated at a subject level by using a classifier with randomly shuffled training labels. Additionally, we also calculated the 95% confidence interval for the performance measures of a theoretical chance-level classifier.
2.7. Asynchronous classification
After the preprocessing, the EEG signal was, again, low-pass filtered and resampled to 50 Hz. Correct and error trials were epoched from the time-point in which the cursor crossed the horizontal midline of the screen until the trial ended, avoiding the period of the trials in which eye movements could have happened. Epoched this way, the correct trials lasted on average  s and the error trials lasted on average
  s (mean ± SD).
We used a shrinkage-LDA classifier with two classes: correct and error. As features to train the classifier for the correct class, we considered the amplitudes of all EEG channels during the correct trials (both masked and unmasked), in the interval ![$[0.1, 0.5]$](https://content.cld.iop.org/journals/1741-2552/15/3/036031/revision2/jneaab806ieqn024.gif) s, time-locked to the cursor crossing the horizontal midline of the screen (t = −0.5 s). As features to train the classifier for the error class, we considered the amplitudes of all EEG channels during the error trials (both masked and unmasked), in the interval
s, time-locked to the cursor crossing the horizontal midline of the screen (t = −0.5 s). As features to train the classifier for the error class, we considered the amplitudes of all EEG channels during the error trials (both masked and unmasked), in the interval ![$[0.1, 0.5]$](https://content.cld.iop.org/journals/1741-2552/15/3/036031/revision2/jneaab806ieqn025.gif) s time-locked to the error onset (t = 0 s). The number of features was then reduced using principal component analysis (PCA), conserving the components that explained 99% of the signal's variance. These components were used as features to train the classifier in a time-locked manner. The classifier was then tested asynchronously, by sliding a 400 ms window over the trials, what resulted in a classifier's output every 20 ms.
s time-locked to the error onset (t = 0 s). The number of features was then reduced using principal component analysis (PCA), conserving the components that explained 99% of the signal's variance. These components were used as features to train the classifier in a time-locked manner. The classifier was then tested asynchronously, by sliding a 400 ms window over the trials, what resulted in a classifier's output every 20 ms.
For each fixed threshold (τ, such that ![$\tau \in [0, 1]$](https://content.cld.iop.org/journals/1741-2552/15/3/036031/revision2/jneaab806ieqn026.gif) with steps of 0.025) for the error class probability (pe), we considered an error event when
with steps of 0.025) for the error class probability (pe), we considered an error event when  in at least two consecutive windows. The evaluation metric that we used to assess the asynchronous classification defines a correct trial as successfully classified if no error event was detected during the entire trial duration (true negative trial). An error trial was considered to be successfully classified if no error event was detected before the error onset and at least one error event was detected after the error onset (true positive trial). The average duration between the error onset and the end of the trial was
  s (mean ± SD).
Two methods were used to evaluate the classifier asynchronously. The first method consisted in performing a ten times five-fold asynchronous cross-validation in the first 80% of the data (the first 80% of the correct trials and of the error trials). To assess the performance of the asynchronous cross-validation classification, we used TPR and TNR as performance measures. The chance level results were calculated at a subject level, by using a classifier with randomly shuffled training labels. The second method consisted in using a chronological split (80%–20%) of the data to perform asynchronous classification (the first 80% of the trials were used to train the classifier in a time-locked way and the last 20% of the trials were used to test it asynchronously). To assess the performance of the asynchronous classification on the chronological split, we used TPR and TNR as performance measures. The chance level results were calculated at a subject level, by averaging 50 repetitions of the classification done with randomly shuffled training labels.
The asynchronous cross-validation and the search of the optimal thresholds were performed only on the first 80% of the data. On the remaining 20% of the data, we evaluated the asynchronous classification using all thresholds. The results for optimal thresholds at group- and subject-level were compared. The TPR was chosen as the optimization measure to select the optimal thresholds because true positive trials contain two distinct periods (one in which no error happens and no error event is detected by the classifier, and another that starts with the error onset, and in which an error event is detected). This choice prevents the classifier from being too biased towards any of the classes.
3. Results
3.1. Electrophysiological results
3.1.1. Correct and error signals.
The grand average correct and error signals at channel FCz are displayed in figure 2 (in green and red color, respectively). Defining the error onset at t = 0 s, the grand average error signal presents a first negative peak at 196 ms, followed by a positive peak at 404 ms, and a later negative peak at 616 ms. The error-related potential (calculated as the difference between the average error signal and the average correct signal) is essentially similar to the average error signal because the average correct signal is nearly flat. For this reason, we chose not to include the error-related potential in the figure. The average correct and error signals of each subject are shown in dashed lines. The gray areas represent the time periods in which correct and error signals are significantly different (Wilcoxon signed-rank tests, Bonferroni corrected, with p < 0.05). Figure 2 also shows the scalp distributions of the grand average error signal at  ms,
ms,  ms and
  ms.
ms.

Figure 2. Grand average correct and error signals at channel FCz (in green and red, respectively). Both masked and unmasked trials were considered to obtain the presented the grand averages. The gray areas denote the intervals in which correct and error signals are significantly different (Wilcoxon signed-rank tests, Bonferroni corrected, with p < 0.05). The dashed lines represent the average error and correct signals of each participant. The scalp distributions of the grand average error signal are displayed at t = 196 ms, t = 404 ms and t = 616 ms.
Download figure:
Standard image High-resolution image3.1.2. Masked and unmasked error signals.
Figure 3 shows the grand average masked and unmasked error signals at channel FCz (in pink and dark red color, respectively) as well as the average signals of each subject (in dashed lines). The grand average unmasked error signal presents a first negative peak at 192 ms, followed by a positive peak at 388 ms and a later negative peak at 592 ms. The grand average masked error signal presents a first negative peak at 212 ms, followed by a positive peak at 420 ms and a later negative peak at 652 ms. The gray areas indicate the regions in which masked and unmasked error signals were significantly different (Wilcoxon signed-rank tests, Bonferroni corrected, with p < 0.05). Figure 3 shows also the scalp distributions of the grand average masked and unmasked error signals at t = 180 ms and t = 292 ms (in the region where the signals were significantly different). Unmasked errors displayed significantly larger (positive and negative) peak amplitudes than masked errors (Wilcoxon signed-rank tests, one-sided, p = 0.027 in both cases). Unmasked errors also displayed significantly earlier positive and negative peaks than masked errors (Wilcoxon signed-rank tests, one-sided, p = 0.0015 for the positive peak and p = 0.0065 for the negative peak). The time-shift that maximized the cross-correlation between the grand average masked and unmasked error signals was 28 ms.
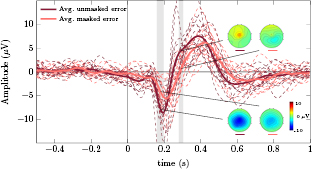
Figure 3. Grand average masked and unmasked error signals at channel FCz (in pink and dark red, respectively). The gray areas denote the intervals in which masked and unmasked error signals are significantly different (Wilcoxon signed-rank tests, Bonferroni corrected, with p < 0.05). The dashed lines represent the averaged masked and unmasked error signals of each participant. The scalp distributions of the grand average masked and unmasked error signals are displayed for t = 180 ms and t = 292 ms.
Download figure:
Standard image High-resolution image3.2. Time-locked classification
The results of the time-locked classification of error trials against correct trials are displayed in figure 4. On average,  (mean ± SD) of the correct trials were successfully classified (true negative rate (TNR)) and
  (mean ± SD) of the error trials were successfully classified (true positive rate (TPR)). The 95% confidence interval for the TNR of a theoretical chance level classifier was
 ![$[64.3, 75.7]$](https://content.cld.iop.org/journals/1741-2552/15/3/036031/revision2/jneaab806ieqn034.gif) and is depicted with dashed green lines. The 95% confidence interval for the TPR of theoretical a chance level classifier was
and is depicted with dashed green lines. The 95% confidence interval for the TPR of theoretical a chance level classifier was ![$[21.3, 38.7]$](https://content.cld.iop.org/journals/1741-2552/15/3/036031/revision2/jneaab806ieqn035.gif) and is depicted with dashed red lines. The average Cohen-κ coefficient was
and is depicted with dashed red lines. The average Cohen-κ coefficient was  (mean ± SD). The 95% confidence interval for the Cohen-κ coefficient of a chance level classifier was
 ![$[-0.158, 0.158]$](https://content.cld.iop.org/journals/1741-2552/15/3/036031/revision2/jneaab806ieqn037.gif) and is depicted with dashed lines. The chance level results of each participant, for all the measures, are represented with small circles.
and is depicted with dashed lines. The chance level results of each participant, for all the measures, are represented with small circles.

Figure 4. Time-locked classification of correct trials against error trials. The small circles indicate the chance level at a subject level. Top: Percentage (mean and standard deviation) of successfully classified correct and error trials (TNR (green bars) and TPR (red bars), respectively) for each subject and their average. The 95% confidence intervals for the TPR and TNR of a theoretical chance level classifier are displayed with red and green dashed lines, respectively. Bottom: Cohen-κ coefficient (mean and standard deviation) of each subject and their average. The 95% confidence interval for Cohen-κ coefficient of a theoretical chance level classifer is displayed with dashed lines.
Download figure:
Standard image High-resolution imageThe results of the time-locked classification of masked error trials against unmasked error trials are displayed in figure 5. On average,  (mean ± SD) of the masked error trials were successfully classified (true negative rate (TNR)) and
  (mean ± SD) of the unmasked error trials were successfully classified (true positive rate (TPR)). The 95% confidence interval for the TNR and TPR of a theoretical chance level classifier was
 ![$[36.7, 63.7]$](https://content.cld.iop.org/journals/1741-2552/15/3/036031/revision2/jneaab806ieqn040.gif) and is depicted with dashed lines. The average Cohen-κ coefficient was
and is depicted with dashed lines. The average Cohen-κ coefficient was  (mean ± SD). The 95% confidence interval for the Cohen-κ coefficient of a theoretical chance level classifier was
 ![$[-0.189, 0.189]$](https://content.cld.iop.org/journals/1741-2552/15/3/036031/revision2/jneaab806ieqn042.gif) and is depicted with dashed lines. The chance level results of each participant, for all the measures, are represented with small circles.
and is depicted with dashed lines. The chance level results of each participant, for all the measures, are represented with small circles.

Figure 5. Time-locked classification of masked errors against unmasked errors. The small circles indicate the chance level at a subject level. Top: Percentage (mean and standard deviation) of successfully classified masked and unmasked error trials (TNR (pink bars) and TPR (dark red bars), respectively) for each subject and their average. The 95% confidence interval for the TPR and TNR of a theoretical chance level classifier is displayed with dashed lines. Bottom: Cohen-κ coefficient (mean and standard deviation) of each subject and their average. The 95% confidence interval for the Cohen-κ coefficient of a theoretical chance level classifier is displayed with dashed lines.
Download figure:
Standard image High-resolution image3.3. Asynchronous classification
In order to detect errors in an asynchronous manner, we considered a classifier with two classes: correct and error. We decided to use both masked and unmasked trials to train these classes due to the chance level outcome of the time-locked classification of masked errors against unmasked errors. We used a ten times five-fold asynchronous cross-validation in the first 80% of the data. Figure 6 (top) shows the average percentage of correct and error trials successfully classified (TNR and TPR, left and right images, respectively) in function of the considered thresholds (τ), for each subject (dashed colored lines). Figure 6 (bottom) shows the average TNR and TPR (green and red lines, respectively) for each of the considered thresholds, and the 95% confidence interval for the averages (shaded areas). The average chance level of TNR and TPR are displayed in green and red dashed lines, respectively. The threshold that maximized the average TPR was  . Using this threshold, we obtained an average TPR of 68.0% and an average TNR of 76.0%. Figure 7 displays the average detection delay (period between the error onset and the detection of an error event by the classifier) in the masked and unmasked error trials successfully classified (TP trials) as well as the corresponding 95% confidence interval, in function of τ. The gray shaded areas indicate the regions in which the average delay in masked and unmasked trials was significantly different (Wilcoxon signed-rank tests, Bonferroni corrected, with p < 0.05).
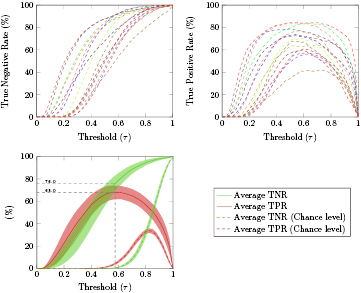
Figure 6. Asynchronous cross-validation in the first 80% of the data: Top: Average percentage of correct and error trials successfully classified (TNR and TPR, left and right images, respectively) in function of the thresholds (τ) for each subject (dashed colored lines). Bottom: Average TNR and TPR (green and red solid lines, respectively) in function of τ. The average chance level of the TNR and TPR are represented in green and red dashed lines, respectively. The shaded areas represent the 95% confidence interval for the averages. The gray dashed lines indicate the threshold that maximizes the average TPR ( ) as well as the average TNR and TPR associated with it.
Download figure:
Standard image High-resolution image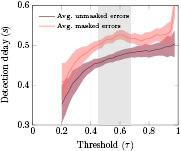
Figure 7. Asynchronous cross-validation in the first 80% of the data: Average delay in the detection of an error event (period between the error onset and the detection of an error event by the classifier) on masked and unmasked error trials successfully classified (TP trials) (pink and dark red lines respectively) and the corresponding 95% confidence intervals (shaded areas), in function of τ. We considered only the thresholds in which all subjects had at least one error trial successfully classified. The shaded gray areas indicate the regions in which the average delay in masked and unmasked trials was significantly different (Wilcoxon signed-rank tests, Bonferroni corrected, with p < 0.05).
Download figure:
Standard image High-resolution imageIn order to simulate an online scenario, we considered a chronological split (80%–20%) of the data, using the first 80% of the data to train the classifier and the last 20% to test it asynchronously. The average TNR and TPR obtained (black solid lines) in function of τ as well as the individual results of each participant (colored dashed lines) are shown in figure 8. Figure 9, left image, shows the TNR and TPR of each participant and their average, for  . With this threshold, we obtained an average TNR of 80.9% and an average TPR of 64.9%. The chance level results of each participant are represented with small circles.
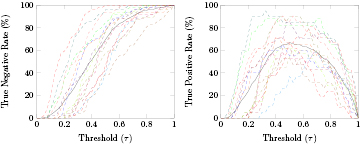
Figure 8. Chronological split (80%–20%): Average percentage of correct trials successfully classified (TNR) and error trials successfully classified (TPR) (black lines, left and right images respectively) in function of the threshold (τ). The dashed colored lines represent the TNR and TPR of each participant.
Download figure:
Standard image High-resolution image
Figure 9. Chronological split (80%–20%): The percentage of correct trials successfully classified (TNR) are depicted with green bars and the percentage of error trials successfully classified (TPR) are depicted with red bars. The chance level results of each participant are represented with small circles. Left: Asynchronous classification using the threshold  . Right: Asynchronous classification using individual thresholds. The blue numbers near the bars indicate the threshold used for each subject.
Download figure:
Standard image High-resolution image
Next, in order to try to improve the classification results in the simulated online scenario, we decided to use individualized classifiers. Therefore, we considered, for each subject, the threshold τ that maximized the individual average TPR in the asynchronous cross-validation in the first 80% of the data (see figure 6, top right). This threshold was then used in the asynchronous classification of the data in the chronological split (80%–20%). Figure 9, right image, shows the TNR and TPR obtained for each subject, using individualized thresholds, and their average. The average TNR obtained was 84.0% and the average TPR was 64.9%. The chance level results of each participant are represented with small circles. The blue numbers near the barplots of each subject indicate the threshold used for that subject. The use of individualized thresholds did not significantly change the TPR nor the TNR, in comparison with the use of  (Wilcoxon signed-rank tests, with p = 0.828 for the TPR comparison and p = 0.361 for the TNR comparison).
4. Discussion
We developed this study to investigate if the instability of the feedback, during a task with continuous control and continuous feedback, would affect the error signal at a neurophysiological level. We also intended to study if different feedback modalities could make the error signals discernible in terms of classification. Finally, we aimed to asynchronously decode errors during a task with continuous control and continuous feedback. With these aims in mind, we developed a task in which participants continuously controlled a cursor on a screen using a joystick. The feedback of the cursor position was either normal (unmasked trials) or jittered (masked trials). The error trials correspond to a loss of control over the cursor's trajectory. The correct trials correspond to the period in which the cursor is moving on the screen and are not associated with any specific event. Thus, our protocol differs from standard protocols on error-related potentials in discrete BCIs, in which correct trials are associated with a correct event, but is similar to protocols described in literature regarding error-related potentials during continuous feedback [4, 28, 30].
In the electrophysiological analysis, the correct signals were mainly flat. Error and correct signals were significantly different in the time periods corresponding to the first negativity and positivity of the error trials.
When comparing the error signals under the two types of feedback (masked and unmasked errors), we obtained two small intervals in which the signals were significantly different. The masked error signal was delayed in comparison to the unmasked error signal: the peaks of the masked error signals occurred significantly later than the corresponding peaks of the unmasked error signals. The time shift that maximized the cross-correlation between the two grand average signals was 28 ms. Additionally, peak amplitudes in masked error signals were significantly less pronounced than the peak amplitudes in unmasked error signals. We hypothesize that this occurs due to a smearing effect in the averaged masked error signal, caused by a trial-to-trial variability in the moment in which participants realized the occurrence of an error [36]. Alternatively, these results could be seen as evidence for conceptualizing error awareness as a decision process, involving evidence accumulation [37, 38]. Steinhauser and Yeung suggested that the amplitude of the Pe component of ErrPs reflects the evidence strength that an error has occurred [39, 40]. Following this line of reasoning, the lower Pe amplitude observed in the masked errors of our experiment could reflect a weaker evidence for the occurrence of an error, caused by the jittered feedback.
The time-locked classification of correct against error trials allowed a good discrimination between the type of trials. On average, 96.4% of the correct trials were successfully classified and 81.8% of the error trials were successfully classified. The obtained average Cohen-κ was 0.803. Differently, the time-locked classification of masked errors against unmasked errors did not allow a satisfactory discrimination between the classes. On average, 60.6% of the masked errors trials were successfully classified and 58.3% of the unmasked error trials were successfully classified. The obtained average Cohen-κ was 0.189. These value lie within the 95% confidence intervals for a chance level classifier. This indicates that the type of feedback used (normal or jittered) did not make the errors distinguishable in terms of classification. The time-locked classification results are similar to the ones obtained in [41] and comparable with state-of-the-art literature on time-locked classification of error-related potentials [15, 26, 27, 30].
Given that masked and unmasked errors were indistinguishable in terms of time-locked classification, we decided to perform asynchronous classification only for the detection of errors (correct versus error), using both masked and unmasked trials to train the classifier. First, we performed an asynchronous cross-validation in the first 80% of the data, what allowed the calculation of average results for each subject, taking into account the data variability. In this scenario, masked errors were detected significantly later than unmasked errors, for the thresholds (τ) that lead to better performances. Then, in order to simulate an online scenario, we considered the first 80% of the data to train the classifier and the last 20% to test it. We used two approaches to evaluate results in this simulated online scenario. The first approach consisted in a non-individualized classifier for all subjects: we chose the threshold that maximized the average TPR in the asynchronous cross-validation in the first 80% of the data ( ), resulting in an average TPR of 64.9% and in an average TNR of 80.9%. The second approach consisted in individualized classifiers: we chose the threshold that maximized the individual average TPR in the asynchronous cross-validation in the first 80% of the data. The use of individualized classifiers slightly improved the classification results: the average TNR increased from 80.9% to 84.0% and the average TPR remained the same. The difference between the classifiers regarding the TPR and TNR was not significant. We were expecting fatigue to influence the results in the simulated online scenario [42] but the performances obtained in this case lied within the 95% confidence interval calculated for the cross-validated data, indicating no decrease in performance.
Other studies also performed asynchronous decoding of ErrPs. Omedes et al asynchronously classified sudden and gradual observation errors [28]. Their sudden errors are comparable to the unmasked errors in this study. Their gradual errors appeared to be much less time-locked to the onset than the masked errors presented here. Spüler and Niethammer asynchronously classified outcome and execution errors during continuous control and continuous feedback [30]. According to their categorization, the errors in our protocol would be both outcome and execution errors. Both Spüler and Omedes considered frequency domain features in their classification but we obtained comparable results using only time domain features. Alternatively, one could approach the detection of error-related potentials from a more generic perspective, by taking into account frequency ranges that are not commonly considered [43, 44].
The direct transfer of our simulated online results to an online scenario would not be realistic because it would require a long training period (it took us around 50 min to record 80% of the trials). The need for big amounts of data to train the classifiers is a general problem in the BCI field and it is of extreme importance to investigate possible approaches to overcome it. Several studies used different approaches to reduce calibration time. Kim and Kirchner showed the feasibility of using a classifier trained with observation errors to classify interaction errors within the same task [45]. Iturrate and colleagues showed the feasibility of transferring a classifier between different observation tasks, using delay-corrected potentials [46]. Spinnato and colleagues showed that a wavelet domain Gaussian linear mixed model (LMM) was superior to other classifying methods, particularly when using few training trials [47]. Kim and Kirchner also showed that it was possible to use a classifier trained with errors of several participants to classify the errors of another participant, at the cost of a decrease in performance [45]. Pinegger and Müller-Putz developed a similar classifier but for the detection of P300, without loss of performance [48]. These strategies (as well as the use of adaptive classifiers) are alternatives to reduce calibration times that should be considered when developing online BCIs [17–21].
In our study, correct and error trials were successfully classifiable. Masked and unmasked errors were different in terms of electrophysiology but indistinguishable in terms of classification. The asynchronous detection of errors was reliable and not influenced by the feedback modality during the continuous control of a cursor using a joystick. Hence, we envision that we could use EEG to detect error signals during the continuous control of a robotic arm.
Acknowledgments
The authors would like to acknowledge the help of M K Höller during the preparation of the experiments described in the article. This work was supported by ERC Consolidator Grant 681231 'Feel Your Reach'.