

Abstract
Objective. Retinal prostheses aim to restore vision in patients with retinal degenerative diseases, such as age-related macular degeneration and retinitis pigmentosa. By implanting an array of microelectrodes, such a device creates percepts in patients through electrical stimulation of surviving retinal neurons. A challenge for retinal prostheses when trying to return high quality vision is the unintended activation of retinal ganglion cells through the stimulation of passing axon bundles, which leads to patients reporting large, elongated patches of light instead of focal spots. Approach. In this work, we used calcium imaging to record the responses of retinal ganglion cells to electrical stimulation in explanted retina using rectangular electrodes placed with different orientations relative to the axon bundles. Main results. We showed that narrow, rectangular electrodes oriented parallel to the axon bundles can achieve focal stimulation. To further improve the strategy, we studied the impact of different stimulation waveforms and electrode configurations. We found the selectivity for focal stimulation to be higher when using short (33 μs), anodic-first biphasic pulses, with long electrode lengths and at least 50 μm electrode-to-retinal separation. Focal stimulation was, in fact, less selective when the electrodes made direct contact with the retinal surface due to unwanted preferential stimulation of the proximal axon bundles. Significance. When employed in retinal prostheses, the proposed stimulation strategy is expected to provide improved quality of vision to the blind.
Export citation and abstract BibTeX RIS
1. Introduction
Retinal degenerative diseases, including age-related macular degeneration (AMD) and retinitis pigmentosa (RP), are leading causes of major vision loss and blindness. Approximately one in every 3000 people is affected by RP [1] and one in seven Australians over 50 has evidence of macular degeneration [2]. Both diseases lead to the loss of retinal photoreceptor cells. Retinal prostheses attempt to treat these incurable conditions by electrically stimulating surviving cells in the inner retina (mainly retinal ganglion cells: RGCs) [3]. Several devices, including Second Sight's Argus II, Retina Implant AG's Alpha IMS, and Bionic Vision Australia's (BVA) devices have been implanted into human patients and have demonstrated restoration of a limited sense of vision [3]. Patients with implants can detect light and recognize some objects [4–6], however, the visual acuity of existing devices is low, meaning that crucial visual abilities are not yet possible.
One serious problem that patients have reported is that the percept created by electrical stimulation of individual electrodes (a phosphene) is not a focal spot of light. Instead, single-electrode stimulation usually leads to the perception of a large, elongated, blurred and distorted patch of light [7, 8]. This makes it very challenging for the patients to recognize even simple shapes and forms. Shape perception requires precise activation of retinal cells with a two dimensional array of electrodes that creates a spatial pattern of activity in the retina [9]. Each electrode is expected to only activate cells nearby, which should create a small visual phosphene that can serve as a building block for pattern recognition. The unintended activation of cells in the retina originates mainly from two phenomena: (1) spread of the electrical field generated from the electrodes, and (2) the unintended activation of passing RGC axon bundles under the electrode. In the first case the electrical charge simply stimulates too large an area of RGCs, which might be solved by reducing the electrode size. Smaller electrodes are expected to generate smaller electric fields and, therefore, smaller activation areas. However, experimental results indicate that the activation patterns cannot be confined simply by reducing the electrode sizes. It was found that even electrodes as small as 10 μm could lead to activation spread through axon bundles [10]. In this second case, the unintentionally stimulated axons originate from cells with cell bodies (and therefore their visual receptive fields) located away from the stimulated site on the retina [10, 11]. As the retina is spatiotopically organized, activation of axons leads to the perception of elongated light patches [8].
Previous computational simulations indicate that the activation of axon bundles can be minimized either by using long electrodes oriented parallel to theses axons [12] or with simultaneous stimulation of multiple electrodes that are aligned with the axons [13]. Figure 1 illustrates the concept of the study. There are two bases underlying these results. First, the axon initial segment (AIS), which is located about 10 μm away from the RGC soma, has been shown to be the most excitable part of a RGC to electrical stimulation from a small electrode [14]. The preferential activation of the AIS over axon bundles helps to confine the activation patterns of RGCs. Second, the membrane potential responses of an axon to extracellular stimulation are governed by the activating function: the second spatial derivative of the extracellular potential along the axon's length [15]. When orienting a long rectangular electrode parallel to the axon bundles, the peaks of the activating function on the axon bundles are reduced, compared to the peak of a short electrode, due to flattening of the extracellular potential in that direction (figure 1(e)). Therefore, axon bundle activation is minimized. Note that a peak in the activating function occurs at either end of the long parallel electrode. In between the electrode ends, the activation function is further reduced, but typically to a value still sizably greater than zero for electrodes of moderate length that are separated from the axon bundles by moderate distances (e.g. 200 μm and 10–20 μm separation). For very long electrodes, located very close to the axon bundles, the activating function can drop to near zero values between the electrode ends. In contrast, the orientation of the AIS of RGCs is much more random compared with the parallel tracks of the axon bundles [13] (figures 1(c) and (d)). Many AISs in the vicinity of the electrode will be approximately perpendicular to the electrode and will have comparatively large activating functions so that they are stimulated more readily. The activating function is larger for those AISs because the extracellular potential and electric field drops off rapidly in the direction perpendicular to the electrode. Finally, the direct impact of the activating function on any AIS located far from the electrode will be minimal regardless of orientation, and the electrode can only affect these cells if their axons pass in the vicinity of the electrode.
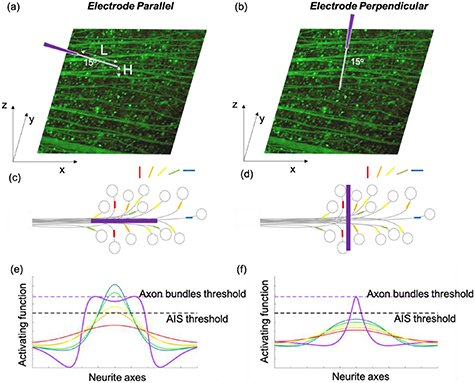
Figure 1. Illustration of the placement of the fibre structured rectangular electrodes on the retinal surface for electrical stimulation. (a), (b)The RGC somas in whole mount retina were loaded with OGB-1, shown as green dots. The axon bundles were also stained and visible under a confocal microscope. The fibre electrodes are encapsulated in the pulled glass capillaries with different lengths(L) exposed. The electrodes were kept at an angle of 15° from the retinal surface, with tips at different distances above the retinal surface (H). In each experiment, the electrodes were either parallel (a) or perpendicular (b) to the local axon bundles. (c), (d) schematic illustration of the parallel and perpendicular placement of electrodes with respect to axon bundles. The AIS (coloured bars) are shown overlaying axons (thin black lines) which emanate from the somas of RGCs (circles). The axon bundles are shown collecting into a bundle with different electrode placement. The orientation of the AISs of RGCs is colour coded as per the legend. The orientation is much more random compared with the parallel tracks of the axon bundles. (e), (f) illustration of the activating function of axons bundles (purple) and the AIS (colour coded by AIS orientation: red through to blue, the same as per the legend in (c) and (d)) with different electrode placements. Dashed lines represent the activating function thresholds for axon bundles (purple) and the AIS (black). Stimulus currents are chosen such that they drive the axon bundles precisely at its threshold level.
Download figure:
Standard image High-resolution imageHere, we used rectangular electrodes and placed the electrodes either parallel with or perpendicular to the retinal axon bundles. By imaging the responses of RGCs in explanted retina to electrical stimulation, we showed that a rectangular electrode with its long axis oriented parallel to the axon bundles creates focal activation of RGC cell bodies. In addition to electrode orientation, the impact of pulse durations, pulse polarities, electrode lengths and the electrode distance from the retinal surface was investigated.
2. Methods
2.1. Animal ethics
All procedures performed in this study were in accordance with the ethics standards of the Animal Care and Ethics Committee of The University of Melbourne (Ethics ID #1814462.3)
2.2. Retinal preparation
Data came from adult pigmented Long Evans rats of either gender and older than 3 months. The retinal preparation was the same as previously described [16]. Briefly, the animals were anesthetized and then sacrificed after enucleation using intracardiac injection of 1 ml of Letharbarb. After enucleation, 0.5 μl of 20 mM Oregon Green 488 BAPTA-1 solution (OGB-1, Hexapotassium salt, Thermo Fisher Scientific, dissolved in deionized water) was injected into each eye from the cut end of its optic nerve. The lens and cornea were then carefully removed. The retina was kept in an eyecup overnight in a dish filled with carbogenated Ames' solution at room temperature.
On the second day, the whole mounted retina was prepared by removing the eye cup and cleaning away the vitreous. In each experiment, half or one third of the retina was mounted with ganglion cell side up on a coverslip. The retina was then held in place using a homemade stainless steel harp fitted with Lycra threads. During the experiments, the retina was continuously perfused with carbogenated Ames' solution at a rate of 3–8 ml min−1 at 33 °C–35 °C.
2.3. Electrical stimulation and calcium imaging
RGCs were imaged through a confocal microscope (Olympus, FluoView FV1200) using a 20 objective lens. The source of excitation was a 473 nm laser. Images of an area of 318
  318 μm2 were captured at a frequency of 7.8 Hz.
Electrical stimulation was delivered through diamond coated carbon fiber electrodes. The electrode fabrication was modified from Hejazi et al [17]. Briefly, PAN-based carbon fibers were first electrochemically functionalized with aminophenyl groups and then coated with oxygen terminated nanodiamonds via covalent bonding. Boron doped ultrananocrystalline diamond (B-UNCD) was then deposited onto the fiber surface through microwave plasma enhanced chemical vapor deposition. Single diamond coated carbon fibers were attached to copper wires by silver epoxy, encapsulated in glass capillaries and pulled to form micro-electrodes with a micropipette puller (Model P-2000 Sutter Instrument Co). The diameter of the fibers was about 10 μm and the lengths of the fiber exposed from the glass insulation varied between 20 μm and 200 μm.
During experiments, the fiber electrodes were placed on the retinal surface either parallel with or perpendicular to the axon bundles (figure 1(a) and (b)). As axon bundles have curvatures, the orientation was determined according to the small segment of the axon bundles to which the electrodes were closest. The angle between electrode and retinal surface was kept at 15°, and the tip was either in contact with, or at a distance of 25 μm or 50 μm away from the retinal surface.
Biphasic current stimulation was delivered using the Ripple Neuro System via a Nano 2+ stim headstage. Each stimulation consisted of a burst of 10 anodic- or cathodic-first, charge balanced current waveforms at a frequency of 60 Hz, with varying pulse durations from 33 μs to 500 μs. A constant interphase duration of 33 μs was used. In each recording, 10 different current amplitudes were delivered. For each amplitude, the stimulation was repeated with 10 bursts at an interval of 2 s. There was a 5 s delay at the beginning of each set of stimuli and a marker signal was sent from the Ripple Neuro System to the confocal microscope to allow the synchronization of images with the stimulus presentation. There was another 10 s delay between changing current amplitudes to allow the fluorescence intensity to decay to its background level. To compare results between different conditions, the maximum charge density was kept constant in this study, which was 780 μC cm−2. This value is within the safe charge injection of the electrode material (∼7 mC cm−2), and was determined by the maximum available currents (1500 μA) from the Ripple Neuro System. As the fibre electrode has a diameter of 10 μm and lengths between 20 and 200 μm, the maximum available charge was calculated as: 1500 μA  33 μs/(200
  10
10  +
+ 
 10
10  10/4) =780 μC cm−2. As an electrical return, we used a Ag/AgCl wire placed 2 cm away from the stimulating electrode in the perfusion chamber.
2.4. Data analysis
The data analysis was similar to that described previously [16]. To fully capture the stimulated pattern, images were taken at multiple areas across the retina along the direction of the axon bundles, and then stitched together using an ImageJ MosaicJ plugin. The soma was manually identified and the fluorescence transient for each neuron was obtained using the ImageJ ROI tool. Electrically evoked responses were detected by first high pass filtering the fluorescence intensity, and then identified by thresholding at 1.5× standard deviation of the filtered signal, and temporally correlating with the stimuli. A sigmoidal curve was used to fit the relationship between the response percentage and stimulation amplitudes. The amplitude that yielded a neuron with 50% response was defined as the threshold.
Threshold maps for each experimental condition were generated by summarizing the results from at least five pieces of retina (figures 2(a) and (d)). The maps were rotated and shifted into the same reference frame (relative to the optic disk and electrode position), with the optic disc lying left of the electrode. All neurons were divided into 30  30 μm2 bins, and the colours represent the average thresholds for the neurons activated in each bin. If no neuron was activated even with the maximum charge (780 μC cm−2), the bin is shown as an open circle. Bins are shown with three different sizes of circles, indicating the number of neurons activated with the maximum charge. The large circles represent the bins with more than half the neurons activated using the maximum charge; medium circles represent those with 20%–50% neuron activation; and the bins with less than 20% or no neural activity are displayed as the small circles.
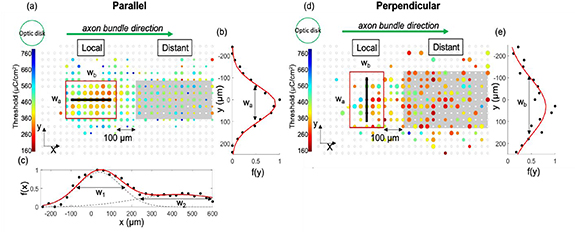
Figure 2. Calcium imaging data analysis. Data shown here were obtained using 200 μm long electrodes in contact with the retina, stimulated using 100 μs anodic-first pulses. The electrodes were placed either parallel with (a)–(c) or perpendicular to (d), (e) the axon bundles. Threshold maps in (a) and (d) were generated by averaging the results from at least five repeats. Electrodes are drawn as black bars. The maps are rotated and shifted so that the optic disks lie on the left with axon bundles running to the right. The neurons are binned into 30  30 μm2 grids and the colours represent the average thresholds for neurons in each bin. Open circles indicate the bins with no neurons activated when the maximum charge was injected. The size of circles indicates the percentage of neurons activated in each bin with the maximum charge. Large circles indicate more than half of neurons were activated by the maximum charge; medium circles represent those with 20%–50% of neurons activated; and small circles are for those with less than 20% activation. Red rectangles indicate the local activation region and grey shaded areas indicate the distant activation region. For 200 μm long electrodes, the local activation region was determined according to the Gaussian fitting of the activation percentage f(y) along the axon bundle direction, as shown in (b) and (e). The width (wa) and length (wb) were equal to twice of the variance obtained from the fitting (c in equation 1). However, for electrodes with other lengths, the width (wa) was determined from the Gaussian fitting of the activation percentage f(y) along the axon bundle direction; the length (wb) was determined from the two-term Gaussian fitting of the activation percentage f(x) perpendicular to the axon bundle direction, as shown in (c). In these cases, wb is equal to w1, which is twice c1 in equation (2).
Download figure:
Standard image High-resolution imageTo further compare the spread of activation between different experimental conditions, we defined local and distant activation regions.
To define the local activation regions, the spatial distributions of neurons activated at the maximum charge were plotted in parallel ( -axis, figures 2(b) and (e)) and perpendicular (
 -axis, figures 2(c)) directions with respect to the axon bundle. This revealed the percentages of neurons activated both locally and distantly from the electrode. The zero point in each axis represents the centre of the electrode. The activation density
  in relation to the
  -axis (figures 2(b) and (e)) was fitted with a Gaussian distribution:
where a, b, c represents the height, the centre and the variance of the Gaussian function, respectively. For electrodes parallel with the axon bundles, the activation density  in relation to the
  -axis (figures 2(c)) was bimodal and could be fitted with a two-term Gaussian model:
where  represent the heights of each fitted Gaussian distribution,
  represent the centre locations, and
  show the variances. For electrodes perpendicular with axons bundles, it was not necessary to fit a function for the activation density
  in order to define the local and distant activation regions.
The local activation regions were defined within rectangular regions. Experiments that compared parallel versus perpendicular electrode placement used 200 μm long electrodes. For these experiments, the local activation region was identical in dimensions and area for the parallel and perpendicular conditions, but the rectangular region was rotated by 90° with respect to each other. The dimensions were determined according to the data collected from both electrode/axon bundle orientations (parallel and perpendicular) using the fit of activation density  along the
  -axis only. As shown in figures 2(a) and (d), for 200 μm long electrodes, the width (wa) and length (wb) of the local activation region were determined as twice the average fitted variances (c) in equation (1), when electrodes were placed parallel with and perpendicular to the axon bundles, respectively.
For electrodes of all the other lengths, only data with one electrode/axon bundle orientation (parallel) was collected, precluding the use of the methods for defining the local action area of 200 μm long electrodes. Therefore, the length of the local activation region (wb) was determined as twice the fitted variance ( ) from equation (2). The width (wa) of the local activation region was determined in the same way as that for 200 μm long electrodes, according to the variance fitted from equation (1). A full list of the local activation areas can be found in table 1.
Table 1. Local region estimation.
| Electrode Length | 20 μm | 50 μm | 100 μm | 200 μm |
|---|---|---|---|---|
| Width (wa)a | 170 μm | 154 μm | 156 μm | 168 μm |
| Length (wb)a | 228 μm | 234 μm | 206 μm | 250 μm |
| Square width with the same area | 196 μm | 190 μm | 180 μm | 204 μm |
a width (wa) and length (wb) are shown as figure 2.
In all experiments, the distant activation regions were defined as the shaded areas in figure 2(a) and (d). They are along the axon bundle direction, with the same width as the local activation region perpendicular to the axon bundle direction and 100 μm away from the edge of the local activation region. The distant activation regions extend to the edge of the imaging area along the axon bundle direction (x direction), which was 600 μm away from the centre of the electrodes.
The local activation percentages were estimated by first calculating the average neuron activation thresholds in each experiment, and then comparing the number of neurons activated at the average thresholds within the local (Nlocal) and distant (Ndistant) regions. Here,
Local and distant activation thresholds were estimated by calculating the average thresholds for neurons activated with maximum charge in each activation region. The statistical difference between local activation percentages was analysed using one-way ANOVA with post hoc tests. The significance for local and distant activation thresholds was determined using unpaired student t-tests. All data processing was performed in ImageJ (National Institutes of Health) and MATLAB (MathWorks).
3. Results
3.1. Effect of electrode and axon bundle orientation
Figure 3 shows typical distributions of activated RGCs using rectangular electrodes with different orientations in relation to the axon bundles. Here stimulation was delivered using a 200 μm long electrode, with the electrode tip in contact with the retinal surfaces. Both results were obtained using anodic-first 100 μs biphasic pulses with a current amplitude of 350 μA. When the electrode (shown red) was parallel with the passing axon bundles the activated RGC somas (shown blue) were mostly located close to the electrode (figures 3(a) and (c)). However, the same stimulus waveform resulted in a much larger RGC activation spread when the electrode was placed perpendicular to the axon bundles (figures 3(b) and (d)), with many neurons activated along the axon bundles on the right side of the image. Here the spread of RGC activation was most likely due to the activation of the passing axons.

Figure 3. Calcium imaging of RGCs in response to electrode stimulation with different electrode/axon bundle orientations. All images were oriented such that the optic disk lies to the left of the image, with axon bundles running horizontally towards their originating somata on the right. (a), (b) Background subtracted fluorescence response to a 200 μm long electrode (red) placed parallel (a) and perpendicular (b) to the axons. Images were obtained from the same region of the same retina. Only RGCs activated were lit up and no activation of axon bundles was observed. Scale bar: 100 μm. RGCs responding to the stimuli are drawn as blue circles in (c), (d). The open circles represent RGCs with response below a set threshold to the stimuli. The stimuli used are anodic first biphasic pulses with pulse duration 100 μs, frequency 60 Hz, and current amplitude of 350 μA. A distant return electrode placed 2 cm away from the stimulating electrode was used.
Download figure:
Standard image High-resolution image3.2. Effect of pulse durations and polarities
Biphasic stimulation with pulse durations of 33 μs, 100 μs and 500 μs, as well as different polarities, were tested to determine the optimal stimulation waveforms for local activation. The pulse durations were chosen as those that had previously been shown to drive only direct RGC stimulation, without much contribution from the retinal network [11, 16, 18]. The threshold maps are summarised in figure 4. The neurons activated on the right side of the maps are most likely due to the activation of passing axon bundles near the stimulating electrodes. When electrodes were parallel with the axon bundles (figures 4(a) and (c)), the neurons near the electrodes normally showed thresholds that were lower than those further away from the electrodes, forming a 'hot spot' region. However, when the electrodes were placed perpendicular to the axon bundles (figures 4(b) and (d)), the thresholds were found to be similar between the areas close to and further away from the stimulating electrodes.
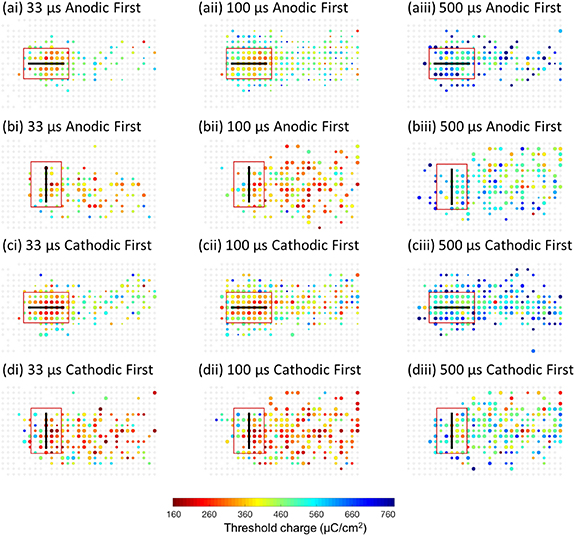
Figure 4. Threshold maps for different pulse durations and polarities. Biphasic stimulation with either cathodic-first or anodic-first pulses, and pulse durations of 33 μs, 100 μs and 500 μs. All electrodes were 200 μm long, with the tips in contact with the retinal surface. The electrodes were placed either parallel with or perpendicular to the axon bundles. Red rectangles indicate the local region used for data analysis. All threshold maps were generated from at least five repeats.
Download figure:
Standard image High-resolution imageTo summarise the ability of different stimulation configurations to elicit local versus nonlocal stimulation, a local activation percentage (figures 5(a) and (b)) was estimated. This was defined as the number of neurons activated within a local activation region as a percentage of neurons activated with local and distant activation regions when stimulating at the average threshold in each experiment (equation (3), see section 2). The local activation regions are shown as red rectangles in figure 4. They are of the same sizes but different orientations depending on the electrode/axon bundle orientation. A 100% local activation percentage indicates that no neuron in the distant region was activated at the average threshold, while 0% means that there was no activation found in the local region. Therefore, a higher local activation percentage indicates a better confinement of the activation pattern. As shown in figures 5(a) and (b), using the same stimulation waveforms, the local activation percentages for the electrodes parallel with the axon bundles were all significantly higher than for those placed perpendicular to the axon bundles. When comparing the results between different pulse durations, shorter pulses tended to result in better confinement. The local activation percentages showed a trend towards being higher for those stimulated with anodic-first pulses but with no significant difference when using p = 0.05 as the level of significance.

Figure 5. Local activation percentages (a), (b) and average thresholds (c), (d) for different pulse durations, polarities and electrode/axon bundle orientations. (a), (b) The local activation percentages are as defined in section 2. 100% indicates that all neurons activated at the average thresholds were within the local activation region, while 0% means no activation found in the local activation region. The data obtained from single experiments are shown as circles in the graphs and error bars represent the standard deviation. Significance from TukeyHSD. (c), (d) The average thresholds within the local and distant activation region and stars indicate significant difference between the local and distant region using the same experimental condition. The numbers listed show the percentage difference between the average distant and local threshold. A positive number indicates that the average threshold of the distant region is larger than that of the local region. Significance from two-tailed t-test. Data used for analysis are the same as figure 4. *p < 0.05, **p < 0.01.
Download figure:
Standard image High-resolution imageAny differences of the average thresholds for local and distant activation were also assessed (figures 5(c) and (d)). A larger threshold difference means a better selectivity for local activation. The largest difference was found when electrodes were parallel with the axon bundles and 33 μs, anodic-first pulses were used; in this case, the distant threshold was 64% higher than the local threshold. For electrodes placed parallel with the axon bundles, the threshold difference was lower when pulse duration increased, but the distant thresholds remained significantly higher than the local thresholds. Anodic-first pulses tended to show larger threshold differences. In contrast, when the electrodes were placed perpendicular to the axon bundles, there were no significant differences between local and distant activation thresholds, regardless of pulse durations and polarities.
3.3. Effect of electrode length
Shorter electrodes are expected to generate more confined electric fields and, therefore, smaller activation areas. However, due to the activation of axon bundles, shorter electrodes may non-the-less lead to a large activation pattern. Therefore, to find the optimal electrode length for focal stimulation, electrode lengths between 20 μm and 200 μm were tested. All electrodes were placed parallel with the axon bundles, with the electrode tips in contact with the retinal surface. The experiments were conducted using 100 μs anodic first pulses and the maximum charge densities were held constant. The threshold maps are shown in figure 6. While the regions near the electrodes tended to have lower thresholds for longer electrodes (100 μm and 200 μm), the threshold differences between different regions in the maps for shorter electrodes (20 μm and 50 μm) were subtle.

Figure 6. Threshold maps for electrode lengths of (a) 20 μm, (b) 50 μm, (c) 100 μm and (d) 200 μm. All data were collected using electrodes placed parallel with the axon bundles, and with their tips in contact with the retinal surface. Anodic-first biphasic pulses with a pulse duration of 100 μs were used and the maximum charge densities were kept constant according to different electrode surface areas. Rectangles indicate the local activation region used for data analysis.
Download figure:
Standard image High-resolution imageA full list of the local activation regions is shown in table 1. We found that the local activation region, based on Gaussian fits (see section 2), was smallest for an electrode length of 100 μm. The average local activation percentages increased with electrode length (figure 7(a)), and the difference was significant between the results from 200 μm and those from all the other electrode lengths. When comparing the average thresholds for local and distant activation, longer electrodes (100 μm and 200 μm) showed significant differences. The average threshold for distant activation when using 100 μm electrodes was found to be 19% higher than that for local activation, indicating a possibility of confining activation patterns with such electrode lengths.
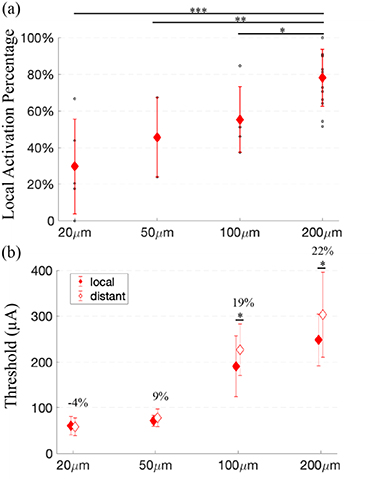
Figure 7. Local activation percentage (a) and average threshold (b) for different electrode lengths. (a) The data obtained from single experiments are shown as circles in the graphs and error bars represent the standard deviation. Significance from TukeyHSD. (b) shows the average thresholds within the local and distant activation region and stars indicate significant difference between the local and distant region using the same experimental condition. The numbers listed show the percentage difference between the average distant and local threshold. Significance from two-tailed t-test. Data used for analysis are the same as figure 6. *p < 0.05, **p < 0.01,***p < 0.001.
Download figure:
Standard image High-resolution image3.4. Effect of electrode-to-retina separation
For epi-retinal implants, a gap between electrode and retina has been reported in clinical trials [19]. The separation between electrode and retina is expected to decrease spatial resolution as the spread of the electric field at the level of the retinal surface increases. Also, the separation is expected to lead to larger stimulation thresholds. Here, we examined the effect of the electrode-to-retina separation by placing the electrodes with the electrode tip at different distances from the retinal surfaces. The experiments were performed using the same electrodes (200 μm long, parallel to the axon bundles) on the same areas of retina. Electrical stimulation was delivered with 100 μs anodic-first biphasic pulses.
Figure 8 shows the threshold maps for results obtained with different electrode-to-retina separation. As expected, an increase of electrode-to-retina distance led to higher activation thresholds. However, the selectivity for local activation improved with the electrode/retina separation, indicating a better spatial resolution. Using the same maximum charges, a further separation between electrode and retina resulted in less neurons being activated outside the local retinal region. These results are consistent with simulation reported in Esler et al [13] (see section 4). Figure 9(a) shows that the local activation percentage at the average threshold did not increase significantly with electrode-to-retina separation. With the same trend as the local activation percentage, the difference between local and distant activation thresholds increased with the electrode-to-retina separation (figure 9(b)). The difference between local and distant activation thresholds increased from 20% to 34% when the separation reached 50 μm.
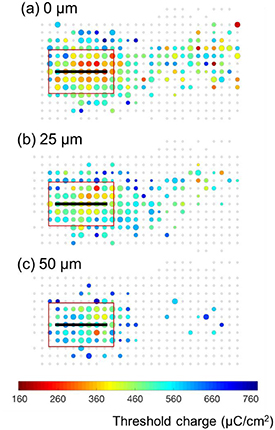
Figure 8. Threshold maps for electrodes placed in contact with (a), 25 μm above (b), and 50 μm above (c) the retinal surfaces. All results were obtained using 200 μm electrodes parallel with the axon bundles. Stimuli were delivered using 100 μs anodic-first biphasic pulses. Data were obtained from the same areas of retina.
Download figure:
Standard image High-resolution image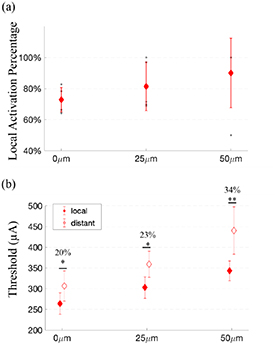
Figure 9. Local activation percentages (a) and average thresholds (b) for different electrode-to-retina separations. (a) The data obtained from single experiments are shown as circles in the graphs and error bars represent the standard deviation. Significance from TukeyHSD. (b) The average thresholds within the local and distant activation region and stars indicate significant difference between the local and distant region using the same experimental condition. The numbers listed show the percentage difference between the average distant and local threshold. Significance from two-tailed t-test. Data used for analysis are the same as figure 8. *p < 0.05.
Download figure:
Standard image High-resolution image
4. Discussion
Using calcium imaging and fiber structured electrodes, we studied the spatial distribution of RGC responses in explanted retina to epi-retinal stimulation with long, rectangular electrodes. By exploring the effect of electrode/axon bundle orientation, biphasic stimulation pulse duration and polarities, as well as electrode length and electrode-to-retina separation, we demonstrated the possibility of generating focal stimulation of RGCs by minimizing the activation spread via axon bundle stimulation. The stimulation strategy proposed in this study is expected to inform the design of retinal prostheses and to improve the visual acuity of patients with epi-retinal implants.
4.1. Comparison to computational simulation
The use of long, rectangular electrodes for avoiding the activation of RGC axon bundles was first proposed by Rattay and Resatz [12]. According to their simulation, the thresholds for activation were lower for nearby RGCs than distant RGCs through passing axons when the electrodes were placed parallel with the axons, as illustrated in figure 1(e). In our work, we used electrodes with the same geometry (10 μm × 200 μm) and we observed consistent results. As shown in figures 3–5, RGCs could be selectively stimulated when the electrodes were placed parallel to the axon bundles. With all pulse durations and polarities used in the study, distant activation thresholds were significantly higher than local activation thresholds when electrodes were placed parallel with the axon bundles (figure 5(b)). In contrast, there was not much difference between local and distant activation thresholds for electrodes placed perpendicular to the axons.
Through computational simulation, Esler et al [13] estimated the activation of RGCs using multielectrode arrays composed of electrodes with diameters of 100 μm and center-to-center distances of 200 μm. They showed that RGCs proximal to the electrodes could be activated much more selectively when multiple electrodes oriented parallel to the axon bundles were simultaneously stimulated. The preference for local RGC activation increased when four electrodes were recruited, compared to the use of one or two electrodes. This is consistent with our experimental observation using single, elongated electrodes, i.e. the selectivity for local RGC activation increases as the length of the electrodes increases (figures 6 and 7).
In addition to the number of electrodes, Esler et al [13] also found that the selectivity for local RGC activation increased as the retina-electrode separation increased. They explained that, for four-electrode stimulation, the membrane potential along the axon has a much smoother shape for electrodes positioned further from the retina. Here, through experimentation in real tissue we also observed that when the same electrodes and stimulation parameters were used, in the same retinas, local RGCs could be preferentially activated with higher selectivity when there was larger electrode-retina separation (figures 8 and 9).
Our experimental observation also suggested that shorter pulses improved the selectivity for local activation. However, from simulation, Esler et al [13] found that the use of longer pulses was theoretically better at avoiding axon bundle activation. This discrepancy is possibly due to the simple assumption in the simulation that the thresholds or the threshold differences between axon bundle and AIS activation do not change with pulse duration. However, from simulation, the local activation selectivity increased with the threshold difference of local and distant activation. In our study, we found that the threshold difference increased with shorter pulse durations, which also led to a higher selectivity for local activation. Another possible contribution to the discrepancy between computational simulation and experimental observation is the influence of network mediated responses in RGCs. The simulation only considered the responses of RGCs to direct electrical stimulation of the somas. However, previous research indicated that more RGCs can be stimulated through bipolar cells and amacrines when the pulse duration increases [11, 16]. It is thus possible that more RGCs were stimulated via the retinal network with 500 μs stimulation compared with shorter pulses, and the network-mediated responses may have an impact on the local activation selectivity with this stimulation strategy.
Both of the simulation studies outlined above were based on an activation function in which the RGC axons are most sensitive to the second spatial derivative of the extracellular potential along the axon's length. Our experiments were consistent with these computational simulations, providing evidence in support of this activation function.
4.2. Comparison to other stimulation strategies
To avoid axon bundle activation during epi-retinal stimulation, several other stimulation strategies have been proposed and tested. Table 2 compares this work and the previous publications about axon bundle activation. In accordance with our finding using 20 μm long electrodes (20 μm × 10 μm), Behrend et al [10] first demonstrated that the spatial resolution for epi-retinal stimulation cannot be improved simply by reducing the size of the electrodes. They showed that there was a spread of RGC activation, mainly due to the activation of axon bundles, when using electrodes with diameters as small as 10 μm. Response area decreased with decreasing electrode size, but no further when the size was reduced below 60 μm.
Table 2. Summary of publications on the strategies for avoiding axon bundle stimulation.
| Electrode | Electrode shape | Optimal parameters for avoiding | Mechanism for RGC | ||
|---|---|---|---|---|---|
| Paper | location | and size | Pulses used | axon bundle stimulation | stimulation |
| Freeman et al [21] | Epiretinal | Conical, 125 μm long and 40 μm base diameter | Sinusoidal pulses, frequencies between 5 and 100 Hz | Low-frequency (⩽25 Hz) sinusoidal pulses | Indirect network stimulation |
| Weitz et al [11] | Epiretinal | Circle, 30–200 μm | Charge balanced biphasic pulses (cathodic first, 60 μs–100 ms) | Biphasic pulses longer than 25 ms; Activation pattern could not be refined for electrodes smaller than 75 μm | |
| Jensen et al [32] | Epiretinal | Conical, 5 μm long and 2 μm base diameter | Monophasic pulses (cathodic or anodic, 100 μs) | Cathodal monophasic pulses | Direct RGC stimulation |
| Jensen et al [33] | Epiretinal | Circle, 125 μm and 500 μm | Monophasic pulses (cathodic or anodic, 100 μs–50 ms) | Biphasic pulses shorter than 0.1 ms | |
| Chang et al [18] | Epiretinal | Circle, 200 μm | Charge balanced biphasic pulses (40 μs-4 ms) | Anodic-first biphasic pulses shorter than 0.12 ms | |
| Tong et al [16] | Subretinal | Square, 120 μm | Charge balanced biphasic pulses (anodic first, phase width 33 μs-50 ms) | Biphasic pulses shorter than 0.1 ms | |
| This work | Epiretinal | Fibre-structured electrodes; 20–200 μm long and 10 μm in diameter | Charge balanced biphasic pulses (cathodic or anodic first, 33–500 μs) | Anodic first biphasic pulses with 33us duration and electrodes longer than 100um placed parallel to the axon bundles | |
| Grosberg et al [34] | Epiretinal | Circle, 10 μm | Charge balanced triphasic pulses (relative amplitudes of 2:−3:2 and phase widths of 50 μs) | A minority of RGCs can be activated selectively without the unwanted activation of axon bundles, by carefully selecting the current amplitudes |
Varying pulse durations have been found to be effective in minimizing axon bundle activation. The impact of pulse durations on the spatial and temporal responses of RGCs to electrical stimulation has been reviewed before [20]. One strategy suggested the use of pulses with very long durations (biphasic pulses longer than 25 ms or sine waves at frequencies between 5–25 Hz) [11, 21, 22]. Such long pulses preferentially activate RGCs through the retinal network, which can bypass axon bundle activation and lead to focal activation of RGCs [11]. Compared with direct RGC stimulation, network stimulation is expected to exploit the advantage of the natural processing of visual information in the retina. However, there are several possible limitations with network stimulation. First, there are no studies to support the safety of using pulse duration larger than a few milliseconds. Second, it remains unclear if the function of natural information processing is preserved following retinal degeneration. Retinal remodeling following degeneration has been reported in several studies [23–26]. Third, it has been suggested that network stimulation might be associated with the phenomenon of image fading, which is reported by patients during stimulation [27–30]. Fourth, the threshold charge density increases with pulse duration. For example, pulses longer than 25 ms require charge densities larger than 1 mC cm−2 [11, 16], which will consume more power and may exceed the safe charge injection limit of conventional electrode materials (150 μC cm−2 for platinum [31]).
Another strategy suggests shorter pulses, which tend to stimulate RGCs directly with minimal contribution from network responses [11, 16, 18, 35]. Similar to our results, several other studies have demonstrated that the preference for local activation over axon bundles increases when shorter pulses are used [18, 33]. For example, Chang et al [18] demonstrated local activation of RGCs by using pulses shorter than 0.12 ms. We also found that shorter pulses (0.033 ms and 0.1 ms) were more effective at avoiding the stimulation of axon bundles than longer pulses (0.5 ms). However, Chang et al used large circular electrodes (200 μm in diameter). It is unclear if their strategy would remain effective if the electrode sizes were reduced. As shown in our results (figures 6 and 7), 0.1 ms pulses could not confine the RGC activation patterns when we used 20 μm × 10 μm electrodes. Chang et al also suggested the use of asymmetric waveforms to lower stimulation thresholds. We did not test the effect of waveform symmetry in our work, but it may also be helpful to reduce the threshold currents required with the 33 μs pulses.
Lastly, Grosberg et al [34] selectively stimulated RGCs and avoided axon bundle activation by carefully controlling the amplitudes of stimulating currents. Here they also used 0.1 ms pulses for direct RGC activation. This strategy requires the use of multielectrode arrays capable of both stimulation and recording, which are not yet available in the clinic. With this strategy, 45% of electrodes could stimulate RGCs without axon bundle activation. Combining the type of electrode configuration proposed here with published techniques for simultaneous electrical stimulation and recording in [34], it is possible to improve the percentage of electrodes that stimulate local RGCs without activating axon bundles.
4.3. Implications for retinal prostheses
To be employed by retinal prostheses, the stimulation strategy proposed in this study will require the use of multielectrode arrays composed of long, rectangular electrodes and the placement of the electrodes parallel to the axon bundles. The electrode array placement may bring challenges for surgery. However, as the axon bundles between fovea and optic disk are quite parallel [36], implanting devices near the fovea may alleviate the surgical difficulty.
Although short, anodic-first pulses could improve the selectivity for local activation, the threshold currents required also increase. For example, the average threshold currents for local activation with 33 μs pulses were above 500 μA. The requirement for the use of large currents during stimulation may bring challenges to the design of application-specific integrated circuits (ASICs). Compared with 33 μs pulses, anodic-first biphasic pulses of 100 μs duration might be a good compromise as less current is required. Furthermore, the selectivity for a 100 μs duration was not significantly different from the 33 μs pulses and remained higher than the 500 μs pulses.
Selectivity for local activation decreased with electrode length. However, the threshold difference between local and distant activation remained significant when 100 μm long electrodes were used, indicating the possibility for focal activation with such an electrode length.
For epi-retinal devices, gaps between the electrode surface and the retinal surface have been reported [19]. Previously, this has been considered as a problem as the spread of electric field increases with the electrode-retina separation and more charge/current will be required for RGC activation. Here, we also observed that thresholds for RGC activation increased with electrode-retina separation. However, the selectivity for local activation also improved as this distance increased. Therefore, by balancing the selectivity of local activation and the stimulating thresholds, an optimal separation distance may be obtained that could improve the performance of retinal prostheses after implantation, which is usually associated with some unavoidable electrode-retina separation.
The experiments in this study were all conducted with single electrodes. In retinal implants, the image can be reconstructed by either stimulating individual electrodes in a sequence, or by simultaneously stimulating multiple electrodes. Sequential individual electrode stimulation will require the image reconstruction to be completed within the integration time of the visual circuitry in the brain, which is expected to be tens of ms. Therefore, the ultrashort pulses suggested by our stimulation strategy might benefit the image reconstruction with sequential stimulation. However, when multiple electrodes are simultaneously stimulated, it remains unknown what the RGC activation pattern might look like with the electrode configurations proposed in this study.
4.4. Limitation
Firstly, we employed calcium imaging to study the spatial distribution of RGC activation. The image acquisition frequency (7.8 Hz) employed in this study is low, which limits the capability for studying the temporal responses of the RGCs. Also, bursts of stimuli had to be delivered to generate detectable responses. It is possible that RGCs were activated but did not show detectable fluorescence. We loaded calcium indicators into whole mount retina by injecting the indicators from the optic nerve. There may be RGCs in retina that were not stained and, therefore not recorded. To image the retina, we used a 478 nm laser for excitation, which is within the visible light wavelength. We could not detect the light responses from the RGCs, which limited the possibility for studying different types of RGCs (e.g. ON and OFF cells). To study different types of RGCs, two photon microscopes with infrared light sources might be a better approach [37].
Secondly, in this study we used fiber structured electrodes in the experiments. The fiber electrodes were encapsulated in pulled glass pipettes and placed on the retinal surface using micromanipulators. However, an angle of 15° between the electrode and retina (figure 1) was required, therefore the electrodes were not flat on the surface. Some bias towards the tip-end of the electrode was observed in terms of RGC activation patterns. In the clinical application, electrodes are normally fabricated on a flat surface. However, considering the curvature of the retinal surface, it is expected that there will be some degrees of angle between the electrodes and the retina after implantation. Therefore, the optimal length of the electrodes needs to be adjusted accordingly to effectively minimize the axon bundle activation. Furthermore, the lengths of the fiber were manually controlled during fabrication resulting in a deviation of up to 10% [17].
Third, we placed the electrodes either parallel or perpendicular to a small segment of axon bundles. However, the distribution of axon bundles is much more complicated due to their curvatures. It will be interesting to study the effects of other angles between the electrodes and axon bundles. Also, when we placed the electrodes parallel with the axon bundles, some electrodes sat directly on top of axon bundles while others were displaced away slightly. It would be useful to study the effect of lateral distances between the electrodes and axon bundles, but these were not measured accurately here. Future studies will explore the effects of the more subtle effects of electrode placement.
Lastly, to quantitively compare the results between different experimental conditions, we defined the local and distant activation regions according to Gaussian function fitting in this study, as described in section 2.4. The definition of the different activation regions has an impact on the selectivity values presented in figures 5, 7 and 9. We also performed the analysis with other activation region definitions, for example, by defining the local and distant regions to be the same for all different electrode lengths as defined for 200 μm electrodes. Nevertheless, the results and the conclusions from the other analysis did not show substantial differences from what we have presented in section 3.
5. Conclusion
This study provides experimental data outlining the effects of rectangular electrodes on axon bundle activation during epi-retinal stimulation. Anodic-first pulses with 33 μs pulse durations were found most effective in confining the RGC activation patterns, when rectangle electrodes were placed parallel to the axon bundles. The confinement decreased with electrode lengths, but remained significant for electrode lengths >100 μm. Finally, larger electrode-retina separation lead to better local activation selectivity, although at the cost of higher activation thresholds.
Acknowledgments
The research was supported by a Development Grant from The National Health and Medical Research Council (NHMRC, GNT1118223) of Australia. The work was performed in part at the Melbourne Centre for Nanofabrication (MCN) in the Victorian Node of the Australian National Fabrication Facility (ANFF). D J G is supported by NHMRC Project Grant GNT1101717 and by an Australian Nanofabrication Facility (ANFF)/Melbourne Centre for Nanofabrication (MCN) Technology Ambassador Fellowship. S P is cofounder and shareholder of iBIONICS, a company developing a diamond based retinal prothesis. S P and D J G are shareholders and executive officers of Carbon Cybernetics Pty Ltd, a company developing diamond and carbon-based medical device components. The other authors declare no conflict of interest.