
Abstract
Objective. The development of experimental methodology utilizing graphene micro-transistor arrays to facilitate and advance translational research into cortical spreading depression (CSD) in the awake brain. Approach. CSDs were reliably induced in awake nontransgenic mice using optogenetic methods. High-fidelity DC-coupled electrophysiological mapping of propagating CSDs was obtained using flexible arrays of graphene soultion-gated field-effect transistors (gSGFETs). Main results. Viral vectors targetted channelrhopsin expression in neurons of the motor cortex resulting in a transduction volume ⩾1 mm3. 5–10 s of continous blue light stimulation induced CSD that propagated across the cortex at a velocity of 3.0 ± 0.1 mm min−1. Graphene micro-transistor arrays enabled high-density mapping of infraslow activity correlated with neuronal activity suppression across multiple frequency bands during both CSD initiation and propagation. Localized differences in the CSD waveform could be detected and categorized into distinct clusters demonstrating the spatial resolution advantages of DC-coupled recordings. We exploited the reliable and repeatable induction of CSDs using this preparation to perform proof-of-principle pharmacological interrogation studies using NMDA antagonists. MK801 (3 mg kg−1) suppressed CSD induction and propagation, an effect mirrored, albeit transiently, by ketamine (15 mg kg−1), thus demonstrating this models' applicability as a preclinical drug screening platform. Finally, we report that CSDs could be detected through the skull using graphene micro-transistors, highlighting additional advantages and future applications of this technology. Significance. CSD is thought to contribute to the pathophysiology of several neurological diseases. CSD research will benefit from technological advances that permit high density electrophysiological mapping of the CSD waveform and propagation across the cortex. We report an in vivo assay that permits minimally invasive optogenetic induction, combined with multichannel DC-coupled recordings enabled by gSGFETs in the awake brain. Adoption of this technological approach could facilitate and transform preclinical investigations of CSD in disease relevant models.
Export citation and abstract BibTeX RIS

Original content from this work may be used under the terms of the Creative Commons Attribution 4.0 license. Any further distribution of this work must maintain attribution to the author(s) and the title of the work, journal citation and DOI.
1. Introduction
Spreading depolarization is the largest disruption of brain homeostasis possible in living neural tissue. It is characterized by an abrupt, near-complete breakdown of the transmembrane ion gradients and high-amplitude (tens of millivolts) negative extracellular potential shift that persists for tens of seconds (Dreier 2011). Cortical spreading depolarization is usually accompanied by temporary suppression of brain activity, although in some severe conditions, where tissue is compromised, spreading depolarizations can trigger epileptiform activity (Kramer et al 2017). We use the term cortical spreading depression (CSD) in this manuscript to describe a propagating wave of cortical depolarization that is accompanied by transient suppression of neuronal activity. CSDs contribute to the pathophysiology of several neurological diseases, including stroke (Dreier et al 2018), epilepsy (Aiba and Noebels 2015) and migraine with aura (Ayata 2010, Charles and Baca 2013) where the characteristics of the propagating wave, the duration of neuronal suppression and the degree of neural injury are determined by the local conditions of the tissue (Pietrobon and Moskowitz 2014).
Given the importance of CSDs to various neurological diseases, the development of novel technology that permits the electrophysiological detection of CSDs (both the spreading depolarization and the subsequent depression of neural activity), with high spatiotemporal resolution, and its application to studying these events in the awake brain is warranted. Experimentally, CSD is traditionally electrographically recorded using solution-filled glass micropipettes with Ag/AgCl wires, which limits the spatial resolution to just a few point measurements. Microelectrode grids improve the spatial resolution but suffer from polarization-induced drift and signal attenuation causing distortion of the measured signal (Nelson et al 2008). As an alternative to the commonly used passive electrode technology, active transducers based on transistors can offer significant advantages in electrophysiology (Khodagholy et al 2013). In particular, graphene solution-gated field-effect transistors (gSGFETs) demonstrate a comparable signal-to-noise ratio (SNR) to platinum black electrodes in typical local field potential (LFP) frequencies (Blaschke et al 2017, Hebert et al 2018). Additionally, due to excellent stability in aqueous solutions, gSGFETs offer the possibility of wide-bandwidth electrographic recordings including DC-shifts and infraslow oscillations that are superior to those recorded by passive grids of electrodes and comparable to those obtained using glass micropipettes with silver/silver-chloride electrodes (Masvidal-codina et al 2019).
Existing experimental models to induce CSD often rely upon direct chemical (potassium chloride), mechanical (pinprick), or electrical stimulation of the cortex. The CSD threshold is difficult to determine using mechanical stimulation and the above methods can all result in tissue damage and injury (Ayata 2013). Repeated trials may result in cumulative tissue damage affecting reproducibility and reliability, as well as altering thresholds required for CSD induction. Noninvasive optogenetic induction of CSD has recently been reported using transgenic expression of channelrhodopsin (Houben et al 2017, Chung et al 2019). We have adapted this approach using viral vectors to target opsin expression unilaterally in neurons of the motor cortex (MC), and establish that this approach can be used to reliably and repeatedly trigger CSD on demand in awake mice.
Therapies targeting CSD may potentially treat a range of neurological conditions. However, many drugs identified from preclinical studies result in translational failure (Ikonomidou and Turski 2002). In vivo drug discovery approaches have often been performed under anesthesia. As general anesthesia may impact on spreading depolarization frequency, propagation speed and sensitivity to pharmacological suppression (Kudo et al 2008), an in vivo, anesthesia-free assay, which permits repeated, reproducible rounds of CSD, will greatly improve the translatability of pre-clinical findings. Current evidence points to the essential role of NMDA receptors in CSD generation and propagation (Kohr 2007). Therefore, to determine the feasibility of our model as a drug screening platform we investigated the efficacy and modulation of CSD by NMDA antagonists.
To avoid confounds associated with a craniotomy required for epidural array placement, we investigated a minimally invasive approach to measure CSDs electrographically in awake rodents. We report the practicability of recording CSD through a mouse skull using gSGFET transistor arrays.
Overall, this study establishes the feasibility and advantages of applying graphene micro-transistor technology to characterize CSD induced in the awake brain as well as the repetitiveness and reliability of optogenetic CSD induction. The application of this in vivo approach in disease-relevant models, including familial hemiplegic migraine and ischemic stroke, will allow characterization of CSDs induced by the underlying pathology, the ability to trigger additional CSDs on demand, evaluate pharmacological interventions, and record localized CSD waveforms and propagation patterns in the awake brain.
2. Materials and methods
2.1. Animal preparation
Animal experiments were conducted in accordance with the United Kingdom Animal (Scientific Procedures) Act 1986, and approved by the Home Office (license PPL70-13691). C57Bl/mice (38 males and 6 females) were bred and the majority (n = 33) were used at the ages of ∼3–6 months (140.6 ± 4.65 d), while a subset (n = 11) were used at an age of ∼7–9 months (250.0 ± 7.259 d), due to the closure of the lab resulting from the Coronavirus pandemic (p = <0.001, ***; unpaired T-Test). Animals were housed on a 12 h/12 h dark/light cycle, and food and water were given ad libitum. Animals were group housed until their headbar attachment surgery and were then subsequently individually housed. For all procedures, animals were weighed before being anaesthetized in a chamber using isoflurane (100% w/w; 988-3245, Henry Schein, USA) and placed in a stereotaxic frame (David Kopf Instruments Ltd, USA). Viscotears (Bausch + Lomb, USA) were applied to each eye and both pain relief, consisting of Buprenorphine (0.5 mg kg−1; subcutaneous; Ceva, France) and Metacam (15 mg kg−1; subcutaneous; Boehringer Ingelheim, Germany) and ∼0.5 ml of saline, and dexamethasone (1 mg kg−1; subcutaneous; MSD Animal Health, USA) were given. All surgical procedures were performed using sterilized tools and aseptic techniques. At the end of the surgical procedure, warmed saline (0.15 ml/10 g) was administered subcutaneously. Mice were checked daily and recovered for at least a week before experiments commenced, with the exception of the craniotomy surgery, where recording occurred on the same day, ∼2–4 h post-surgery.
2.2. Surgeries for viral injection and headbar attachment
The skin on top of the skull was cut away. The skull was cleaned using a delicate bone scraper (10075-16; Fine Science Tools, Germany) and brief topical application of hydrogen peroxide (6%). Small bur-holes were drilled in the following two positions from bregma: (a) antero-posterior: +2.2 mm; lateral: +1.0 mm and (b) antero-posterior: +0.75 mm; lateral: +1.6 mm. To express channelrodopsin 2 (ChR2), high titer (1 × 10¹³ vg ml−1) AAV9-hSyn-ChR2-EYFP virus (AAV9_hSyn_hCHR2(H134R)-EYFP; 26973, Addgene, USA) was diluted 1:1 in 0.9% NaCl and delivered using a 5 µl syringe (Model 95 Hamilton Company, Switzerland) with a 35-gauge needle. At both sites, the needle tip was lowered from pia mater until 500 µm deep. Using a microinjection pump (WPI Ltd, USA), 500 nl was injected at 100 nl min−1 to achieve expression in both layer 5 and layer 2/3 pyramidal neurons. To apply the headbars for the Neurotar system a small hole in the skull over the left visual cortex was drilled for a metal support screw (00-96X3-32, Plastics One, USA). Using vetbond (1469SB, 3M, USA), the headplate (Model 9, Neurotar, Finland) was firmly attached and strengthened using dental cement before Kwik-cast (W.P.I., UK) covered the exposed skull. Mice were checked daily to ensure recovery. Habituation was performed by placing the mouse in the Neurotar mobile-home cage for increasing periods of time (15–60 min) over several days the week prior to craniotomy surgery.
2.3. Surgeries for craniotomy
Due to the lab closure as a result of Covid19 the amount of time cortical neurons expressed ChR2 prior to optogenetic experiments varied. Pre-Covid, the average length of time from viral injection to experiment was 59.61 ± 3.142 d, n = 33 animals, and post-Covid this was extended to 175.9 ± 2.959 d, n = 11 animals (p = <0.001, ***; unpaired T-Test). There was no difference in the intensity of light required to induce a CSD (threshold) between the two groups, 34.26 ± 7.971 mJ, n = 33 animals pre-Covid verses 33.15 ± 15.76 mJ, n = 11 animals post-Covid, (p = 0.255; Mann–Whitney unpaired T-Test).
On the day of recording, craniotomies were performed. Three areas were exposed: (a) a large (2 × 2 mm) craniotomy over somatosensory and visual cortex on the right hand side, (b) the skull was thinned or removed over the MC ipsilateral to the main craniotomy, and (c) a small drill hole over the MC on the left-hand side (contralateral to main craniotomy) (figure 1(B)). After completion, exposed dura was covered with cortex buffered saline, sterilized sylgard 184 (∼200 μm thickness), and a kwik-cast layer. After ∼2–4 h post-recovery, the animal was moved to the Neurotar frame and the craniotomies were exposed by removal of the kwickcast and sylgard.
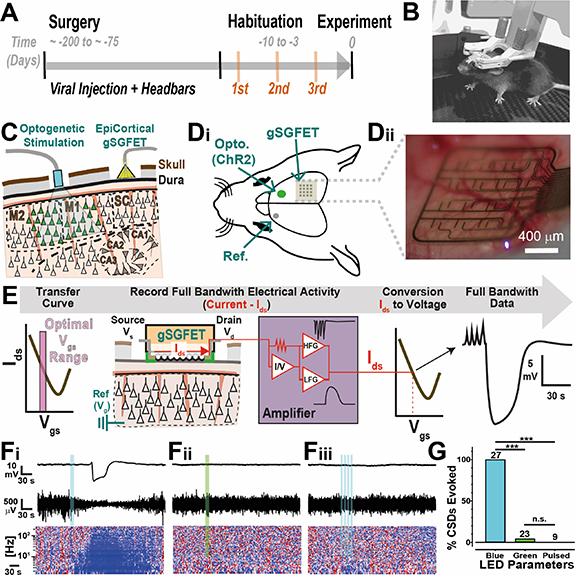
Figure 1. Description and characterization of optogenetic-induced CSD in awake head-fixed mice. (A) Timeline of the experiment, indicating the range of time for viral expression and the habituation trials (three) to the head-fixed apparatus prior to experimentation. (B) Vectorized image showing an awake mouse in the Neurotar mobile homecage head fixation system during a habituation training session. (C) Sagittal schematic of the experimental arrangement, indicating ChR2 expression in frontal motor cortex areas (M1 and M2) and the epidural positioning more posterior of a 16-channel transistor array over somatosensory cortex (SC). (Di and Dii) (Di) Top view schematic showing the ChR2 expression areas activated by optogenetic stimulation (Opto.), gSGFET placement, and the position of the reference electrode (Ref.) in the contralateral motor cortex. (Dii) Photograph of a 4 × 4, 16-channel gSGFET neural array placed epidurally over the somatosensory cortex for recordings. (E) Schematic of the recording and signal calibration process used. gSGFETs are biased in common gate mode at a Vds = 50 mV and an optimal Vgs determined from an Ids − Vgs curve measured once the array is in position during the acute in vivo experiment. Extracellular signals are recorded as current variations flowing through the graphene transistor. Recovery of the original extracellular voltage signals (black trace; full bandwidth data) is obtained by interpolation of the current signal (red) into the Ids − Vgs curve of the graphene sensor element. (Fi–iii) Representative data from one transistor showing DC-coupled (top; black), high-pass filtered 1–40 Hz (middle; black) and z-scored power spectra of 1–300 Hz (bottom) before, during and after illumination with continuous blue light (10 s) (Fi), continuous green light (10 s) (Fii), or pulsed blue light (20 Hz) (Fiii). For the z-scored power spectra plots, z-score is calculated for each frequency with respect to the before (−100 s to −10 s) LED stimulation epoch. Color scale goes from +2 (red) to −2 (blue) standard deviations. (G) Quantification and statistical comparison of evoked CSDs success in response to continuous blue light illumination (n = 27 animals), continuous green light (n = 23 animals) and pulsed blue light (n = 9 animals). Fisher's exact test was used to compare between groups.
Download figure:
Standard image High-resolution image2.4. Electrophysiological recordings
Electrophysiological recordings were performed using flexible gSGFETs arrays. The transistor arrays were carefully connected to a PCB and lowered onto the dura or skull using a micromanipulator. Whereas most currently available electrodes are passive, gSGFETs are active devices that transduce local voltage changes to current and permit a wide recording bandwidth (Masvidal-codina et al 2019). A custom g.HIamp biosignal amplifier, (g.RAPHENE, g.tec medical engineering GmbH Austria) was used for signal acquisition at 9600 kHz and 24 Bit. The system enables simultaneous recording in two frequency bands with different gains preventing amplifier saturation. Prior to recording, Ids − Vgs curves were obtained at the start and end of each experiment to allow determination of the performance of the gSGFET and custom code was used to calculate the optimal bias point (average across the arrays of the maximum of the mean absolute transconductance left from charge neutrality point). Subsequent interpolation of acquired current signals into the transfer curve results in DC-coupled voltage signals.
A reference wire (Ag/AgCl2) was placed in the contralateral MC. An LED cannula (400 µm diameter, CFM14L20, Thor Labs, NJ, USA) was lowered via a manipulator over right-hand side MC. For some experiments (n = 8), two transistor arrays were used (section 2.9, figures 8 and 9) and larger craniotomies were performed as required for the protocol.
2.5. Determination of light threshold for optogenetically-induced CSD and array calibration
Prior to experimentation the LED current-to-power relationship was calibrated using a power meter (PM16-130, Thor Labs, NJ, USA), and mW values were multiplied by the duration (seconds) of stimulation to obtain a measurement of light power in mJ. After 10 min of baseline recording, the light-threshold required to induce a CSD was determined using continuous 5 or 10 s stimulations of blue light (470 nm; M470F3, Thors Labs, NJ, USA). Controls were performed using the same power intensity and duration with a green LED (595 nm; M595F2, Thors Labs, NJ, USA) or by using pulse blue light (20 Hz, 50% duty cycle) with a combined light-on duration identical to the square pulsed light duration (5 or 10 s), (figure 1(G)).
2.6. Inclusion criteria
63 mice were prepared for this study. 44 mice (38 males, 6 females) showed reproducible induction of CSD from light stimulation and were included in this manuscript. The remaining 19 mice were excluded for the following reasons: eight animals because the initial light-evoked CSD was followed by at least one spontaneous CSD. Post-mortem analysis of these animals revealed lesions through subcortical (motor) white matter tracts, indicative of accidental damage during surgery (data not shown). Four animals were excluded as it was not possible to evoke a light induced CSD and three animals were excluded due to an inability to trigger a repeatable CSD every trial. Post hoc analysis of these brains revealed a marked reduction in transduction volume ⩽1 mm3 (figure 2). No data was obtained from four mice due to hardware or software problems during experimentation.
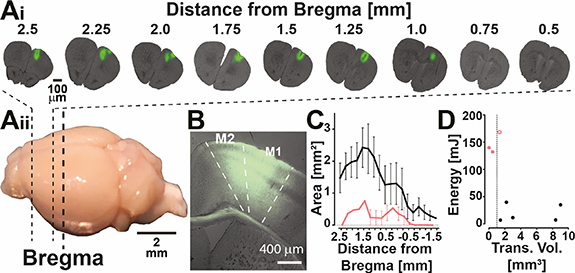
Figure 2. Representative example and quantification of AAV9-ChR2 transduction volume. Ai and Aii: (Ai) representative example of cross sections through a mouse brain expressing AAV9-hSyn-ChR2-EYFP with the distance (mm) from bregma. (Aii) Image of a mouse brain showing the approximate neuroanatomical location of the slices used for analysis in Ai. (B) Higher magnification fluorescent image showing expression of AAV9-hSyn-ChR2-EYFP in M2 and M1. (C) Quantification of area of viral transduction plotted as the average area calculated per 250 μm blocks of tissue from the front of the brain until expression decreases beyond bregma. Black line illustrates the transduction volume extracted from animals where optogenetically induced CSDs could be repeatedly and reliably evoked using low light power, n = 5 mice. The red line illustrates the transduction volume from mice where an optogenetically induced CSD was not possible n = 2, or not consistently evoked n = 1. (D) Plot between transduction volume (mm3) and energy (mJ) required (black), or tested (red) for optogenetic induction of CSDs, n = eight mice. The dashed line indicates 1 mm3. The two filled red dots represent animals with a transduction volume calculated to be less than 1 mm3 and it was not possible to induce a light-induced CSD. The open red circle represents data from an animal where an optogentically induced CSD could be evoked but not consistently, even at maximum light power.
Download figure:
Standard image High-resolution image2.7. Comparison of CSD induction methods
CSD was induced in the MC by the following three methods: (a) optogenetic (b) pinprick of a 35 gauge Nanofil injection needle (NV33BV-2, World Precision Instruments, USA) attached to a Nanofil Injection system (UMP3T-1, SMARTtouch Microinjection System, World Precision Instruments, USA) or (c) injection of 1000 nL, at a rate of 100 nl s−1, of 1M KCl into the superficial layers of the cortex (∼500 μm deep from pia; using aforementioned injection system). For this protocol, the order above was used each time, due to the trauma caused from the pinprick, which was required for the local injection of KCL.
2.8. Pharmacological screen assay
The lowest LED current found to induce a CSD twice was multiplied by 1.5 to ensure that optogenetic induction was supra-threshold throughout the experiment. The inter-induction interval was set to 10 min to allow full recovery of neuronal activity (figure 3(D)). Two baseline light-induced CSDs were followed by a randomized I.P. administration of a substance, either: vehicle (Saline; 0.5 ml), MK801 (3 mg kg−1; 10009019, Cayman Chemical, Michigan, USA), or ketamine (15 mg kg−1, Dechra, UK). A minimum of six post-injection light stimuli were delivered. Analysis of neural activity was conducted post injection of NMDA antagonists. One animal injected with ketamine showed no change post-injection in power (theta), similar to saline injected animals, and in contrast to all other animals injected with either MK801 (n = 5) and ketamine (n = 3), and was excluded from the study due to concerns that the i.p injection had failed, and the drug did not reach the brain. To check for a difference in the stimulation thresholds between treatment groups we compared the OptoThreshold and this was not significantly different between treatment groups (Vehicle, 13.18 ± 4.99 mJ; MK-801, 18.00 ± 4.99 mJ; ketamine, 4.55 ± 2.17 mJ) (p = 0.0591, Kruskal–Wallis ANOVA).
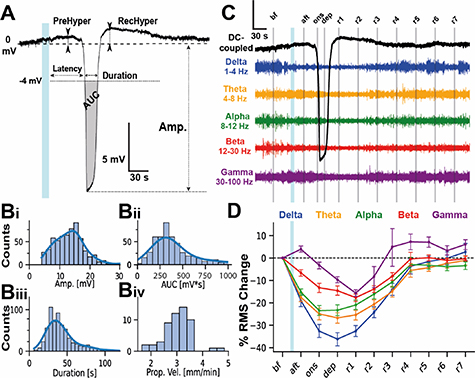
Figure 3. Waveform properties and frequency band analysis of optogenetically-induced spreading depression in awake mice. (A) Example of a CSD waveform recorded by an individual graphene transistor, highlighting the parameters extracted including duration, amplitude, latency from delivery of LED light, area under the curve (AUC), prehyperpolarization (PreHyper) and recovery hyperpolarization (RecHyper). (Bi–iv) Histograms, with a line showing the population estimate, of CSD parameters for amplitude (Bi), Area Under the Curve (Bii), duration (Biii) and propagation velocity (Biv). Bi–iii includes a total of 633 CSD waveforms recorded from 54 CSDs events (two CSD events induced in n = 27 mice), while Biv is derived from the same 54 CSD events. (C) Extracellular voltage depolarization (black line) and filtered voltage of different neural frequency bands (Delta 1–4 Hz, theta 4–8 Hz, alpha 8–12 Hz, beta 12–30 Hz, gamma 30–100 Hz) during a CSD event recorded by a gSGFET. Vertical grey lines indicate middle point of the epochs: before light stimulus (bf), immediately after (aft), at onset (ons), at maximum depolarization (dep), and every minute after the end of the depolarization (r1 − r7). The vertical scale bar y-axis is 3 mV for the DC coupled trace (black); for the other frequency bands is as follows: delta: 0.6 mV, theta: 0.4 mV, alpha: 0.2 mV; beta: 0.3 mV; gamma: 0.15 mV. (D) Average change in the frequency band root mean square (rms) voltage normalized with respect to the bf. timepoint. There is an immediate and progressive silencing for delta-theta band and an immediate increase in gamma band rms after light stimulus. Data from the same CSD events shown in panel B, grouped by mice (n = 27).
Download figure:
Standard image High-resolution image2.9. Assays using dual gSGFETs
To explore the neurophysiology at the site of induction of the CSD, experiments were performed with arrays over both the MC and somatosensory/visual cortex (n = 3; figure 8). Here, a larger craniotomy was completed over the MC to facilitate the placement of the gSGFET. Some experiments were conducted to compare recording CSD through the skull with subdural recordings (n = 5; figure 9). Here, the craniotomy for on dura placement was narrower and over the precise neuroanatomical area of interest.
2.10. Transduction volume calculations
The experiment was terminated using a sodium pentobarbital overdose (i.p. injection). Brains were removed and placed into 4% PFA (J19943.K2; Alfa Aesar, UK) chilled at 4° overnight. Coronal sections of 50 µm thickness were cut using a vibrating microtome (Leica, Wetzlar, Germany). Sections were mounted using Vectashied (2B Scientific Ltd). Tiling images were acquired using a Zeiss Axio Observer inverted widefield microscope and Zen microscope software (ZEISS), with 10× objective at 1024 × 1024 pixels resolution. All images were acquired using the same microscope parameters for analysis purposes. Cortical fluorescence distribution in coronal slices was quantified using ImageJ. The cortex was manually selected as the region of interest and an intensity threshold, consistent across animals applied. Pixels above this value were counted with total area in mm2 calculated based on pixel dimensions and magnification. Using the Allen Mouse Brain Atlas, each slice was binned based on distance from bregma. The transduced area within each slice was taken as a representation of the surrounding posterior 250 µm of tissue. The total transduction volume (mm3) was calculated as the summation of each 250 µm volume.
2.11. gSGFET arrays
Flexible epidural neural probes (10 μm in thickness) containing an array of 16 graphene micro-transistors (4 × 4 array, 400 μm separation) with active areas of either 150 × 100 μm2, 100 × 100 μm2 or 50 × 50 μm2 were used in this study. gSGFET arrays were fabricated at the clean room facilities of IMB-CNM as reported in (Masvidal-codina et al 2019). In brief, single-layer graphene was grown by chemical vapor deposition and transferred to a silicon wafer previously coated with a polyimide layer and patterned metal traces. After defining the graphene channels and before evaporating a second metal layer, UVO treatment was applied to improve the graphene-metal interface and reduce its contact resistance (Schaefer et al 2020). Finally, SU-8 was used as passivation layer and the polyimide layer was etched to define the geometry of the neural probes. Devices were gently peeled off from the wafer and inserted to zero insertion force connectors for electronic interfacing.
2.12. Data analysis
Recorded signals were analyzed using Python 3.7 packages (Matplotlib 3.2.0, Numpy 1.17.4, Pandas 0.25.3, Seaborn 0.9.0, Neo 0.8.0) and the custom library PhyREC (PhyREC4, https://github.com/aguimera/PhyREC). Transistor recordings were calibrated by interpolating the current signals into the corresponding branch of the in vivo measured transfer curve as reported by Masvidal-codina et al (2019). For two experiments the signal interpolation to the transfer curve was not possible due to insufficient measured voltage range or presence of artifacts, for these experiments the gain at the Vgs bias point of the transfer curve for each transistor was used. No high pass filtering is applied to the recorded extracellular potentials for the analysis of CSD waveforms, extraction of CSD parameters or plotting to avoid any signal distortion. Error bars in all plots represent standard error.
2.13. CSD parameter extraction
For each CSD extracellular voltage shift the following parameters were extracted: latency, peak amplitude, duration and area under the curve (AUC). Raw signals were down sampled to 3 Hz and zero voltage was set to the average value of the 5 s before the light stimulus. We defined the onset of the CSD as the onset of the negative shift with a threshold at −4 mV. Latency was calculated as the difference between the starting stimulation time and CSD onset. Peak amplitude was defined as the minimum value of the wave and reported as an absolute value. CSD duration was defined as the time that the extracellular voltage remained below −4 mV; it was determined using below and above thresholds. AUC was defined as the area below zero voltage during the duration of the depolarization determined. CSD propagation speed was estimated as the distance between the LED induction site and the middle of the transistor array (4 mm) divided by the mean latency CSD onset. Code available upon request.
2.14. CSD wave propagation direction
To determine the direction of propagation, a vector pointing from the lowest to highest latency values in the transistor array matrix was used. A threshold of 2.5 standard deviations from the mean of the latencies was set to remove outliers that could distort the direction of propagation. The angles between the propagation vector of the first induced CSD and the subsequent ones was determined by  , where x and y are the two vectors.
2.15. CSD band analysis
For each CSD extracellular voltage shift, the calibrated raw signals were either not filtered for full-band or bandpass filtered for the different bands (delta: 1–4 Hz, theta: 4–8 Hz, alpha: 8–12 Hz, beta: 12–30 Hz and gamma: 30–100 Hz). Then, the root mean squared (RMS) was calculated using a sliding window (window_size: 0.5 s, steptime = window_size/10) and resulting traces were passed through a median filter (scipy.signal.medfilt) to remove artefacts. RMS values for each band were averaged at given epochs with respect to the LED stimulation (referred to as 0 s), the depolarization onset (t_onset, defined as the time extracellular voltage goes below −4 mV of the raw signal) and the depolarization end (t_end, defined as the time the extracellular voltage crossed again the −4 mV). The epochs are: before the LED stimulus (bf.: −100 s to −10 s), a few seconds after (aft.: 0 s to t_onset − 10 s), depolarization onset (onset: t_onset − 10 s to t_onset + 10 s), depolarization (dep.: t_onset + 10 s to t_end) and recovery 1–7 being every minute after the end of the depolarization (r1: t_end to t_end + 60 s; r2: t_end + 60 s to t_end + 120 s, etc). To evaluate the neural effects of CSD, RMS power values where normalized with respect to the bf. timepoint. Values for each transistor in the array over multiple CSD events were averaged to yield a single value for each experiment.
2.16. CSD shape clustering
To classify the different shapes of the depolarization waves, raw signals were resampled at 10 Hz. Signals from −30 to 400 s around each light-stimulus were extracted and zero voltage was set to the average value of the 30 s before the light stimulus. A threshold of −4 mV was used for CSD detection. Then, all detected waves were time aligned to the minimum of the (first) depolarization peak (0 s) and epochs from −50 to 140 s extracted. Depolarization voltage is defined as the mean voltage value between −1 and 1 s. Then, three features where selected to perform the clustering: integral of the prehyperpolarization (area >0 mV in the −15 s to 0 s), integral of recovery hyperpolarization (area >0 mV in the 0s to 75 s) and the second to first peak amplitude ratio. The second peak was detected during the 100 s after the first peak by finding the valley (with the minimum of the first derivative) and then searching from the minimum of voltage after the valley. Based on these three features waveforms were clustered by defining a threshold for each group: first they were classified as DP (second to first peak amplitude ratio >0) or SP. Then DPh (PreHyper >1); DP (PreHyper <1); SPh (RecHyper >1) and others were classified as SP, LV if amplitude was lower than −6 mV or ND if a depolarization was not detected at that channel.
2.17. Statistical analysis and experimental design
In these studies, the variable of interest was isolated and statistically examined. In general, for comparisons between groups of two, unpaired or paired T-tests were used, while for three or more groups, ANOVA with post hoc corrections were utilized. To examine the frequency of evoked CSDs for different optogenetic stimulations (figure 1), since the same animals were used in a non-randomized fashion for each modality, Fisher's exact test was used to compare between groups. For comparing the parameters of CSDs to different modalities (figure 4), each animal, either male or female, was given the same sequential treatment (due to the nature of induction methods), with at least a single CSD being evoked to each modality. With this data collected, a one-way ANOVA was run to compare between (a) genders, and (b) groups. As genders showed no differences between induction using either optogenetics, pin-prick from a needle, or injection of KCl, the data from each gender was combined to allow for a more informed comparison between modality types. Examining the change in normalized frequency bands between the different CSD shapes (figure 5) utilized the two-way repeated measures ANOVA with Sidak's post-hoc comparisons for both (a) sub-types and (b) combined sub-types. For the pharmacological study (figure 7) parameters (Amplitude), a two-way repeated measures ANOVA was used with Sidak post-hoc comparisons. Examining the time response profile for recording at the site of induction also utilized a two-way repeated measures ANOVA with Sidak's post-hoc test to examine the differences between responses over the 10 s of optogenetic stimulation and up until recovery of the voltage. To examine electrophysiological recordings between epidural and skull positioning of the gSGFET, the two arrays were placed and optogenetic stimulation was applied in the MC (figure 9). As the CSD propagated across the brain, it was recorded at both sites. SNR was calculated as the ratio of the peak CSD amplitude to the standard deviation of the 30 s prior to CSD induction. To compare the SNR, an artificial SNR level was set to 3, with slight variation around this, and then a one-way ANOVA with Tukey's post-hoc test was used to compare this regularly used artificial SNR level to the SNR from epidural and skull gGFET recordings. Next, for other parameters such as amplitude, AUC, and propagation velocity (pro. vel.), Welch's, unpaired, T tests were used to examine whether there were differences between recording sites. Finally, two-way ANOVA was used to compare normalized frequency band activity at the two recording sites. Throughout the manuscript standard significance classifications were used (* = p < 0.05; ** = p < 0.01; *** = p < 0.001).
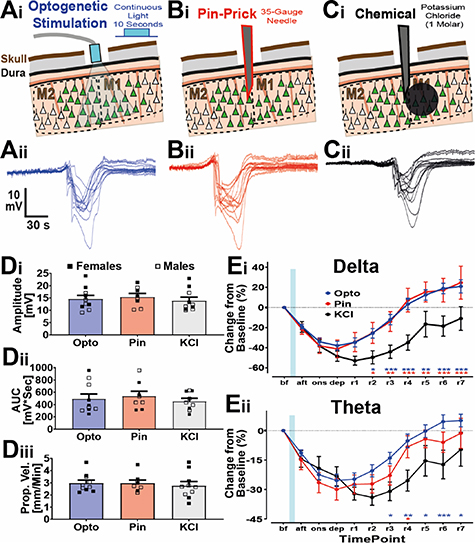
Figure 4. Electrophysiological comparison of gender and method of induction for CSD in awake mice. (A)–(C) Schematics (i) and raw traces (ii) showing CSDs induced using different modalities: optogenetic (A), pinprick (B), or potassium chloride (1 μl at 1 M) injection (C). The traces come from the same animal. (D) Comparison of the amplitude (Di), AUC (Dii), and propagation velocity (Diii) of CSD from induction by opto (blue), pinprick (red) and KCl (grey) and, also, gender with females (closed squares) and males (open squares). No statistical difference was found between genders, or between waveform characteristics of CSDs induced by different methods. (E) Normalized, to the before CSD timepoint, rms band changes during CSD for the delta (Ei) and theta (Eii) frequency bands displayed. n = five male and five females for opto and KCl, and four male and four females for pinprick. F or E, statistics used a mixed-model effects analysis with Sidak's post-hoc tests. Asterisk are color-coded depending on the CSD-induction type that is compared against KCl.
Download figure:
Standard image High-resolution image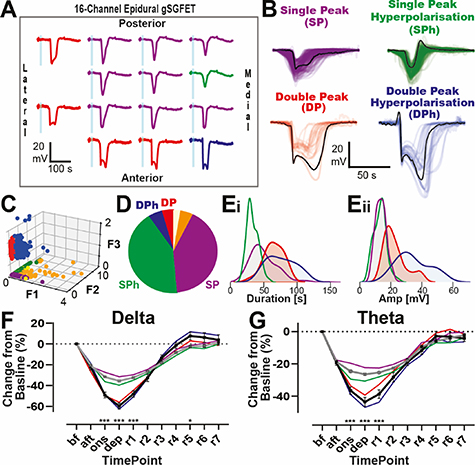
Figure 5. Classification of distinct CSD waveforms recorded using 16-channel gSGFETs as CSD propagates through cortex. (A) 14-channels from a gSGFET array recording an optogenetically induced CSD. Different waveforms can be observed across the grid. These can be categorized into four clusters (panel B) and color-coded. (B) CSD waveforms for each of the four clusters DP (red), DPh (blue), SPh (green), SP (purple). DP = double-peak; SP: single-peak, h = hyperpolarization. Bold lines in black highlight an example case for each group. (C) 3D scatterplot of the three features used for clustering (F1: prehyperpolarization, F2: recovery posthyperpolarization and F3: second to first peak ratio). Dots are colored to indicate the clusters, as described in B, with orange showing low voltage (<−6 mV). (D) Pie chart showing the frequency of the four different clusters, with colors the same as in B and C. Orange indicates the percentage of nondetectable waveforms. (Ei and Eii) Density plots of the distribution of duration (i) and amplitude (ii) extracted from the waveforms for each cluster. (F) and (G) Rms changes, normalized to baseline, during CSD in the delta (F) and theta (G) frequency bands. All four CSD types are graphed, with grey lines showing combined single and black line combined double peaks. ANOVA with Sidak's post hoc tests were performed.
Download figure:
Standard image High-resolution image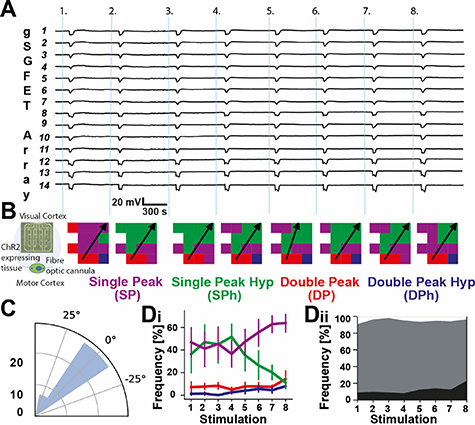
Figure 6. Reproducible and stable CSDs recorded using 16-channel gSGFETs in response to repetitive optogenetic induction. (A) DC-coupled recordings of 14 individual transistors in an array showing reliable, repetitive induction of CSDs triggered by blue light illumination over a ∼100 min recording session, with eight CSD inductions, indicated by the light blue bars. (B) Left: schematic indicating the array and fiber optic canula location. CSDs propagated from the motor cortex towards the visual cortex. Color-coded spatial map of the 16-channel gSGFET array based on CSD waveform at each transistor location. Arrow indicates CSD propagation direction. The angular variability of propagation varied little between repetitive induction of CSD. (C) Polar histogram of CSD wave propagation direction, n = 48 CSDs, from six mice. (Di) Mean frequency of CSD shapes recorded by individual channels. Although there was an increase in SP and a decrease in SPh (purple and green lines respectively), the ratio of single to double peak CSDs varied little during eight repetitions. (Dii) Combining the single (grey) and double (black) peaks. White area indicates the percentage of channels that did not record CSD waveforms.
Download figure:
Standard image High-resolution image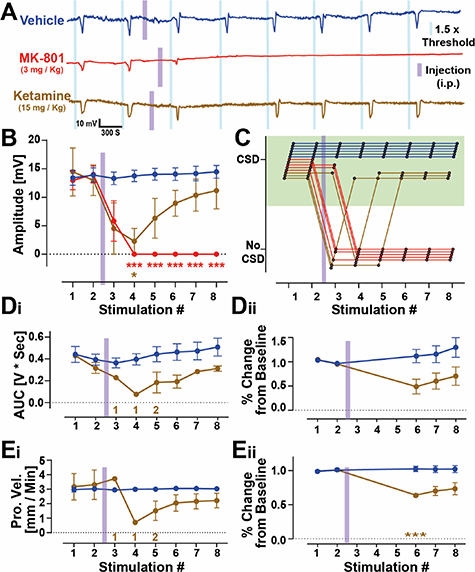
Figure 7. Pharmacological sensitivity of optogenetically induced CSD to NMDA antagonists. (A) Representative DC-coupled recordings from a single transistor from an animal injected with either saline (blue), MK-801 (red) or ketamine (brown). The blue and magenta bars indicate the time of light stimulus and i.p. injection, respectively. (B) Peak amplitude of CSDs from repetitive induction of CSDs in the presence of vehicle, MK-801 and ketamine. n (mice) = six vehicle, five MK-801, and three ketamine. Absence of CSD was considered as 0 mV amplitude. (C) Binary visualization of the presence or absence of CSDs at each experimental timepoint showing the variability in the time and duration of the effects. Each line indicates an experiment and is color-coded by treatment. (D) and (E) (i) Using only datapoints and treatment groups where a CSD was present, a graphical representation of area under the curve (D) and propagation velocity (E) for vehicle and ketamine. For ketamine, stimulations 3, 4 and 5 did not induce CSDs in all animals in this group and so the n numbers for successful CSD induction are indicated underneath the data, in brown. (ii) Datapoints for AUC and propagation velocity when CSD could be detected in all animals (timepoints 6,7 and 8) were analyzed by normalization to the average of pre-drug tests (stimulations 1 and 2) to illustrate that although CSDs had returned, they propagated slower and did not recover pre-injection parameters within the time course of this experiment (55 min post drug injection). Statistics. Two-way repeated measures ANOVA with Sidak's post hoc tests to examine differences between specific stimulations.
Download figure:
Standard image High-resolution image3. Results
3.1. Optogenetic CSD model in awake head-fixed mice
The experimental paradigm for triggering light-induced CSDs in awake mice is illustrated in figure 1(A). Surgery was performed to inject viral vector to transduce neurons in the MC and express light-sensitive channelrhodopsin (ChR2) (see section 2, figure 2). Head bars were attached and in the week prior to experimentation mice were habituated to the head-fixation apparatus over several days (figure 1(B)). To detect CSD, a 16-channel gSGFET was placed on the dura over the somatosensory and visual cortex posterior to the ChR2-injected area (illustrated in figures 1(C) and (D)). Before recording, a transfer curve is obtained that is used to determine the optimal recording settings and also for post-recording current-to-voltage conversion (figure 1(E) and section 2).
Continuous 488 nm blue light illumination (5–10 s) reliably induced CSD (figure 1(Fi)). Note the correlated activity suppression shown in the high-pass filtered signal and in the corresponding z-scored spectrogram. To examine the specificity of light wavelength and stimulation parameters we used a green LED 594 nm (figure 1(Fii)) with the same light duration and power intensity that successfully evoked a CSD with blue light, or used pulsed blue light (20 Hz) with a total light-on duration identical to the square pulsed light duration (figure 1(Fiii)). Whereas constant blue light illumination always evoked a CSD, pulsed blue light or continuous green light rarely evoked a CSD (figure 1(G)). This indicates that a sustained neuronal depolarization, caused by a single, seconds-long square pulse stimulation with blue light in ChR2-expressing areas is an effective and robust mechanism of CSD induction.
Examination of viral transduction volume post hoc revealed that expression of cortical tissue, greater than 1 mm3, was required to express ChR2 to reliably induce CSD optogenetically (figure 2). Viral injections were variable in the total volume of tissue transduced (5.46 ± 1.7 mm3 n = five animals) but consistently transduced the area of MC from +0.5 to +2.5 mm (anteroposterior coordinates relative to bregma) where the optic fiber light was positioned during experiments. The light intensity required to trigger a CSD ranged 5.89–147.6 mJ, with mean of 33.98 ± 7.065 mJ (n = 44 animals).
CSD parameters were extracted from individual micro-transistors (figure 3(A)). High amplitude (14 ± 0.3 mV) negative shifts in the recorded extracellular voltage lasting tens of seconds (46.0 ± 1.2 s) in duration were recorded. Data corresponding to 633 CSD waveforms recorded from a total of 54 CSDs (2 CSDs evoked in each of 27 animals). However, as the histograms indicate (figure 3(B)), there was a large degree of variability in these parameters, the 25%–75% range for amplitude and duration were 9.8–16.4 mV, and 28.9–50.2 s respectively. This variability reflects the heterogeneity in CSD waveforms recorded (see figure 5). In contrast, propagation speed was more consistent, 3.0 ± 0.1 mm min−1 (2.8–3.3 mm min−1, 25%–75% range). Light-evoked CSDs in the MC also induced transient changes in LFP activity. For these experiments we recorded CSDs in areas of propagation, somatosensory and visual cortex (figures 1(C) and (D)). Within seconds of light stimulation, a gradual decrease in 1–30 Hz RMS power could be detected, minutes before the actual CSD invaded the area of the brain underneath the transistors. In contrast, gamma RMS power (30–100 Hz) increased just prior to CSD invasion, indicative of intense neuronal firing preceding the massive depolarization and subsequent neuronal silencing (figures 3(C) and (D)) similar to an increase in multi-unit activity previously reported (Houben et al 2017). The rate of recovery of neuronal activity post CSD were similar for frequencies 1–30 Hz with full recovery evident 4 min after the end of the DC-shift. In some recordings there was a prominent increase in gamma RMS power 30–100 Hz upon recovery, indicative of rebound excitation (figures 3(D) and 5(D)).
3.2. Comparison with more invasive CSD induction methodologies
The electrophysiological features of optogenetically-induced CSDs in virally-injected mice were compared to standard induction methodologies including direct application of KCl to the brain and pinprick in the same animal (figures 4(A)–(C)). CSD waveform parameters (i.e. peak amplitude, duration and AUC values were not statistically different between CSD induction types, nor between male and female mice. These values (figure 4(D)) are within previously reported ranges for KCl-induced CSDs in non-virally-injected, wild-type mice (Eikermann-Haerter et al 2015). However, although there is no difference in the duration or AUC of CSDs between groups, we did observe a difference in the time taken for activity suppression in frequencies above 1 Hz to fully recover (figure 4(E)). Compared to optogenetic- and pinprick-induced CSDs, recovery from KCl-mediated CSD was significantly slower (figure 4(E)).
3.3. CSD waveform analysis
Due to the mapping capabilities of the gSGFET arrays, we observed variability in CSD amplitudes and duration (figure 3(B)), resulting from distinct waveform patterns. Figure 5(A) displays the CSD waveform captured by 14 individual transistors as a CSD propagated over the array. Some waveforms have a single peak, whereas others present a double peak. An additional feature is the presence of either a pre- or post-CSD hyperpolarization. We obtained a database of 2323 CSDs waveforms recorded from 224 optogenetically-induced CSD events from 26 mice. We analyzed three waveform features pre-hyperpolarization (F1), recovery post-hyperpolarization (F2) and second-to-first peak amplitude ratio (F3) to classify the recorded waveforms into 4 different clusters: DP (double-peak), DPh (double-peak hyperpolarization), SPh (single-peak), SPh (single-peak hyperpolarization) and a 5th category where the CSD was of low amplitude (<6 mV peak), (figures 5(B)–(E) and section 2). The high channel number and low-invasive induction methodology of our preparation allowed us to study the occurrence and spatial distribution of each waveform. Under our recording conditions, using 'normal', non-disease model mice, single peak accounted for 84% of waveforms split similarly between SP and SPh (42% each). DP and DPh were less common (10%), 5% each. Double peak waveforms (DP and DPh) had a higher duration and amplitude than single peak waveforms (SP, SPh) (figure 5(E)) and interestingly, also a faster rate of depolarization (data not shown). DPh was the cluster with the highest values in all parameters tested. We performed frequency band analysis on the waveform types and observed that double peak waveforms caused a higher percentage of activity suppression compared to single peak waveforms (figures 5(F)–(G)). The arrays were predominately placed in areas of propagation. In these locations no spatial distributional trends across the grid for specific waveforms were identified.
We examined the reproducibility of repeated optogenetic stimulation (figure 6(A)). Separation between light stimulations was set to 10 min to allow recovery from transient silencing of neural activity (figure 3(D)). Figure 6(A) displays 14 transistor recordings from one animal in response to eight optogenetic stimulations. In contrast to AC-coupled, or DC-coupled passive electrodes which encounter baseline drift and require either high-pass filtering or electronic off-set readjustments (Nelson et al 2008, Nasretdinov et al 2017), gSGFETs are able to record repeated rounds of CSD over several hours with minimal baseline drift (0.16 ± 0.9 mV/10 min, n = six animals), highlighting the superiority of this methodology for long (hours) continuous recordings (figure 6(A)). We analyzed the propagation patterns of CSD across the transistor array (figure 6(B)), and categorized the CSD waveform recorded from each transistor for repeated trials. Overall CSD waveform remained stable with roughly the same percentage of events classified as single peak and double peak, although SPh waveforms decreased and SP waveforms increased during repeated stimulations (figure 6(D)), and there was a trend towards more double peaks by stimulation 7 and 8. Figure 6(C) shows an angular histogram of the difference between the propagation direction of any CSD and the direction of the first induced CSD of that experiment. Results indicate very small changes in the propagation angle over repeated optogenetic stimulations.
3.4. Pharmacological suppression of CSD in awake mice
To test the effect of drugs capable of suppressing or modulating CSDs we increased the light stimulus to 1.5 times the threshold, OptoThreshold, to ensure supra-threshold stimulation across the experiment duration. The protocol consists of two CSD inductions prior to intraperitoneal systemic injection of vehicle or drug followed by an additional six supra-threshold stimulations post-drug (figure 7(A)). In this study, we evaluated the efficacy of two NMDA receptor antagonists. A representative trace of the recorded signal corresponding to one transistor of the 16-channel array is shown for an animal in the saline, MK-801 and ketamine groups (figure 7(A)). To validate the methodology for testing drug effects we used MK-801, a well reported CSD-inhibitor (Chung et al 2019). Intraperitoneal (i.p.) injection of 3 mg kg−1 MK-801 produced rapid (<10 min) suppression of CSDs that did not appear in any of the subsequent light stimulations (n = 5). MK-801 cannot be used therapeutically due to a number of serious adverse side-effects, so we next turned our attention to a potentially more clinically relevant NMDA antagonist, ketamine. Rodent studies indicate that ketamine can reduce the amplitude of CSDs (Krüger et al 1999), or block CSD induction completely (Hernándéz-cáceres et al 1987, Rashidy-pour et al 1995). The effects are however transient, lasting 20–45 min after a single injection. An effect we also observed in our studies (figure 7); complete inhibition only lasted 15–25 min post-injection, although the CSD amplitude and AUC was smaller (figures 7(B) and (D)) and propagation was slower (figure 7(E)) for the remaining trials compared to pre-drug values.
3.5. Investigation of CSD induction
To examine whether MK-801 and ketamine prevented induction, as well as propagation of CSDs, we modified the experimental protocol and used two epidural arrays; one at the site of LED illumination (gFET#1), motor cortex, and the other, (gFET#2), over somatosensory/visual cortex (figure 8(A)). LED illumination of the ChR2 expressing area resulted in an immediate depolarization, most prominently on the top-left corner of the transistor array (gFET#1). This immediate depolarization is not seen in gFET#2, ∼3 mm away from the illumination site (figures 8(B) and (C)). CSDs induced in the MC propagated and were detected later by the second transistor array gFET#2. After administration of MK-801 (3 mg kg−1, n = 2), or ketamine (15 mg kg−1, n = 1), no CSD was detected at gFET#2 in accordance with the single-transistor array experiments (figure 7); while at the induction site (MC) a neuronal depolarization can still be observed (figure 8(D)). Light stimulation results in a time-locked depolarization of ∼5 mV, which then transitions into a larger amplitude depolarization and full CSD (figure 8(D)). In contrast, after administration of MK-801 or ketamine the initial light-induced depolarization returns quickly post-light stimulus to baseline values without induction of a CSD (figure 8(E)).
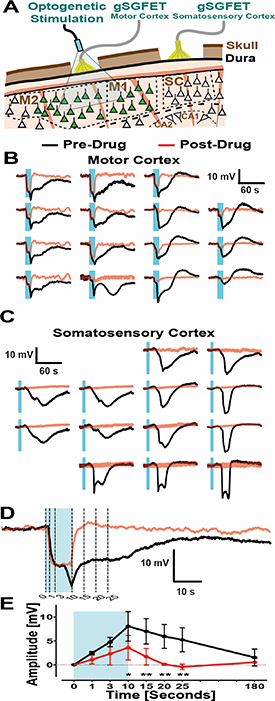
Figure 8. NMDA receptor antagonism blocks CSD induction and propagation. (A) Cross sectional schematic showing the positioning of both epidural gSGFETs, over either the motor or somatosensory cortex, and the LED fiber optic for optogenetic activation of ChR2-expressing neurons (green). (B) and (C) Waveforms recorded by the two epidural arrays for an example CSD event with electrophysiological traces both before (black) and after (red) i.p. injection with MK-801 (3 mg kg−1; NMDA receptor antagonist). In this example, the LED stimulus was located top-left of motor cortex array. (D) The top-left channel of the gSGFET over the motor cortex, showing the light-induced neuronal depolarization before and after administration of MK-801 with dashed lines indicating the timepoints (0, 1, 3, 10, 15, 20, 25 s from LED onset) used for analysis. (E) Absolute amplitudes taken from the listed timepoints from the onset of LED stimulation (0, 1, 3, 10, 15, 20, 25 s) and grouped by before and after drug. n numbers consisted of combined data from NMDA receptor antagonists that inhibited CSDs in the somatosensory cortex (MK-801 at 3 mg kg−1 (n = two mice) and ketamine at 15 mg kg−1 (n = one mouse)). Statistics. two-way repeated measures ANOVA with Sidak's post hoc tests to examine differences at specific time points.
Download figure:
Standard image High-resolution image3.6. Through-skull detection of CSD
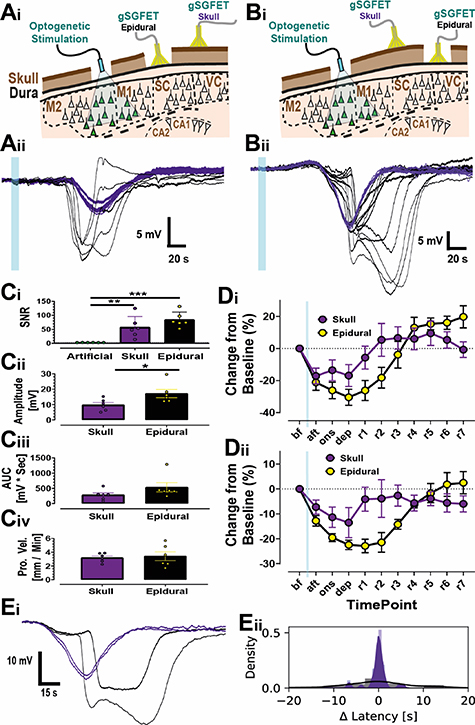
Finally, we investigated the possibility of recording CSDs electrographically through an intact skull. To do this and to quantify our results with epidural placement of arrays, we utilized two gSGFET arrays in a single experiment, one placed over the motor/somatosensory cortex, and the other over the ipsilateral somatosensory/visual cortex and optogenetically-induced CSDs (figure 9(A)). One of the arrays was placed epidurally and the other on top of the skull. There is a reduction in spatiotemporal properties of recorded CSDs across the array (figure 9(Eii)). The resolution in propagation and CSD waveform across and between individual transistors achieved by subdural placement of the gSGFET is lost. There is also a reduction in amplitude of the detected CSDs when recording through bone (epidural was 17.14 ± 2.66 mV, through skull was 9.75 ± 1.57 mV; n = six animals; p = 0.0436, Welch's unpaired T-Test) (figure 9(Cii)). However, CSDs can be detected through the skull travelling at a propagation velocity of 3.198 ± 0.265 mm min−1 (figure 9(Civ)). Additionally, we could detect suppression of higher frequency (1–30 Hz) rms amplitude correlated with the CSD, although this suppression recovered faster compared to epidural recordings (figure 9(D)). In order to exclude potential electrical paths through burr holes and craniotomies, we performed non-invasive optogenetic induction and recording of CSD (supplementary figure 1 (available online at stacks.iop.org/JNE/18/055002/mmedia)). These experiments demonstrate that CSDs can be electrographically recorded through a completely intact mouse skull using gSGFETs.
Figure 9. Comparing recordings of Optogenetically induced CSD through the dura and the skull. (A) and (B) cross-sectional schematics showing the positioning of two gSGFETs, either over the dura and skull (Ai) or skull and then dura (Bi). Beneath each are representative recordings over the dura and skull (Aii) or skull and dura (Bii), with colours to indicate recording position: skull (purple) and epidural (black). (C) Quantification of SNR (Ci), amplitude (Cii), AUC (Ciii) and propagation velocity (Civ) for data recorded through skull and dura. For SNR (i), the artificial level was set to 3, with s.d. of ±0.1871, and then statistics (one-way ANOVA, with Tukey's post-hoc tests). For amplitude, AUC, and propagation velocity (ii–iv), statistics were performed using unpaired T-Tests. n (mice) = 6. (D) Quantification of normalized rms of delta (Di) and theta (Dii) frequency bands for both skull (purple) and dura (black) recordings. (E) Select channels, positioned furthest apart on the gSGFET array showing electrophysiological full bandwidth traces (i) for skull (purple) and dura (black). Note the loss of spatiotemporal resolution in skull recordings compared to epidural recordings depicted as the histogram and population estimate (line) of the latency dispersion around the mean latency in an array (ii), data from six optogenetic CSDs (one CSD from six different mice).
Download figure:
Standard image High-resolution image
4. Discussion
A difficulty with studying CSDs, either independently or concurrently with higher frequency activity, is the lack of appropriate tools to record them in vivo with high spatiotemporal fidelity, and to reliably, on-demand, induce CSDs in a minimally invasive manner. Although cerebral blood flow techniques can be a useful complementary method capable of recording the downstream effects of CSD on blood flow; the gold standard for CSD detection requires electrophysiological methods (Ayata 2013), usually recorded using solution-filled glass pipettes with Ag/AgCl2 wires. These are not practical for chronic recordings, nor for high-density mapping of CSDs. Using passive electrodes, even with the use of DC-coupled amplifiers is sub-optimal (Fabricius et al 2008). In contrast, gSGFETs are active devices that dynamically transduce LFP changes into current (Blaschke et al 2017, Hebert et al 2018) allowing multisite DC-coupled electrophysiological recordings with negligible baseline drift (Masvidal-codina et al 2019), see figure 6(A). Experimental models of CSD often employ highly invasive mechanisms to induce a CSD resulting in tissue damage, problems with reproducibility, and therefore limited translational value. Recently transgenic mice expressing ChR2 under the Thy-1 promoter have been used to non-invasively induce CSD optogenetically via depolarization of predominately layer 5 excitatory neurons in the cortex (Houben et al 2017, Chung et al 2019, Takizawa et al 2020), and have been used to evaluate the CSD threshold in ischemic stroke (Sugimoto et al 2020). We have built on this approach by using a viral vector-mediated method. We used the human synapsin (hSyn) promotor to drive expression in excitatory and inhibitory neurons in all cortical layers (Nathanson et al 2009), using a modified version of channelrhodopsin with a point mutation (H134R) which generates larger photocurrents (Nagel et al 2005) to maximize neuronal depolarization. By combining these methodologies, we have developed an awake head-fixed mouse preparation that facilitates preclinical CSD research. The reproducibility of optogenetic induction and the enhanced fidelity of micro-transistor recordings permits high density mapping of CSD induction and propagation, examination and categorization of CSD waveform, and the ability to monitor neuronal activity responses across physiologically relevant frequencies.
We used a fiber optic cannula to deliver diffused blue (488 nm) light and determined that a volume of tissue expressing ChR2 greater than 1 mm3 (figure 2) was required to reliably induce a CSD. A single continuous (5–10 s) light stimulation was more effective than trains of brief depolarizations with matched total light duration (figure 1), presumably as a result of efficient inter-pulse extracellular potassium buffering mechanisms and relaxation of neuronal depolarization block. As modeling studies indicate that a rise of extracellular potassium above 10–12 mM within a restricted area of cortex (>1 mm3) in rodents is required for CSD induction (Matsuura and Bures 1971), we hypothesize that a single continuous (5–10 s) light stimulation increases extracellular potassium sufficiently to trigger a CSD. Future experiments using potassium sensitive electrodes can be used to investigate this hypothesis.
Spreading depolarization-induced spreading depression is mechanistically explained by the fact that the sustained depolarization exceeds the inactivation threshold for the action potential generating channels (Kager et al 2002). The depression of activity typically outlasts the neuronal depolarization suggesting that it is maintained by other mechanisms that affect synaptic function. We have quantified that depression outlasts depolarization by around 4 min in epidural recordings in normoxic awake brain (figure 3(D)). We recorded >2000 CSD waveforms and categorized these into distinct clusters based on certain parameters including single or double peak and the presence or absence of a pre-event hyperpolarization. Despite individual transistors being close to each other (400 μm), we were able to detect local changes in CSD waveform across the cortex. These waveforms were stable during repeated rounds of induction (figure 6). The ability to record specific CSD waveforms from localized areas of cortex highlights the advantage of spatial mapping using DC-coupled micro-transistors. The shape of a CSD is thought to reflect a number of ionic processes including activation of persistent sodium channels, NMDA receptors and extracellular potassium diffusion (Kager et al 2002, Tuttle et al 2019). Double peaks are thought to represent enhanced NMDA receptor activation (Krüger et al 1999). In our study, using naïve mice, double peaks were rare, (∼10%) (figure 5). The ability to record multiple CSD waveforms with high-fidelity using gSGFETs could be used in collaboration with modeling approaches to investigate predominate ionic contributions to CSD waveform under certain disease states. This technology could also allow real-time evaluation of underlying brain health. Spreading depolarisation properties, i.e. waveform shape and duration, could be used to infer the boundaries between metabolically challenged and/or dying tissue from uncompromised areas. A change from single to double peak CSD waveform with a concurrent increased duration of neuronal depression, or indeed a switch to post-SD hyperexcitability, could be used to tract infarct or lesion progression.
In contrast to results reported in transgenic Thy-1-ChR2 mice (Houben et al 2017), we did not observe a large change in the threshold required to illicit CSDs during repetitive rounds of induction. Although there could be heterogeneity in waveform shape across the array, CSD waveform parameters were stable, and changed little during repeated CSD inductions (figure 6). In contrast to a metabolically compromised brain where SDs are believed to spiral around the edge of an ischemic core (Nakamura et al 2010, von Bornstadt et al 2015), CSDs in non-ischemic tissue are thought to propagate radially across the brain (Shibata and Bures 1972). Our results confirm that in normoxic awake mice, optogenetic-induced CSDs behave as non-recurrent propagating waves with a preferred direction that is preserved for repeated stimulations (figure 6(E)). These results are in accordance with the small CSD propagation variability measured by imaging methods in anesthetized mice (Donmez-Demir et al 2020).
The majority of published pharmacological studies have investigated whether a compound reduces CSD frequency, typically in response to topical application of KCl. Few studies report an effect on CSD threshold, amplitude or waveform characteristics as these can only reliably be investigated in vivo when CSD is induced electrically or optogenetically and detected using electrophysiological methods. The stability, reproducibility and consistent CSD threshold during repeated trials in a single recording session, and the ability to conduct experiments in awake rodents, extenuating any confounders due to anesthesia (Kitahara et al 2001) make optogenetic-induction coupled with gSGFET array recording an advantageous model to conduct pharmacological perturbation studies. We performed experiments in awake brain and focused on NMDA receptor antagonists as a proof-of-principle to evaluate the in vivo drug-screening platform. Our results confirm previous reports that MK-801 and ketamine can reliably inhibit the induction of CSD (Klass et al 2018). Extrapolation of the pharmacological results obtained in healthy animals has to be taken cautiously, particularly in regard to severe diseases such as traumatic brain injury or stroke where energy failure plays an important role in CSD pathogenesis. Although ketamine can be used to inhibit spreading depolarizations in severe brain injury (Carlson et al 2018), studies indicate that NMDA receptor antagonists effective under normoxic brain conditions are considerably less effective in tissue modeled to reflect brain trauma by artificially raising baseline potassium concentration (Petzold et al 2005). The precise relationship between CSD and the extent of the pathology in ischemic stroke, migraine, and epilepsy, is still poorly understood. Future studies will benefit from the versatility that this in vivo assay offers, including viral delivery of opsins to discreet brain regions and awake recordings. Implementation of this methodological approach in disease relevant preclinical models, including transgenic migraine mice (Loonen et al 2019) or ischemic stroke (von Bornstadt et al 2015) will permit selection of agents with enhanced translational value. While patients with severe brain trauma require sedation, the vast majority of CSDs will occur in awake, unanaesthetized brains, and result in lower quality of life for patients suffering migraines and epilepsy. Therefore results obtained in awake brain will have enhanced mechanistic and clinical relevance. Indeed, studies inducing ischemic stroke in awake brain demonstrate how anesthesia reduces not only the extent of ischemic damage after stroke, but also masks the protective effects of a stroke therapy (Seto et al 2014).
In this study we demonstrate the usefulness of our methodological approach to investigate mechanisms of CSD induction by directly confirming the importance of NMDA receptor activation for CSD initiation (figure 8). Similar approaches could be employed to investigate the roles of persistent sodium channels and extracellular potassium to CSD initiation in the normoxic brain, as well as in specific disease states. Although we focused in this study on short (5–10 s) continuous light stimulation to evoke CSDs, as this was most efficient (figure 1), our approach could be used to investigate how more physiological/pathophysiological firing patterns in distinct sets of neurons could result in CSD induction. The flexibility of a viral vector approach permits cell-type specific promotors to be used in future studies, as well as the ability to optogenetically induce CSD in mouse models of neurological disease while mitigating expenses resulting from maintaining and/or crossing multiple transgenic lines, and thus reducing overall animal numbers used in research (Prescott and Lidster 2017). Application of optogenetic approaches could be used to gain a better understanding of how spreading depolarisations may promote epileptiform field potentials rather than neuronal depression in damaged brain tissue. Minimally invasive optogenetic stimulation was restricted to cortical brain regions, however recent advances in opsin engineering now permit transcranial activation of any region of the mouse brain expressing ultrasensitive opsins (Gong et al 2020) opening the possibility of inducing spreading depolarisations in subcortical areas in awake rodents.
Although we take care to keep the dura intact and record epidurally, therefore minimizing tissue damage and swelling, the ability to record electrographically through an intact skull will be a major advance. To explore the possibility of through-skull detection of CSD electrographically we placed two gSGFET arrays, one epidurally and the other on an intact skull, and compared the recorded signals in response to an optogenetically induced CSD. Although some of the spatiotemporal properties are lost with subdermal recordings, including waveform shape due to volume conduction through the bone, 5–10 mV amplitude waves of depolarization travelling across the cortex at ∼3 mm min−1 could clearly be detected (figure 9). Our data demonstrates that subdermal recordings detect both the depolarization wave and neuronal activity suppression in mice. Through-skull graphene micro-transistor recordings, coupled with noninvasive optogenetic induction of CSDs will facilitate longitudinal studies examining inflammatory responses post-CSD where invasive methodology complicates the interpretation of results (Takizawa et al 2020). Additionally, some relevant rodent models, such as the mouse model of familial hemiplegic migraine type 1 expressing the human mutation S218L in the CaV2.1 (P/Q-type) calcium channel subunit, usually die within a few hours/days following invasive brain procedures as a result of uncontrolled brain swelling and edema (Loonen et al 2019). Recording noninvasively from these mice will allow the recording of spontaneous CSDs associated with migraine, without perturbation of the brain, and for extended periods of time.
5. Conclusion
We demonstrate the advantages of combining gSGFET arrays with optogenetic CSD induction to map electrographically with high spatiotemporal fidelity both infraslow activity concurrently with correlated activity suppression and recovery in specified frequency bands. The high-density recordings allow detailed analysis of CSD waveform characteristics and propagation. This in vivo platform is stable, allowing reliable, repetitive rounds of CSDs to be induced on demand. This experimental methodology offers many advantages over traditional approaches to study CSD in vivo in the awake brain, and can be utilized in future studies to gain mechanistic insight into disease pathology, and as a pharmacological screening platform for evaluating potential CSD modulating drugs in several distinct neurological disorders.
Acknowledgments
This work has been funded by the European Union's Horizon 2020 research and innovation programme under Grant Agreement Nos. 785219 and 881603 (Graphene Flagship) and co-funded by the European Regional Development Funds (ERDF) allocated to the Programa operatiu FEDER de Catalunya 2014–2020, with the support of the Secretaria d'Universitats i Recerca of the Departament d'Empresa i Coneixement of the Generalitat de Catalunya for emerging technology clusters devoted to the valorization and transfer of research results (GraphCAT 001-P-001702). RW is funded by a Senior Research Fellowship awarded by the Worshipful Company of Pewterers. EMC was awarded an EMBO Short-Term Fellowship ASTF 8157 to spend time in RW's lab. DR is a Biotechnology and Biological Sciences Research Council (BBSRC) LIDo sponsored PhD student. JAG and EDC acknowledge the Ministerio de Ciencia, Innovación y Universidades, la Agencia Estatal de Investigación (AEI) y el Fondo Europeo de Desarrollo Regional (FEDER/UE) for the FIS2017-85787-R research project. This work has made use of the Spanish ICTS Network MICRONANOFABS partially supported by MICINN and the ICTS 'NANBIOSIS', more specifically by the Micro-NanoTechnology Unit of the CIBER in Bioengineering, Biomaterials and Nanomedicine (CIBER-BBN) at the IMB-CNM. Equipment used was partially funded by Fondo Europeo de Desarrollo Regional (FEDER/UE) FICTS14/20-2-23. IMF is funded by the European Union's Horizon 2020 research and innovation programme under the Marie Skłodowska-Curie grant agreement No. 665919.
Data availability statement
The data that support the findings of this study are available upon reasonable request from the authors.
Conflict of interest
CG is the owner of g.tec medical engineering GmbH and Guger Technologies OG. PR is an employee of g.tec medical engineering GmbH.