
Abstract
Objective. Electric field (EF) stimulation has been used to cue cell growth for tissue engineering applications. In this study, we explore the electrical parameters and extracellular mechanisms that elicit changes in cell behavior when stimulated through the substrate. Approach. Rat Schwann cell morphology was compared when exposed to EF through the media or a conductive indium tin oxide substrate. Ionic and structural effects were then analyzed on Matrigel and collagen I, respectively. Main results. When stimulating through media, cells had greater alignment perpendicular to the EF with higher current densities (106 mA cm−2 at 245 mV mm−1), and reached maximum alignment within 8 h. Stimulation through the substrate with EF (up to 110 mV mm−1) did not affect Schwann cell orientation, however the EF caused extracellular matrix (ECM) coatings on substrates to peel away, suggesting EF can physically change the ECM. Applying alternating current (ac) 2–1000 Hz signals through the media or substrate both caused cells to flatten and protrude many processes, without preferential alignment. Matrigel exposed to a substrate EF of 10 mV mm−1 for 2 h had a greater calcium concentration near the cathode, but quickly dissipated when the EF was removed. Schwann cells seeded 7 d after gels were exposed to substrate EF still aligned perpendicular to the EF direction. Microscopy of collagen I exposed to substrate EF shows alignment and bundling of fibrils. Significance. These findings demonstrate EF exposure can control Schwann cell alignment and morphology, change ECM bulk/surface architecture, and align ECM structures.
Export citation and abstract BibTeX RIS
1. Introduction
Endogenous electric fields (EF) are essential for directing cell growth during tissue development and wound healing where disruption of the natural EF can lead to developmental deformities (Altizer et al 2001, McCaig et al 2002, 2005, Nuccitelli 2003, Levin 2009). During embryogenesis, the developing neural tubes of amphibian and avian animals have significant spatial and temporal organization of EFs ranging from 10–1600 mV mm−1 that can change over days or minutes (McCaig et al 2002). In wounded rat cornea, ionic flow is permitted through broken tissue creating EFs directed towards the site of injury (Reid et al 2005). In both cases, the presence of EFs appears to affect cell differentiation, growth rate, direction of growth, and cell orientation.
Cell membranes and epithelial tissues are semi-permeable barriers to ions and other charged species, resulting in charge separation and thus a natural electric potential across the layer. When the barrier is damaged, ions from either side will flow down its gradient, reducing the electric potential. This ionic current is suspected to act as a cue for cell growth towards the injury until the barrier is repaired and the electric potential is restored. Emulating these EFs by applying an electric potential across electrodes, researchers have demonstrated control of cell migration, elongation, and polarization in vivo and in vitro (Erickson and Nuccitelli 1984, Al-Majed et al 2000, Henley and Poo 2004, Yao et al 2008, Zhao 2009, Ariza et al 2010, Yao et al 2009, Babona-Pilipos et al 2011, Messerli and Graham 2011).
The most common method for in vitro electrical stimulation is applying an EF through the media, effectively creating an electrolytic cell (Borgens et al 1994, Alexander et al 2006, Song et al 2007, Ariza et al 2010, Koppes et al 2011). An issue with this method is the gradual accumulation of cytotoxic species when reduction–oxidation reactions occur at the anode and cathode, so agar salt bridges are used to isolate the reactive byproducts from the cell culture. However, electrode isolation may not be feasible for in situ nerve stimulating applications. Insulated surgical wire with bared ends have been directly sutured around the proximal nerve stump and target structure to create an EF for regrowing nerves (Al-Majed et al 2000, Brushart et al 2002, Geremia et al 2007) and these experiments show varying degrees of success, with a majority of the investigators apply alternating current (ac) signals to prevent corrosion of lead tips whereas endogenous EF are direct current (dc).
Alternatively, tissue EF exposure can be achieved by stimulating a conductive substrate. Electrical current passing through a surface will induce a current in an adjacent conductive medium and stimulate adhered cells. By passing a dc current through a conductor instead of the media, EF exposure can be controlled spatio-temporally and redox byproducts can be limited. This strategy can be implemented on conductive polymer substrates such as polypyrrole, polyaniline, and poly(ethylenedioxythiophene) seen used as nerve scaffolds, bioelectrical interfaces, or biosensors where EF stimulation has been shown to affect cell behavior (Schmidt et al 1997, Durgam et al 2010, Huang et al 2010, Ravichandran et al 2010, Seil and Webster 2010, Huang et al 2012, Qi et al 2013).
Schwann cells were chosen for these studies because of their essential role in peripheral nerve repair. When a nerve is damaged, Schwann cells infiltrate the injury preceding axon growth to remove cellular debris from the site, lay an extracellular matrix (ECM) substrate for axon adhesion, provide contact guidance for axon extension, and excrete chemical cues to guide axon regrowth across the lesion (Fawcett and Keynes 1990, Schmidt and Leach 2003). Schwann cells typically arrange into Bands of Bungner when not innervated, providing an aligned topology important for guiding regrowing axons. Using EFs to control Schwann cell growth and alignment may increase the chances for successful nerve regeneration.
The work presented will highlight the difference in Schwann cell morphology when cultures are electrically stimulated through the media versus through the substrate. Voltage, current density, duration, and exposure to ac were independently assessed to determine which parameters generate a cell response. Collagen I fibril alignment was measured for changes under EF exposure as a possible mechanism for changes in cell morphology. Being able to deliver endogenous EF growth cues by directing a current through the substrate will be an innovative technique to implement in nerve guidance conduits to enhance nerve regrowth.
2. Materials and methods
2.1. Schwann cell culture
Neonatal rat Schwann cells isolated from sciatic nerves were purchased from ScienCell (Carlsbad, CA). Cells culture were grown on tissue culture plastic and maintained in high glucose DMEM medium supplemented with 10% fetal bovine serum, 10 µg ml−1 bovine pituitary extract (Invitrogen, Carlsbad, CA), and 2 µM forskolin (Sigma-Aldrich, St. Louis, MO). To maintain consistent phenotype and cell purity, only cultures between passages 4–8 were used for experiments and purification was confirmed at >90% with S100 staining. Cultures reaching 80% confluency were detached with 0.25% Trypsin-EDTA for 2 min, centrifuged at 800 rpm for 4 min, resuspended in fresh medium, then seeded onto new tissue culture plastic. Medium was changed every third day and kept at 37 °C with 5% CO2 in a humid incubator.
2.2. Extracellular matrix gels
Two extracellular matrices (ECM) were used in the current experiment. Matrigel (8–10 mg ml−1 growth factor reduced, phenol-red free, LDEV-free, BD Biosciences, Franklin Lakes, NJ) is a basement membrane ECM produced by mouse sarcoma cells containing approximately 60% laminin, 30% collagen IV, and 8% entactin. Collagen I is the most abundant type of collagen in the human body and is found in scar tissue. For imaging, rat tail collagen I (8–10 mg ml−1 BD Biosciences, Franklin Lakes, NJ) was used because it creates visible fibrils whereas Matrigel is difficult to observe microarchitecture.
2.3. Creating EF stimulation channels
2.3.1. Channel design for EF through media
The electrical stimulation setup was based on the design described by Song et al (2007), shown in figure 1. Cell cultures were confined in a channel formed by adhering two No. 2 microscope cover slips adjacent on tissue culture plastic with high vacuum silicone grease (Dow Corning, Midland, MI), then adhering a third cover slip on top to create a channel 0.2 × 5 × 22 mm3 (H × W × L). Two cured strips of polydimethylsiloxane (PDMS) (Sylgard 184 Silicone elastomer, Dow Corning, Midland, MI) were secured above the glass channel with grease to separate the anodic and cathodic sides. Cells were injected into the glass channel at 5000 cells cm−2, allowed to adhere for 1 h, then 6 ml of cell culture media was added to each side of the channel. Two agar salt bridges (4% agar in PBS) in glass tubing were placed in contact with the cell media and saline reservoirs, one being the cathode and the other the anode. Stainless steel plates in contact with the reservoirs completed a two-electrode setup. A multipotentiostat (1000C Multipotentiostat, CH Instruments, Austin, TX) was used to drive electrical currents and a function waveform generator (33220A, Agilent Technologies, Santa Clara, CA) was used for experiments requiring ac. Channel resistance was controlled by varying the widths of the channels between 0.5–3 cm. Schwann cell morphology was observed when exposed to changing current density, duration, and ac frequency. Cells seeded into channels receiving no electric stimulation served as controls.

Figure 1. Assembly of the channel begins with (a) stacking glass cover slips to create a 0.2 mm high channel in a tissue culture plate. (b) Two long strips of PDMS are placed above the channel to isolate media on opposite sides of the channel. (c) Agar salt bridges are placed in contact with the media and PBS reservoirs. Electrodes connected to the reservoirs provide an EF (and corresponding electric current, depicted as red arrows) through the media within the channel above the cell cultures.
Download figure:
Standard image High-resolution image2.3.2. Channel design for EF through substrates
The setup for electrical stimulation through the substrate is shown in figure 2. The indium tin oxide (ITO) surface was scratched with a rotary tool to confine electrical conductivity within the center channel 15 mm wide. ITO conductivity was controlled by chemically etching the surface with HCl vapor for 2–20 min. Similar to the previous setup, cell cultures were confined between glass coverslips creating a channel 0.2×15× 22 mm3 H×W×L, arranged on top of electrically conductive ITO coated glass slides (25 × 75 mm2, sheet resistance 30–60 Ω, Delta Technologies, Loveland, CO). Because cells do not readily attach to ITO, Matrigel diluted 1:40 in PBS was adsorbed onto the glass surface for 1 h at room temperature then aspirated and dried. Cells were injected into the channel at 5000 cells cm−2 with extra media corralled on the side to prevent evaporation, and given 1 h to adhere. Electrodes were clasped to opposite sides of the ITO glass to apply EF directly beneath the cell culture. Schwann cell morphology was observed when exposed to changing current, voltage, duration, and ac frequency. Cells seeded into channels receiving no electric stimulation served as controls.
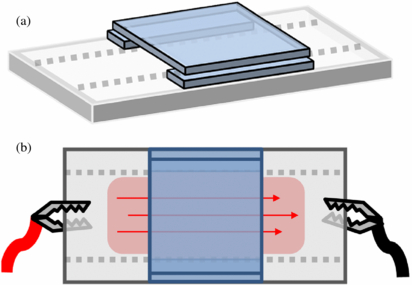
Figure 2. (a) An isometric view depicts base cover slips placed on the outer edge of the conductive center. A glass cover slip stacked on top of the base to create a channel. (b) Cells and media were injected into the channel, with extra media around the edges to prevent dehydration of the culture. Electrodes were clamped on opposite ends of the ITO glass to conduct electricity through the center lane.
Download figure:
Standard image High-resolution image2.3.3. Controlling current through channels
Ohm's law states that an electrical current through a conductive element is proportional to the applied voltage and material's resistance. The relationship is described by the mathematical equation,

where I is current (A), V is voltage (V), and R is the resistance of the material (Ω). Resistance of the channel was altered by changing the width of the glass cover slips. As the cross sectional area increases, resistance decreases.
It is important to note that cells attached to a substrate can only detect molecules within the environment that are sufficiently near its surface. The height of the media is inconsequential as long as transport of nutrients, waste, and gases is adequate. When an ionic current flows above a cell culture, an increase in the cross sectional area of the channel will result in a decrease in current density J (A m−2) described as,

where A is the cross sectional area of current flux (m2). This equation describes the number of electrical charges in a cross section of the conductor. It is evident that J is dependent upon the cross sectional area and resistance of the media in the channel, thus, changes in these parameters will expose cells to different electrical environments.
By keeping the height constant using a 0.2 mm thick cover slip, resistance of the channel was decreased by increasing channel width from 0.5 to 3 cm. Resistance of the channel was calculated from potentiostat measurements and was found to have an inverse relation to the channel width. The average resistances were 5.8 kΩ for 0.5 cm channels, 2.9 kΩ for 1 cm, 1.7 kΩ for 2 cm, and 1.0 kΩ for 3 cm. Channel resistance quickly plateaus to a minimum when increasing the width beyond 3 cm and resistance dramatically increases when the width is reduced to less than 0.5 cm. These values were used to calculate the electrical parameters for the following experiments.
2.4. EF stimulation of samples
2.4.1. Schwann cell EF exposure through media
After Schwann cells have adhered onto the surface for 1 h, cell response to EF was observed by changing each EF property independently. Current density (mA cm−2) and correlating EF (mV mm−1) through the channel was changed by varying the channel widths between 0.5, 1, and 3 cm while applying a constant potential for 6 h. Stimulation duration was varied between 2, 8, and 24 h under constant 139 mV mm−1 in 1 cm channels. AC signal was evaluated by using frequencies of 2, 60, and 1000 Hz at 139 mV mm−1 peak-to-peak to stimulate cells in 1 cm channels for 6 h. After stimulation, Schwann cells in channels were fixed immediately in 4% paraformaldehyde/PBS for 15 min at room temperature and stored in PBS until phase contrast imaging and analysis of cell orientation. Control samples had channel widths of 3 cm and cultured for 6 h after adhering without EF exposure. Experiments were repeated three times.
2.4.2. Schwann cell EF exposure through substrate
Electrical parameters for stimulation through the substrate were comparable to previous studies by Schmidt et al 1997, Gomez and Schmidt 2007, and Durgam et al 2010. Cell morphology was observed when the ITO glass was stimulated with EFs of 4, 20, and 110 mV mm−1 with a constant 1 mA current on ITO glass of 300, 1500, and 8500 Ω resistances, respectively, to independently change the voltage while keeping current constant. To change the current independently, a constant 15 mV mm−1 was placed across ITO of different resistances for 6 h, resulting in currents measuring on average 0.12, 0.67, and 3.3 mA. Durations of 2, 8, and 24 h was assessed using 15 mV mm−1 with 3.3 mA current applied across 300 Ω ITO glass. AC stimulation with frequencies of 2, 60, or 1000 Hz was applied to cultures using 15 mV mm−1 root mean square across 300 Ω ITO glass for 6 h. Control samples contained Schwann cells cultured on coated ITO for 6 h without EF exposure. All samples had identical physical parameters, culturing conditions, and repeated three times. After stimulation, cells were fixed in 4% paraformaldehyde/PBS for 15 min at room temperature, imaged, and analyzed.
2.4.3. Matrigel EF exposure through substrate
Matrigel was stimulated in chambers made of polycarbonate wells created in-house with inner dimensions of 1 × 1.5 cm2 secured on top of ITO glass using high vacuum grease. A thin layer of gel was created by spreading 40 µl of stock 8–10 mg ml−1 Matrigel approximately 0.5 × 1.5 cm2 and 50 µm thick on the ITO surface within the well. The gel was placed in a 100% humid incubator at 37 °C for 15 min to allow gelation before adding media. Electrodes were attached to opposite sides of ITO glass such that the applied EF was parallel to the long axis of the gel.
To measure EF effects on calcium concentration in the sample, gels were stimulated with 10 mV mm−1, 5 mA for 2 h in an incubator. Then gels were immediately measured for calcium or stored in media at 37 °C and measured 1–3 d after stimulation. Media was aspirated, polycarbonate wells detached, and Matrigel flash frozen in liquid nitrogen to immobilize all molecules. The frozen gels were cut into five equal sections and thawed at 4 °C in separate microcentrifuge tubes. Once fluid, 5 µl from each section was mixed into 100 µl of PBS containing 5 mM EDTA and 1 µM calcium dye (Calcium Green-1, Invitrogen, Carlsbad, CA). The fluorescence emitted from each section was recorded by a fluorometer with a 485/20 nm excitation and 528/20 nm emission filter (FLx800, BioTek, Winooski, VT). Controls were processed in identical manner without EF exposure. Experiments were repeated six times.
For cell culture experiments, Matrigel samples were stimulated 10 mV mm−1, 5 mA for 24 h to maximize EF effects on the gel. Schwann cells were cultured on the gel during stimulation (0 d, indicating cells were seeded at the initial stimulation time) or seeded 1, 3, and 7 d after completion of stimulation, where stimulated gels remained in media at 37 °C prior to seeding. Two days after cell seeding, live cells were imaged using phase contrast microscopy. Controls were identical to 0 d experiments without EF exposure. Each condition was repeated at least three times.
2.4.4. Collagen I EF exposure through substrate for imaging
For phase contrast images, stock collagen I 8–10 mg ml−1 was placed at room temperature for 30 min to initiate the formation of large fibers (grouped fibrils), then diluted to 25 µg ml−1 in PBS so individual fibers could be detected for automated analysis. Samples were sealed in the ITO glass chamber with parafilm, then exposed to 10 mV mm−1 through the substrate for 24 h and imaged immediately after. Experiments were repeated five times.
For confocal imaging, collagen I was diluted 250 µg ml−1 in PBS then gelled at 37 °C to reduce density when visualizing 3D collagen structures. Samples sealed in ITO glass chambers with parafilm were stimulated 10 mV mm−1 for 24 h and imaged immediately after. Samples were repeated six times.
Scanning electron microscopy (SEM) of stock 10 mg ml−1 collagen I exposed to 10 mV mm−1 for 24 h was imaged after preserving the microarchitecture. Samples were fixed in 4% paraformaldehyde/2% glutaraldehyde for 15 min then dehydrated by graded ethanol/PBS solutions of 50%, 75%, 85%, 95%, and 100% for 15 min each, and a final 100% ethanol solution for 30 min. Ethanol was then replaced with a graded hexamethyldisilizane (HMDS)/ethanol solution of 25%, 50%, 75%, and 100% for 15 min each, and a final 100% HMDS solution for 30 min. Samples were repeated five times and kept in desiccated chambers until imaging.
2.5. Microscopy
An inverted light microscope (IX-70, Olympus, Center Valley, PA) with an attached CCD camera (Optronics MagnaFire S608000, Goleta, CA) was used to take phase contrast images of cells using a dry 10× objective.
Phase contrast images of diluted collagen samples were imaged with 40× magnification. Collagen fiber orientation was analyzed with ImageJ and OrientationJ plugin (Biomedical Engineering Group at Ecole Polytechnique Federale de Lausanne, available at http://bigwww.epfl.ch/demo/orientation/). The program determines the orientation of objects within an image by calculating structure tensors in a local neighborhood. Settings were set to a Gaussian window of 1 pixel, with a minimum coherence of 10% and minimum energy of 1% to analyze the Gaussian distribution of collagen fibril orientation. Data was outputted as an orientation distribution graph and as an image color-coded by angle.
Confocal reflectance microscopy (CRM) was used to image collagen I fibers without fluorophores. Samples were imaged using an inverted confocal scanning microscope (Leica SP2 AOBS, Leica Microsystems Inc., Buffalo Grove, IL) with a 40× oil immersion objective and a 633 nm He/Ne laser. Collagen fibers were analyzed in z-stacked images of 40 sections spanning a depth of 40 µm, at least 10 µm below the glass surface.
SEM was performed on desiccated collagen I samples, sputter coated with gold-palladium. SEM images were taken with a Quanta 650 FEG (FEI, Hillsboro, OR) using high vacuum, high voltage of 2–10 kV, 3.0 nm spot size, 8.5 mm working distance, and 1000–12000× magnification.
2.6. Data analysis
Voltage and EF values were measured by placing two probes of a multimeter at both ends of the channel during stimulation. The current was recorded by the multipotentiostat during the experiment and current density was calculated by dividing by cross sectional area.
Cell alignment relative to the EF was analyzed with NIH ImageJ software (version 1.46, available at http://rsbweb.nih.gov/ij/). Samples were oriented so the EF is aligned along the horizontal axis, with the cathode at 0° and the anode at 180°. Cell orientation was measured as the angle between 0° and a line drawn through the long axis of the cell, adapted from cell analysis methods found in literature (Erickson and Nuccitelli 1984, Sun et al 2006). The long axis was defined as the major axis of an ellipse drawn around the cell that was at least 50% greater than the minor axis. Spread cells with a major axis less than the criteria were calculated as having no overall orientation, and thus were not included in calculating average cell orientation. All cells were measured with angle values between 0° and 180°, as shown in figure 3(a). Designating θ as the cell angle relative to the EF, the average –cos 2θ will give a convenient description of cell alignment where a value near −1 indicates cell alignment parallel to the EF, +1 indicates alignment perpendicular to the EF, and 0 indicates alignment at 45° expected for the average angle of randomly oriented cells (figure 3(b)). The vertex of the cell angle in figure 3(a) is represented as the origin in 3(b), so the radius of the polar graph indicates the length of the cell.
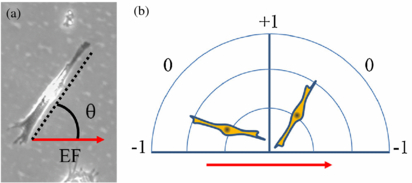
Figure 3. Cell cultures were exposed to an EF (and corresponding electric current) directed from left to right. (a) Schwann cell orientation is measured by drawing a line along the longest axis of the cell. The angle between the drawn line and the EF direction, θ, indicates cell orientation. (b) Cell angles closer to 0° are parallel to the EF and angles closer to 90° are perpendicular to the EF, described by –cos 2θ as alignment of −1 or +1, respectively.
Download figure:
Standard image High-resolution imageStatistical significance was determined with Student's t-test, comparing experimental average orientation angle against values from control samples. One-way ANOVA with Tukey's post-hoc test was used to compare calcium concentrations within sections of gel (SPSS v.20, IBM, Armonk, NY). Statistical significance was defined at p < 0.05.
3. Results and discussion
3.1. Schwann cell response to EF through media
When placing an EF across the media above a Schwann cell culture, current density/EF strength, stimulation duration, and ac frequency was changed to observe associated cell response. Sample images demonstrating changes in cell morphology when stimulated with different current densities are shown in figure 4. At greater current densities (and correlating stronger EF), Schwann cells display more cell alignment perpendicular to the EF.
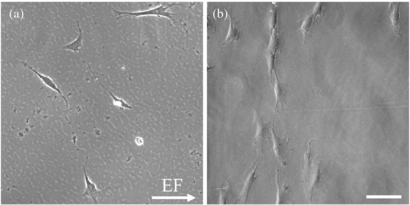
Figure 4. Sample phase contrast images of Schwann cells stimulated with media EF display the degree of perpendicular alignment when cultured on (a) 3 cm channels with 36 mA cm−2 and (b) 0.5 cm channels with 106 mA cm−2. All images were analyzed with the EF directed from left to right. Scale bar is 100 µm.
Download figure:
Standard image High-resolution imageFigure 5 depicts a typical plot graph of Schwann cell angle and length (radius) measurement in polar coordinates. The origin represents one end of the cell and black dots represent the location of the opposite end of the cell, where the radius is the cell length (µm). There are four graphs, one for each current density strength and one for control conditions. All cell orientation analysis was performed with this method.
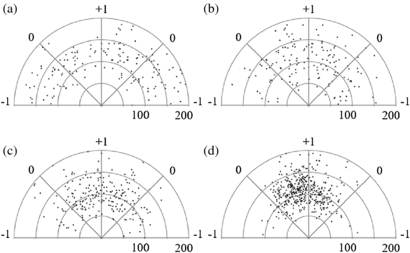
Figure 5. A sample polar graph depicts the length (radius, in µm) and angle of Schwann cells (represented as black dots) exposed EF through the media with different current densities. (a) Control samples were not stimulated with an EF. Experimental samples were stimulated with (b) 36, (c) 79, and (d) 106 mA cm−2. Higher current density had greater cell alignment perpendicular to the EF.
Download figure:
Standard image High-resolution imageThe average orientation of cultures without electrical stimulation was −0.01, which is near the theorized 0 for randomly oriented cells. The average cell orientation when stimulated with 106 mA cm−2 was 0.71 (245 mV mm−1), 79 mA cm−2 was 0.44 (175 mV mm−1), and 36 mA cm−2 was 0.29 (90 mV mm−1), shown in table 1. The original intent of this experiment was to independently change current density and EF strength, however we found this was not possible because resistivity of the media could not be easily changed. Regardless, it was observed that higher current density (and correlating EF) through the media induced greater perpendicular Schwann cell orientation.
Table 1. Electrical parameters and Schwann cell orientation when exposed to EF through the media.
| Frequency (Hz) | Duration (h) | Current (mA) | Current density (mA cm−2) | EF (mV mm−1) | Cell angle | Standard deviation | n | p-value |
|---|---|---|---|---|---|---|---|---|
| Control | – | – | – | 0.01 | 0.66 | 169 | ||
| – | 6 | 2.18 | 36 | 90 | 0.29 | 0.64 | 158 | 10−5 |
| – | 6 | 1.59 | 79 | 175 | 0.44 | 0.55 | 228 | 10−11 |
| – | 6 | 1.06 | 106 | 245 | 0.71 | 0.36 | 434 | 10−29 |
| – | 2 | 1.38 | 69 | 139 | 0.27 | 0.63 | 139 | 10−3 |
| – | 8 | 1.38 | 69 | 139 | 0.47 | 0.56 | 207 | 10−12 |
| – | 24 | 1.38 | 69 | 139 | 0.42 | 0.59 | 215 | 10−9 |
| 2 | 6 | 1.39 | 70 | 139 | −0.06 | 0.74 | 47 | 0.68 |
| 60 | 6 | 1.39 | 70 | 139 | −0.01 | 0.68 | 234 | 0.81 |
| 1000 | 6 | 1.39 | 70 | 139 | −0.09 | 0.69 | 129 | 0.30 |
When stimulating with different durations, the average cell angle for cell cultures stimulated for 2 h was 0.27, 8 h was 0.47, and 24 h was 0.42. The voltage and channel width were identical for all experiments, with an average EF of 139 mV mm−1 and current density of 69 mA cm−2. There appears to be a limiting time where cell orientation does not increase any further. By 8 h, the average cell orientation is at its maximum as determined by the current density or EF strength. Further increase in stimulation duration beyond 8 h had no effect on changing the average cell orientation.
The differences in the average cell orientation of cultures exposed to ac EF of 2, 60, and 1000 Hz were not statistically significant when compared to the control. The three frequencies were chosen because bioelectromagnetic studies from various authors have observed conflicting results with in vitro and in vivo experiments using ac electrical parameters between 1 Hz up to 7.5 GHz with EF between 1–150 mV mm−1 and current densities near 10–100 mA cm−2 (Al-Majed et al 2000, Aydin et al 2006, Sontag and Kalka 2006, Zhang et al 2006, Ahlborn et al 2007, Deans et al 2007, Walker et al 2007, Lu et al 2008, Sheikh et al 2013). In our study, there was no difference in cell orientation when exposed to the chosen signals, however Schwann cell morphology was radically different compared to controls or cells exposed to dc stimulation, as shown in figure 6. Cells appear larger and have more lamellipodia, as opposed to their sickle-shaped morphology under normal culture conditions. In particular, samples exposed to 2 Hz were mostly oblong and could not be included in measurements, with only n = 47 cells recorded as having any preferred orientation. The dramatic change in cellular morphology has not been published in literature and will need further investigation to understand the implications of ac EF.
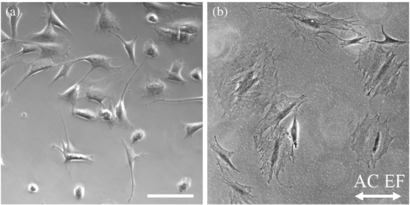
Figure 6. Sample phase contrast images show (a) Schwann cells without EF exposure (control) typically have a bipolar spindle shape, compared to (b) cells exposed to ac EF of 130 mV mm−1 through media cycled at 60 Hz which have a flat spread morphology. Scale bar is 100 µm.
Download figure:
Standard image High-resolution imageThe electrical properties and cell angle values measured for these experiments have been summarized in table 1. The current density is a calculation based on the measured current and the corresponding cross sectional area of the channel. The EF is a calculation based on measurement of the voltage using a multimeter placed directly across the ends of the channel. 'Cell angle' is the orientation defined by –cos 2θ, column 'n' is the number of cells measured to calculate the average cell angle, and 'p-value' is the probability that the distribution is random using Student's t-test comparing the variable with the control value.
3.2. Schwann cell response to EF through substrate
Gradients of ionic species in interstitial fluid create endogenous EFs within the body, found to direct wound healing and tissue development. Most published studies emulate these conditions by applying current through the media demonstrating favorable cell response, and the study presented in this section investigates if similar electrical parameters can be used on conducting cell substrates. This was achieved by culturing Schwann cells on conductive ITO glass coated with Matrigel and enclosed in a glass chamber. When a potential is placed across the ITO, current primarily flows across the more conductive surface and a small portion will flow through the media adjacent to the surface. This setup can be described as current flowing through two resistors in parallel.
To assure the current setup would be comparable to the previous setup, cells cultured on Matrigel-coated ITO were exposed to an EF through media under select identical conditions (i.e., 245 mV mm−1, 6 h). We found that cell morphology and orientation response to the media EF was similar on coated ITO and uncoated tissue culture plastic (data not shown).
To compare cell response to EF through the substrate versus EF through the media, the parameters used were either identical to the previous experiment or relevant to published literature (McCaig et al 2005, Lee et al 2009, Durgam et al 2010) where 10 mV mm−1 for 2 h was effective for stimulating rat PC12 and embryonic hippocampal cells to increase neurite extension. One limitation to signal strength is electrolysis of water occurring at 1.2 V resulting in cell death, so electrical parameters had to remain below this value. As in the previous section, each parameter was changed independently to determine cell behavior and repeated three times each. The electrical conditions and cell angle values measured in this experiment have been summarized in table 2.
Table 2. Electrical parameters and Schwann cell orientation when exposed to EF through the substrate.
| Frequency (Hz) | Duration (h) | Current (mA) | EF (mV mm−1) | Cell angle | Standard deviation | n | p-value |
|---|---|---|---|---|---|---|---|
| Control | – | – | 0.02 | 0.59 | 348 | ||
| – | 6 | 1.0 | 4 | −0.04 | 0.49 | 466 | 0.08 |
| – | 6 | 1.0 | 20 | 0.08 | 0.52 | 473 | 0.16 |
| – | 6 | 1.0 | 110 | −0.02 | 0.50 | 406 | 0.27 |
| – | 6 | 0.12 | 15 | 0.07 | 0.56 | 453 | 0.23 |
| – | 6 | 0.67 | 15 | −0.05 | 0.58 | 590 | 0.08 |
| – | 6 | 3.3 | 15 | 0.05 | 0.50 | 563 | 0.59 |
| – | 2 | 3.3 | 15 | −0.04 | 0.38 | 540 | 0.06 |
| – | 8 | 3.3 | 15 | −0.02 | 0.50 | 290 | 0.30 |
| – | 24 | 3.3 | 15 | −0.12 | 0.58 | 564 | 10−3 |
| 2 | 6 | 3.3 | 15 | −0.01 | 0.52 | 456 | 0.43 |
| 60 | 6 | 3.3 | 15 | 0.02 | 0.48 | 433 | 0.83 |
| 1000 | 6 | 3.3 | 15 | −0.05 | 0.53 | 590 | 0.09 |
The average orientation of control samples receiving no EF exposure inside glass chambers was 0.02, which is near the ideal 0 for randomly oriented cells. The average orientations of cell cultures receiving the different EF strengths of 4, 20, and 110 mV mm−1 were each near 0 and not significantly different from control. Interestingly, at higher EFs, the Matrigel coating began peeling away from the ITO glass surface, shown in figure 7. The average orientation angles of cell cultures exposed to varying currents of 0.12, 0.67, and 3.3 mA were each near 0 and not significantly different from control. The average orientation angles of cell cultures receiving stimulation for 2 and 8 h were near 0, however for 24 h stimulation, cell orientation was significantly different from the control samples at −0.12. And like the previous experiment, Schwann cells exposed to ac signals did not change overall orientation but did have more spread morphology with a higher amount of processes extending from the soma.
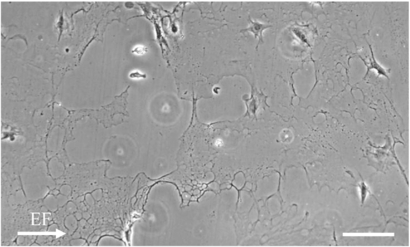
Figure 7. Cells exposed to substrate EF of 110 mV mm−1 are morphologically identical to control cultures and can be seen aligning along the edges of the peeling Matrigel. The coating becomes heterogeneous when the cell culture was exposed to a stronger EF or for longer duration. Scale bar is 200 µm.
Download figure:
Standard image High-resolution imageThere was no overall cell alignment with any tested current or voltage strengths within 6–8 h of stimulation, however after 24 h of stimulation, cells were aligned parallel to the EF which is the opposite of what we observed in the previous experiments. This was not found homogeneously throughout the culture, so it may be the result of local changes in the Matrigel coating due to EF forces, creating a topology influencing cell alignment. These results suggest that EF through the substrate may need to be stronger or stimulated longer for any effects to appear, so all of the 6–8 h experiments may have been too short to discover any changes in cell morphology. Another interesting observation is that stimulation with ac frequency affected Schwann cell morphology similarly to EF through media, implying that there may be similarities in the two stimulating methods. To our knowledge, this behavioral response to ac electrical signals has been undocumented, so further investigation into this phenomenon is warranted.
Delivering current through the substrate may affect cells through different modalities which could explain some of the observations. (1) The charged surface will attract or repel charged species such as ions or proteins in the media that will influence behavior of adhered cells (Kotwal and Schmidt 2001, Wood and Willits 2009), (2) Joule heating produced by current can change protein conformation and cell behavior, (3) the current beneath the cells can induce charge separation in the contacting medium, and (4) the EF along the substrate may affect the ECM adjacent to the ITO glass. To address some of these theories, EF influence on the cell environment was explored in the following studies.
3.3. EF through ITO substrate changes calcium distribution across Matrigel
Matrigel stimulated on ITO and flash frozen was sectioned into five equal volumes, from cathode to anode (figure 8(a)). Change in ionic distribution near the surface of conducting ITO glass was observed by measuring the calcium green fluorescent intensity correlating with the Ca2+ concentration in each section of gel.
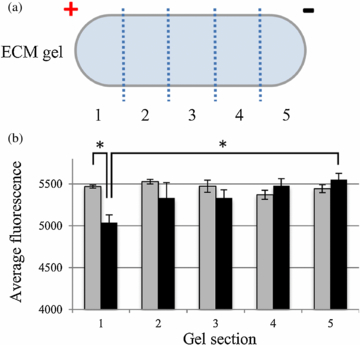
Figure 8. (a) An EF stimulated gel on ITO glass is flash frozen in liquid nitrogen and sectioned into five equal volumes. (b) Each section is analyzed for Ca2+ concentration. Gels that were not exposed to EF (gray bars) had similar concentration of calcium green fluorescence in each of the five sections. Gels exposed to 10 mV mm−1 (black bars) had a gradient of calcium fluorescence in the gel sections, increasing from anode to cathode. Error bars represent standard error of the mean. * p < 0.05
Download figure:
Standard image High-resolution imageThe base fluorescence of the calcium green solution was approximately 3000 units. A standard curve was generated indicating that 500 units of fluorescence equates to a difference of 80 µM of Ca2+. In gels without EF exposure, Ca2+ concentrations in each of the five sections were not significantly different, with an average calcium green fluorescence between 5371–5526 (figure 8(b)). For gels exposed to a substrate EF of 10 mV mm−1, Ca2+ concentration in section 5 closest to the negatively charged cathode, had the highest average calcium green fluorescence at 5550 and sections 1–4 had gradually lower fluorescence with readings between 5036–5478. Section 1 and 5 were found to be significantly different with p < 0.02. Comparing control and stimulated samples showed that there was significant difference between section 1 with p < 0.01, however, sections 4–5 were not significantly different between groups. It is worthwhile to note the total Ca2+ concentration (summation of Ca2+ in all sections) of stimulated gels appears to be lower than that of the control gels. It is possible that during EF stimulation of the substrate, a small amount of Ca2+ diffuses out of the gel and into the surrounding media.
Calcium measurements were also taken 1 and 3 days after stimulation to determine if an ionic gradient is prolonged within the gel. EF stimulation of the gel was performed identically as previous, but the gels were left in the incubator for the allotted time before units were aspirated, frozen, and divided into five sections for calcium green assay. There was no measurable difference in calcium distribution across the gel compared to control samples for either 1 or 3 days after stimulation (data not shown).
Examination of the charge distribution in a stimulated hydrogel is a simple way to test the effects of an EF because charged species within the gel are slower to mobilize. Matrigel stimulated for 2 h at 10 mV mm−1 was at the lower end of our parameters (and effective at promoting neurite extension in PC12 cells, as shown by Durgam et al (2010)), thus finding any differences in calcium concentration within the gel is indicative of greater differences when using stronger EF parameters. Ca2+ distribution in Matrigel post stimulation revealed a greater amount of Ca2+ near the cathode side. Because Ca2+ is an important molecule in cell signaling, movement, and growth, cells may exhibit preferred growth towards an area with a higher Ca2+ concentration (Robinson 1985, Henley and Poo 2004, Mycielska and Djamgoz 2004, Ariza et al 2010). Furthermore, increased Ca2+ presence would increase Schwann cell expression of NGF, to enhance neurite growth, direction, and survivability (Huang et al 2010). While only Ca2+ was examined, the results from this experiment are relevant to any mobile charged species.
3.4. Matrigel exposed to EF align Schwann cells
Schwann cell morphology was observed when cultures were introduced to Matrigel exposed to an EF. Phase contrast microscopy was used on live cultures and cell angles were measured to determine alignment (figure 9) with an average n = 180 cells for each of the experimental and control groups.
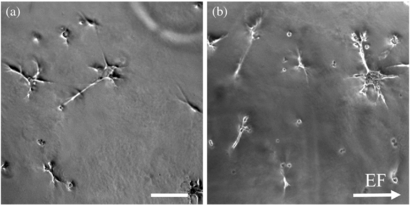
Figure 9. (a) Schwann cells from control groups have random orientation, with an average orientation near −0.03. (b) Schwann cells seeded on pre-stimulated Matrigel exhibited average cell orientation of 0.29, aligning more perpendicular to the EF. Scale bar is 100 µm.
Download figure:
Standard image High-resolution imageThe average cosine angle of Schwann cells in control samples was −0.02. Schwann cells cultured on gels during EF stimulation had greater perpendicular alignment to the EF with an average orientation of 0.27 (0 d). When seeded 1, 3, or 7 d after gel stimulation, Schwann cells had an average alignment of 0.25, 0.20, and 0.19, respectively (figure 10). The average angles were each significantly different than control samples (p < 0.01), but were not statistically different from each other.

Figure 10. Schwann cells were seeded onto gels during EF stimulation (0 day) and 1, 3, and 7 d after stimulation (black bars with standard error). All samples were significantly different than control (gray bar), but were not significantly different from each other.
Download figure:
Standard image High-resolution imageThe data reveals EF stimulation has a lasting effect on the Matrigel as indicated by Schwann cell alignment found days after stimulation. There appears to be a trend of decreasing orientation as the time between stimulation and cell seeding increases and may be due to relaxation of the hydrogel. Nevertheless, these findings would be beneficial for clinical applications requiring long term implants that can improve tissue regeneration with electrical stimulation or ECM organization, such as nerve conduits.
3.5. Collagen I exposed to EF changes organization
In the following experiments, the ECM was assessed with microscopy to determine if substrate EF was affecting structure and organization. Instead of using Matrigel, collagen I was chosen as a substitute for several reasons: (1) collagen I contains easily identifiable fibrils 50–100 nm in diameter when gelled at physiological temperature, whereas Matrigel is difficult to image because it remains amorphous, (2) collagen I is similar in chemical makeup to non-fibrillar collagen IV, which comprises 30% of Matrigel, and (3) collagen I is present in injured nerves having random orientation in scar tissue but becomes highly organized in healed mature tissue. Because Matrigel and collagen I are different, a short study examining Schwann cell orientation on collagen stimulated with 10 mV mm−1 5 mA for 24 h (identical to 0 day experiment in section 3.4) showed that cells had an average alignment of 0.23 (n = 65), comparable to results found with Matrigel. Phase contrast, CRM, and SEM microscopy were used to observe structural changes in collagen I gels following stimulation on ITO glass.
Phase contrast images of collagen fibers (6 images per sample) were analyzed using ImageJ with the OrientationJ plugin where the distribution of tensor angles of line structures in the images is calculated. A color distribution of tensor measurements was output such that every 15° angle is represented as a different color, shown in figure 11. The graph shows that the average angle distribution of collagen fiber alignment when exposed to an EF has greater intensity between 45° and 90° compared to control samples that were under identical conditions without electrical stimulation. Given that size and shape of collagen fibers are fairly uniform, the data indicates that more collagen fibers are aligned perpendicular to the EF.
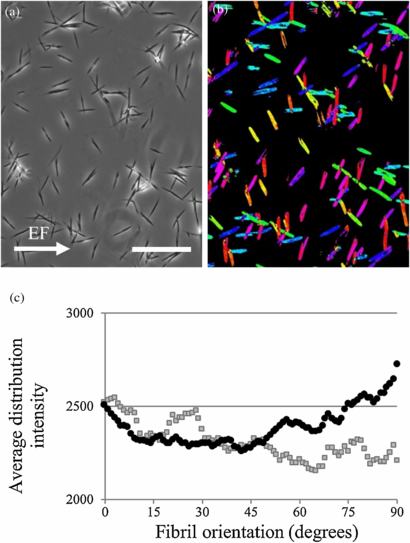
Figure 11. (a) A phase contrast image taken with a 20x objective and (b) corresponding colored tensor map of diluted collagen are shown in the two above images. (c) The distribution of collagen I fiber orientation shows samples exposed to EF (black circles) having greater vertical alignment near 90° compared to samples without EF exposure (gray squares). Scale bar is 100 µm.
Download figure:
Standard image High-resolution imageCRM of diluted collagen I fibrils provided two important observations in stimulated samples: (1) EF stimulation reduces the homogenous fibril pattern typically seen in control samples and (2) clusters of large fibers are more prevalent after EF stimulation, as shown in figure 12. Meaningful quantification of these observations proved difficult because of the random formations of fibers and gel heterogeneity. However, the observations demonstrate that EF exposure changes collagen organization which can affect ECM architecture, thus influencing cell response to the substrate.
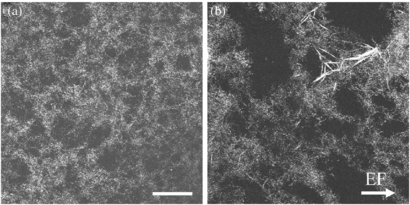
Figure 12. Confocal images of (a) control and (b) EF stimulated dilute collagen I gels show a difference in structural arrangement. Control samples have a relatively uniform pattern of fibril organization, however, EF stimulated samples appear less homogenous and have more large fiber formations. Scale bar is 50 µm.
Download figure:
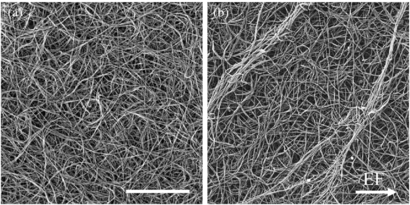
Standard image High-resolution imageSEM images of EF stimulated 10 mg ml−1 collagen samples showed individual fibrils and formation of fibril bundles. We define fibril bundles as groups of at least five fibril strands that are aligned in the same direction, extend for at least 10 µm, and are packed together, often entwining. It was observed that collagen I gels stimulated with 10 mV mm−1 for 24 h have more fibril bundles on the surface than collagen I gels without EF exposure (figure 13).
Figure 13. SEM images of collagen I samples (a) without stimulation and (b) EF stimulated at 8000× magnification. Stimulated samples have more fibril bundles, identifiable as grouped fibrils that are aligned and twisted together. Image (b) shows two artificially brightened bundles that are both aligned at 60–70°. These bundles were found five times more often in EF samples versus control. Scale bar is 5 µm.
Download figure:
Standard image High-resolution image
Fibril bundles were counted using 1000× magnification with a field of view 150 × 130 µm2 per image. Prevalence of fibril bundles was calculated for each group by calculating the average fibril count per image (47 images for control, 66 for EF exposed). On average, control samples had 10.9 fibril bundles per mm2 and EF stimulated samples had 58.3 fibril bundles per mm2. The orientation of fibril bundles in EF stimulated collagen samples were measured but no preferential orientation was observed. Fibril bundles were typically much longer than the field of view used, and become more difficult to distinguish at lower magnifications. Further investigation on fibril bundle formation and orientation will be needed to understand the EF effects, however it is encouraging to find that fibril bundles are 5× more prevalent when gels are exposed to EF.
The three imaging techniques to analyze collagen I were all able to detect differences in architecture when exposed to substrate EF, suggesting that EF stimulation can change protein structures found in the extracellular environment. Cheng et al (2008) demonstrated that collagen I directly exposed to 3.5 µA 2.5 V dc aligned perpendicular to the EF, but the pH across the gel varied between 4–10. There have been several groups who have shown that electromagnetic fields (5–10 tesla or <10−4 tesla with added magnetic particles) can induce permanent alignment of collagen fibers (Dubey et al 1999, Guo and Kaufman 2007) but may not be feasible in situ. The current study demonstrates electrical current through a substrate can induce changes in adjacent ECM architecture under safe physiological conditions.
4. Conclusion
Alignment of Schwann cells perpendicular to the EF through media is proportional to increasing current density (and correlating EF strength) ranging between 36–106 mA cm−2 (90–245 mV mm−1). Under constant EF, cultures reached maximum alignment within 8 h of stimulation. When stimulating cultures with ac 2–1000 Hz, Schwann cells did not reorient in response to the EF, but became round, flatter, larger, and had more processes than control or dc stimulated cells.
EF stimulation of 4–110 mV mm−1 through the substrate did not affect Schwann cells consistently, nor did it cause obvious cell alignment. Although, a longer 24 h stimulation caused cells to align parallel to the EF which is in contrast to the previous findings. The reason for this orientation is unknown, but isolated areas of orientation hints there may be local changes in the Matrigel that may be affecting cells. Schwann cells displayed similar morphology with ac stimulation through substrate as through media
Substrate EF was found to change calcium distribution within Matrigel and Schwann cells seeded onto gels a week after stimulation aligned perpendicular to the initial EF, demonstrating that EF can have a long term effect on contacting ECM. Collagen I fibers under the same condition aligned perpendicular to the field, while confocal microscopy showed greater heterogeneity in its bulk structure and the presence of large fibers. The gel surface had five times as many fibril bundles on stimulated gels compared to control, although average bundle orientation remains inconclusive.
The work described here improves the understanding of EF effects on cell behavior and provides a new method in manipulating the extracellular environment for tissue engineering. The advantages of stimulating cells through a substrate include localized stimulation, control of topology, and modification of the substrate geometry for various applications, such as a tubular conduit for nerve repair.
Acknowledgments
The work presented was funded by the Gillson Longenbaugh Foundation. The authors were supported by the Department of Defense National Defense Science and Engineering Graduate fellowship, the University of Texas at Austin Undergraduate Research Fellowships, and Intellectual Entrepreneurship funding. The authors would like to thank Shouliang Zhang, Dwight Romanovicz, and Julie Hayes for their assistance and expertise in microscopy at the Center for Nano and Molecular Science and the Institute for Cellular and Molecular Biology.