


Abstract
The deuterium (D) operation was initiated in the LHD in 2017. In the first campaign of the D experiments, we successfully extended the high temperature regime in the LHD. The new record of the ion temperature (Ti) of 10 keV associated with the ion internal transport barrier (ITB) was achieved due to several operational optimization. The thermal confinement characteristics of ITB plasmas were compared between hydrogen and D discharges. The effective ion thermal diffusivity of the ion-ITB plasmas was found to be smaller in the D discharges than that in the H discharges. The profiles of the Ti, the electron density, and the impurity of the high Ti plasmas strongly depended on the magnetic configuration and these profiles tended to peaked in the inward-shifted configuration. It was also found that the electron thermal confinement of the electron-ITB plasmas was clearly improved in the deuterium case. The GKV simulation showed the linear growth rate of TEM/ITG reduced in the plasmas with D both for the ion ITB and the electron ITB plasmas and qualitatively agreed with the tendency of the change in the thermal diffusivity obtained from the power balance analysis.
Export citation and abstract BibTeX RIS
1. Introduction
Clarifying the mechanism of the isotope effect on the confinement characteristics is one of the most important issues in the nuclear fusion research area for realizing the controlled fusion reactor. The increased plasma performance by the isotope effect has been a long-standing mystery, and both experimental [1–6] and theoretical [7–15] approaches have been conducted in several devices in order to deepen the understanding of the isotope effect on the plasma confinement.
Confinement improvement is also necessary for realization of high-temperature plasmas, and is one of the most important issues in toroidal devices. Since the first observation of H mode [16], various types of improved confinement modes have been observed in tokamaks and helical/stellarator devices. Of these improved confinement modes, an internal-transport barrier (ITB) is characterized by a steep gradient formation in temperature profiles and a decrease in thermal diffusivity in a plasma core region [17–19].
In the Large Helical Device (LHD), high-Ti accompanied with an ion-ITB (i-ITB) has been achieved in NBI-sustained plasmas [20–24]. The i-ITB observed in the LHD is characterized by centre-peaked Ti profile in contrast with a so-called box-type ITB in tokamaks [17, 25]. The formation of weak negative Er in the core and the strong positive Er in the peripheral region were also found [23]. Electron-ITB (e-ITB) relating to the production of high Te plasmas has been realized in the LHD by strongly centre-focused ECRH beams [26–29]. The radial electric field Er was measured by charge exchange recombination spectroscopy (CXRS) [30] and/or the heavy ion beam probe (HIBP) [31]. The formation of the strong positive Er was observed in the core region [26], which well agreed with the prediction of the neoclassical transport theory. An e-ITB has been observed in other helical devices as summarized in [32], and interest has renewed since the beginning of the operation of the Wendelstein 7-X, with Core Electron Root Plasmas [33].
We initiated the deuterium (D) experiment in March 2017 in order to seek higher performance plasmas and to study the mechanism of the increased performance by isotope effect [34, 35]. The present paper shows the achievement of the high Ti plasmas with D and the comparison results of the confinement characteristics of the ITB plasmas between hydrogen (H) and D obtained in the first campaign of the D experiments in the LHD, and is organized as follows. In section 2, the experimental setup is described. Section 3 treats the extension of the operational regime in high Ti plasmas with several operational optimizations. Section 4 focuses on the isotope effect of the confinement characteristics of the i-ITB plasmas. The comparison of the ion thermal confinement between the i-ITB plasmas with D (W/D) and without D (W/O D), the configuration dependence of the achieved Ti, and the behaviour of the impurity are described. In section 5, the characteristics of the e-ITB formation and the isotope effect on the electron thermal confinement are discussed. The summary is in section 6.
2. Experimental setup
The LHD is the largest heliotron device with a major radius R = 3.9 m, a minor radius a = 0.6 m, a pole number of 2 and a toroidal period of 10 [36–40]. The heliotron configurations are produced by a set of helical winding coils and three sets of poloidal field coils, which are all superconducting magnets. The maximum magnetic field on the axis is ~2.9 T. In the LHD, three negative-ion-based NBIs produce neutral beams with the beam energy of 180 keV and total port-through power of 16 MW for H beam and 8 MW for D beam [41]. The negative-NBIs are tangentially injected into LHD plasmas. The positive-ion-based NBIs were perpendicularly injected for ion heating [42] with low energy of 40 keV for H and 60 keV/80 keV for D at maximum. The total-port through power of the perpendicular-NBIs reaches 12 MW for H beam and 20 MW for D beam. Thus the highest NBI power in total is produced by the combination of the tangential NBIs with H and the perpendicular NBIs with D. A high power ECRH system has been operated for preionization and plasma heating [29, 43, 44]. In the present state, three 77 GHz gyrotrons and two 154 GHz gyrotrons are operational for plasma experiments. All of these gyrotrons can generate more than 1 MW power. The heating capability on the LHD has been upgraded year by year. The simultaneous injection power of the NBI and the ECRH reached 31 MW and 5.4 MW, respectively.
3. Operation optimization for realizing high Ti plasmas
3.1. Wall conditioning using ECRH
Intensive wall conditioning using high power ECRH and/or ICRH with helium gas puffing has been conducted to produce a preferable condition for realizing high Ti plasmas in the LHD [45, 46]. Although the wall conditioning effect on reducing the wall recycling was found to depend on the total input RF energy, and not to depend on whether the RF source was ECRH or ICRH [46], the dependence of RF power on the wall conditioning efficiency has not been clarified. The gyrotrons equipped on the LHD can produce the output power of 1 MW each for several seconds and several hundred kW each for more than 10 s. We compared the wall conditioning efficiency using different RF power/pulse duration of 4 MW/2 s (8 MJ/shot) and 1 MW/40 s (40 MJ/shot). Figure 1 shows the dependence of the Dα emission intensity IDα in the wall conditioning discharge on (a) the number of the ECRH discharge conditioning (ECDC) shots and (b) the accumulated input ECRH energy ΣWECRH. The squares and circles represent the data for 4 MW/2 s and 1 MW/40 s, respectively. The ECRH plasmas for the wall conditioning were produced using 77 and 154 GHz gyrotrons in the presence of the magnetic field Bt of ~2.8 T. Helium was used as the working gas and the line-averaged-electron density ne_fir was maintained around 1 × 10¹⁹ m−3 during each discharge. The numbers of the wall conditioning discharges exceeded 30 for both cases. As can be seen from these figures, the reduction of IDα per conditioning discharge was significant for 1 MW/40 s. Also it was found that the reduction of the IDα scales with the accumulated energy of the injected RF. This means that the effect of the RF wall conditioning does not depend on the RF power but the accumulated RF energy in the present experimental condition. The contents of ions in the ECDC plasmas changed through the series of ECDC operation. The ion ratios of the ECDC plasma (nH:nD:nHe) were (0.07:0.51:0.42) for the ΣWECRH of 7.2 MJ, (0.03:0.19:0.78) for 250 MJ, and (0.04:0.09:0.87) for 510 MJ.

Figure 1. The dependence of IDα in the wall conditioning discharge on (a) the number of the ECDC shots and (b) the accumulated input ECRH energy.
Download figure:
Standard image High-resolution imageFigure 2 shows the time evolution of (a) the port-through-NBI power PNBI, (b) ne_fir, (c) IDα, (d) the central ion temperature Ti0, and the radial profiles of (e) the electron density ne, and (f) Ti for three plasmas produced in the different wall condition. Those plasmas were produced without wall conditioning, after the wall conditioning of 35 shots with 4 MW/2 s, and after the wall conditioning of 32 shots with 1 MW/40 s. The variable reff/a99 in the horizontal axis of the figures 2(e) and (f) is the effective minor radius normalized by the averaged minor radius where 99% of the electron stored energy is confined. The plasmas were sustained using high power NBI under the magnetic configuration of Rax = 3.6 m and Bt = 2.85 T with the toroidal magnetic field direction of counter clockwise (CCW), where Rax is the magnetic axis position in vacuum. In order to inject the highest heating power possible, the tangential and perpendicular NBIs were operated using H and D beams, respectively. After the ECDCs, the Dα intensity was clearly reduced during the discharges and higher Ti was obtained compared with no ECDC case. The ne profile was modified to the peaked shape from the hollow shape due to the application of the ECDC. Also, the lower IDα, the higher Ti, and more-peaked ne profile were realized in the discharge after the 32-shots of 1 MW/40 s ECDC compared with the discharge after the 35-shots of 4 MW/2 s ECDC. This was due to the lower-recycling condition realized by higher energy input of ECDC, as shown in figure 1(b).
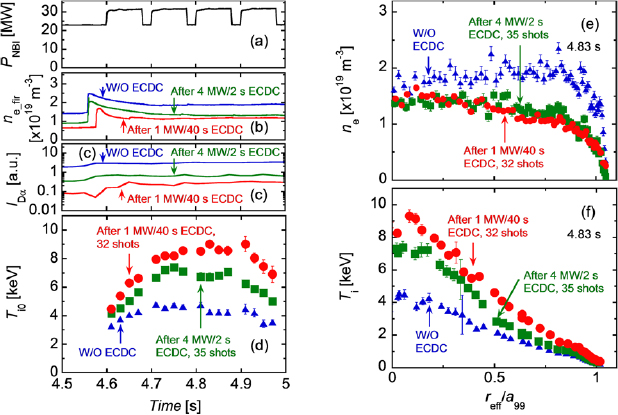
Figure 2. The time evolution of (a) PNBI, (b) ne_fir, (c) IDα, (d) Ti0, and the radial profiles of (e) ne, and (f) Ti for three plasmas produced in the different wall condition. Those plasmas were produced without wall conditioning, after the wall conditioning of 35 shots with 4 MW/2 s, and after the wall conditioning of 32 shots with 1 MW/40 s.
Download figure:
Standard image High-resolution image3.2. Configuration dependence on the high Ti plasma performance
The magnetic configuration is also the control knob of the plasma performance optimization because the heating profile, the plasma volume, the heat/particle transport, the MHD activities, and the other confinement characteristics were widely changed depending on the magnetic configuration in the LHD [47–53]. Figure 3 shows the radial profiles of (a) ne, (b) Te, and (c) Ti sustained using D gas puff and PNBI ~ 20 MW with all D beams. The circles are the data for the magnetic configuration of Rax = 3.6 m/Bt = 2.85 T (CCW) and the squares are the data for the inward-shifted configuration of Rax = 3.55 m/Bt = 2.89 T (CCW). No wall conditioning was conducted in advance of these discharges. Although the Te profile was similar between these two configurations, higher Ti with the steeper gradient in the plasma core was obtained for the inward-shifted configuration with higher ne. The ne profile in Rax = 3.6 m was hollow shape like that W/O ECDC shown in figure 2(e). On the other hand, the ne profile was found to be peaked for the inward-shifted configuration even though the wall conditioning was not applied. The lower Te/Ti and the peaked ne shape contribute to reduce the linear growth rate of ITG/TEM. A more detailed configuration dependence of high-Ti plasma performance is shown in section 4.3.

Figure 3. The radial profiles of (a) ne, (b) Te, and (c) Ti in the D plasmas for the magnetic configuration of Rax = 3.6 m (circles) and for the inward-shifted configuration of Rax = 3.55 m (squares).
Download figure:
Standard image High-resolution image3.3. Optimization of the impurity quantity
Turbulence transport theories predict that a certain amount of impurity contributes to stabilizing an ITG mode [54–56] due to the increase in the effective nuclear charge. Actually, high Ti plasmas have been obtained using impurity pellet injection [57, 58]. In the LHD, the quantity of the injected impurity can be actively controlled by changing the size of the impurity pellet [57, 58]. The optimum carbon density for minimizing the ion thermal diffusivity was found in the previous research in the LHD [58]. Here, the result of the impurity quantity optimization aiming for realization of higher Ti plasmas is shown. Figure 4 shows the dependence of Ti0 on the number of the carbon atoms injected using the impurity pellet injector. The magnetic configuration was fixed at Rax = 3.6 m and Bt = 2.85 T (CCW). The data were obtained shot by shot using carbon pellets of different sizes. The optimum quantity of injected carbon for obtaining the higher-Ti plasma was found at around 0.7 × 10²⁰ both for the plasmas W/D and W/O D through the pellet-size scan experiments.

Figure 4. The dependence of Ti0 on the number of the carbon atoms injected using the impurity pellet injector.
Download figure:
Standard image High-resolution image3.4. Achievement of the highest Ti of the LHD through the optimizations
In the deuterium phase, we achieved the highest Ti ever obtained in the LHD experiments due to the several operational optimizations with the increased NBI power as mentioned in the sections above. Figure 5 shows the time evolution of (a) PNBI, (b) ne_fir, (c) the normalized magnetic fluctuation bθ/Bt, (d) the neutron emission rate Sn, (e) the plasma stored energy Wp_dia, (f) Ti0, and (g) the radial profiles of Ti, Te, and ne of the highest-Ti plasma at the timing of the maximum Ti (t = 4.85 s) in the LHD. The Te and ne data in 0.13 m < reff < 0.53 m were scattered due to the stray light from the in-vessel components, thus the data are omitted in figure 5(g). Slightly inward-shifted configuration of Rax = 3.58 m/Bt = 2.87 T (CCW) was chosen for the experiment. Also, intensive ECDC was conducted before the discharge. The plasma was sustained using high power NBI and the optimized-size carbon pellet was injected at t ~ 4.57 s. The central Ti was gradually increased after the additional NBI from t = 4.6 s and reached the maximum value at t = 4.85 s. The peaked Ti profile with the central value of 10 keV was successfully achieved in the discharge. The achievement of the Ti of 10 keV is a milestone toward realizing a helical reactor, which has an intrinsic advantage for steady state operation, because the Ti value is one of the important ignition conditions.
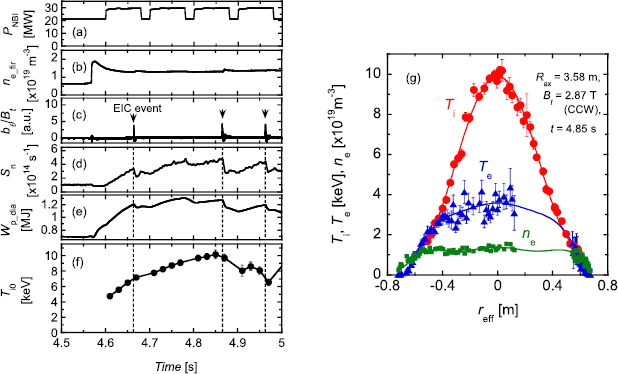
Figure 5. The time evolution of (a) PNBI, (b) ne_fir, (c) bθ/Bt, (d) the neutron emission rate Sn (e) Wp_dia, (f) Ti0, and (g) the radial profiles of Ti, Te, and ne of the highest-Ti plasma in the LHD.
Download figure:
Standard image High-resolution imageThe bursty MHD event, which is a so-called energetic ion driven resistive interchange modes (EICs), was observed during the discharge. The timing of the EIC occurrence is indicated by arrows and dashed lines in figures 5(c)–(f). The EICs are driven by the increased pressure gradient of helically trapped energetic ions, which are mainly generated by the perpendicular NBI [59–64]. The neutron emission rate dropped associated with the EIC event. This indicates the loss of the high energy ions from the plasma. Consequently, the plasma stored energy and the ion temperature both decreased. One of the control knobs of the EICs is ECRH. The threshold of the EIC excitation increases due to the decrease of the mode width, which is proportional to  (β (dpe/dreff)/pe)1/6 [61, 65, 66]. Thus the increasing Te using ECRH is an effective technique to suppress EICs. The suppression of EICs using ECRH was reported in [61] due to the decrease of the mode width. On the other hand, degradation of the ion thermal confinement by ECRH due to the increase of Te/Ti was also reported in several devices [67–71]. The increase in the ion thermal diffusivity χi with increase in the Te/Ti during the stepwise ECRH superposition was also observed in the LHD [72]. The optimization study of ECRH for suppression of EICs with lesser degradation of ion thermal confinement will be conducted in order to realize stationary-sustained higher Ti plasmas.
4. Isotope effect of the confinement characteristics of the ion-ITB plasmas
4.1. Realization of higher-Ti plasma with deuterium
The realization of the high Ti in the deuterium experiments is not only due to the increased NBI power and the operational optimizations but also to the improvement of the ion thermal confinement of the D plasmas compared with the H plasmas. Here, the comparative results of the confinement characteristics between plasmas W/O D and W/D are shown.
Figure 6 shows the time evolution of (a) PNBI, (b) ne_fir, (c) Wp_dia, (d) the central electron density ne0, (e) the central electron temperature Te0, (f) Ti0, and (g) the radial profiles of Ti at the timing of the maximum Ti for the typical high Ti plasmas W/O D and W/D. The magnetic configuration was Rax = 3.6 m/Bt = 2.85 T (CCW) both for these discharges. The carbon pellet with cylindrical shape (ϕ = 1.0 mm, l = 1.0 mm) was injected at t ~ 4.57 s. The injected number of the carbon atom by the pellet is ~0.7 × 10²⁰ and is optimum for obtaining high Ti plasmas as shown in figure 4. The increment of the electron density due to the injected carbon pellet is evaluated as ~1.4 × 10¹⁹ m−3. The value is consistent with the increment of ne_fir (~1.2 × 10¹⁹ m−3) just after the carbon pellet injection shown in figure 6(b). In [21], the increment of Zeff was shown to be ~1 just after carbon pellet injection, decreasing to ~0.2 due to the formation of the impurity hole with the strong outward convection of the impurity [73–75].
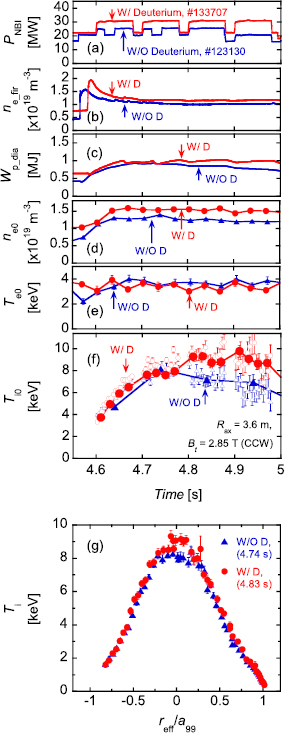
Figure 6. The time evolution of (a) PNBI, (b) ne_fir, (c) Wp_dia, (d) ne0, (e) Te0, (f) Ti0, and (g) the radial profiles of Ti at the timing of the maximum Ti for the typical high Ti plasmas W/O D and W/D.
Download figure:
Standard image High-resolution imageThe higher Ti plasma with higher ne was realized for the plasma W/D. As shown in the figure 6(f), the Ti was higher in the plasma entire region for the plasma W/D, especially the increase in the Ti around the plasma centre was emphasized due to the steepened Ti gradient in |reff/a99| < 0.25 compared with the plasma W/O D. It was also found that the higher Ti was maintained for a longer time for the plasma W/D. That is the Ti0 continued to increase until 4.74 s for the plasma W/O D and 4.91 s for the plasma W/D. On the other hand Te0 appeared to be slightly lower for the plasma W/D. The energy confinement time, which was evaluated as the ratio of the total kinetic energy to the total absorbed heating power from GNET [76–78] minus radiation power, was 49 ms at 4.74 s for #123130 and was 55 ms at 4.83 s for #133707. Please note that the ECRH wall conditioning with Helium gas introduced in section 3.1 was conducted prior to both discharges in figure 6. Thus a significant amount of He contaminated in the plasmas. The ratios of ion densities (nH:nD:nHe:nC) are (0.556:0:0.407:0.037) at 4.74 s for #123130 and (0.169:0.293:0.532:0.005) at 4.83 s for #133707. The comparison of the plasma performance between H and D with higher ion purity is shown in section 4.3.
4.2. Reduction of the ion thermal diffusivity in the plasma with deuterium
Here the plasma profiles and the ion thermal confinement are compared between the plasmas W/O D and W/D introduced in figure 6. Figure 7 shows the comparison of the radial profiles of (a)–(f) ne, Te, Ti, and the gradient, (g) Te/Ti, and (h) the total ion heating power Pi_tot for the plasmas W/O D and W/D. The ion heating power calculated using GNET was slightly lower in the W/D case even though the total port-through NBI power was higher. In the operation W/D, the beam energy of the perpendicular NBI was increased as mentioned in section 2, leading to the enhanced deviation of the beam particles from the magnetic surfaces. This is one of the considered reasons for the decreased absorption power in the plasma W/D. In spite of the lower heating power, higher Ti with higher ne was realized in the plasma W/D. The improvement of Ti and ne were significant in the plasma central region. On the other hand Te profiles were similar between these two plasmas and the value was slightly smaller in the central region for the plasma W/D, leading to the lower Te/Ti in the entire plasma region except for the plasma edge in the case W/D.
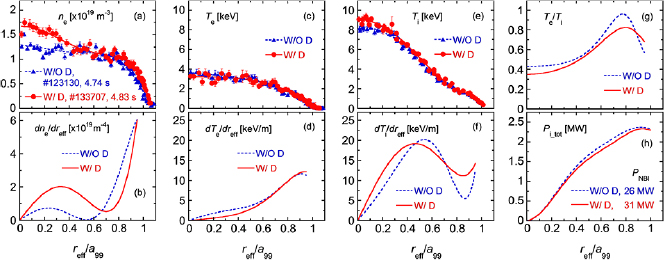
Figure 7. The comparison of the radial profiles of (a)–(f) ne, Te, Ti, and the gradient, (g) Te/Ti, and (h) the total ion heating power Pi_tot between the plasmas W/O D and W/D.
Download figure:
Standard image High-resolution imageThe ion species effect on the thermal confinement in hydrogen and helium plasmas were experimentally investigated in the LHD [79]. In [79], the ion thermal diffusivity was evaluated taking account of the gyro-Bohm factor, which is defined as  [9, 11–15], where Ai is the ion mass and Zi is the nuclear charge of each ion. In the present study, the contribution of hydrogen, deuterium, helium, and carbon were taken into account for the evaluation of the effective ion thermal diffusivity. Here, we assume that the ion temperature is same among the ions and define the effective ion thermal diffusivity χi_eff normalized by the gyro-Bohm factor as
where Q is the heat flux and the index k represents H, D, He, and C. Figure 8 shows the comparison of the radial profiles of (a) the effective ion thermal diffusivity normalized by the gyro-Bohm factor computed using equation (1), and (b) the maximum linear growth rate γmax of ITG and TEM instability normalized by vth_H/Rax between the plasmas W/O D and W/D introduced in figures 6 and 7, where vth_H is the proton thermal speed. The Qk was calculated using GNET and Ti was obtained from CXRS measurement. The linear growth rates of ITG/TEM were calculated using GKV taking account of the effect of the multi-ion species [12]. The effective ion thermal diffusivity was found to be smaller in the whole plasma region for the plasma W/D. The GKV simulation showed that the dominant instability was ITG for the core region and was TEM for the plasma edge region both for the plasmas W/O D and W/D. In the outer core region of 0.6 < reff/a99 the tendency in the radial dependence appeared to be similar between the effective ion thermal diffusivity and the linear growth rates of ITG/TEM. However, the experimentally observed difference in χi_eff for reff/a99 < 0.6 could not be explained only by the present linear simulation. Since the zonal flow generation is not taken into account in the linear simulations, non-linear calculations are required for more quantitative comparisons. Also, the stabilizing effect of the mean Er shear, which is also not included in the present simulation model, may have impacts on the turbulent transport level. They will be addressed in future works.
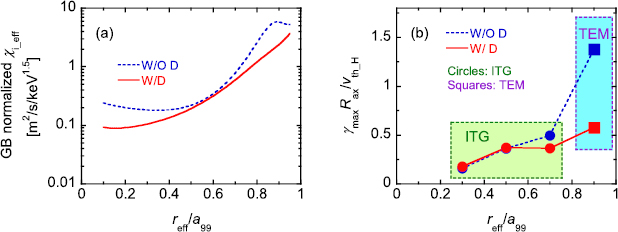
Figure 8. The comparison of the radial profiles of (a) the effective χi normalized by the gyro-Bohm factor and (b) the normalized maximum linear growth rate of ITG and TEM between the plasmas W/O D and W/ D.
Download figure:
Standard image High-resolution image4.3. Comparison of the configuration dependence of the plasma parameters between hydrogen and deuterium plasmas with higher purity
As mentioned in sections 4.1 and 4.2, higher ion thermal confinement was obtained in the operation W/D. However, those comparisons were complicated due to the contamination of the He resulting from the wall conditioning. Here, the plasma performance between H and D was compared with higher ion purity.
Figure 9 shows the ne dependence of Te0 and Ti0 in several magnetic configurations for (a), (b) H, and (c), (d) D plasmas, and the configuration dependence of (e) Te0, and (f) Ti0. The helical coil current in these experiments was fixed as 11.4 kA (CCW) and the magnetic field strength on the axis was 2.82 T (Rax = 3.64 m) ⩽ Bt ⩽ 2.89 T (Rax = 3.55 m). The plasmas were sustained using H-NBIs with H gas puff for H plasmas and D-NBIs with D gas puff for D plasmas. The baking and the glow discharge were conducted just before the experiments. Also the ECDC operations with He were not conducted in the series of the experiment. As a result, the ratios of the ion density nH and nD to the total ion density were over 0.73 and 0.91, respectively, for the target discharges. The total NBI port-through power was fixed as ~20 MW for all target plasmas here. Although the total NBI power was fixed, the power allocation of the tangential beam and the perpendicular beam was different between H and D plasmas. The port-through power of the tangential NBIs and the perpendicular NBIs were ~11 MW and ~9 MW for the H operation and were ~6 MW and ~14 MW for the D operation. The Te0 tended to increase in the inward-shifted configuration both for the H and D plasmas. From the comparison of the configuration dependence between H and D, the Te0 was systematically higher in the H plasmas. In contrast to Te0, the Ti0 showed the strong dependence on the ne and the magnetic configuration, especially in D operation. Higher Ti0 was realized with higher ne in the inward-shifted configuration. Also the obtained Ti0 was found to be higher in D plasmas compared with H with the same magnetic configuration.
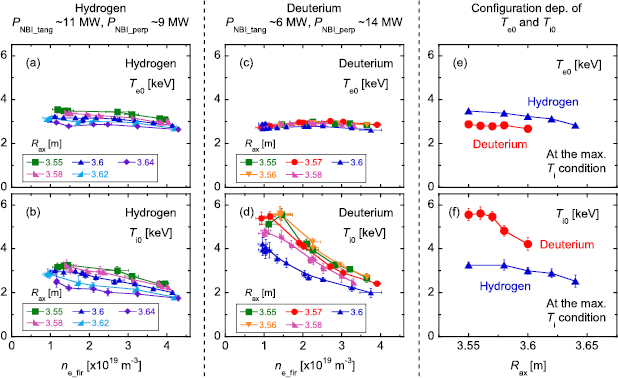
Figure 9. The ne dependence of Te0 and Ti0 in several magnetic configurations for (a) and (b) H, and (c) and (d) D plasmas, and the configuration dependence of (e) Te0, and (f) Ti0.
Download figure:
Standard image High-resolution imageClear difference in the profile of the ne and the impurity was also found between H and D plasmas depending on the magnetic configuration. Figure 10 shows the radial profiles of Pi_NBI_abs, ne, nC, and Ti in several magnetic configurations for (a)–(d) H, and (e)–(h) D plasmas. Here Pi_NBI_abs is the NBI absorption power for ion calculated using GNET. The line-averaged ne of the data in the figures are ~1.2 × 10¹⁹ m−3 (±8%) for H and ~1.1 × 10¹⁹ m−3 (±8%) for D. Carbon pellets were not used in the operation. Thus the carbon in the plasma was originated from the carbon divertor of the LHD. For the D plasmas, the deviation of the trapped particle orbit from the magnetic surface is larger than the H plasmas due to the larger Larmor radius, leading to the lower heating efficiency of the NBIs. Consequently the ion heating power was similar between H and D with the same configuration of Rax = 3.55 m and the 3.6 m even though the port through power of the perpendicular NBIs, which mainly contribute to ion heating, was dominant for the D plasmas. The NBI heating power for ion also tended to increase in the inward shifted configuration. This is due to the decrease of the orbit loss of the NBI ions in the inward shifted configuration [77]. The flat or slightly hollow profile of the ne and the hollow profile of the nC so-called impurity hole was formed for H plasmas. The hollowness of the nC profile became stronger in the outward-shifted configuration and was consistent with the previous experimental results [74]. On the other hand, the shape of the ne and the nC profiles of the D plasmas were found to depend on the magnetic configuration. Although the profiles of the ne and the nC of the D plasma were hollow for the Rax = 3.6 m case as with H case, those were peaked for the inward-shifted configuration of Rax = 3.55 m and were qualitatively different with the H case of Rax = 3.55 m. The intrinsic formation of the peaked nC profile has never observed in the i-ITB plasmas in the LHD using hydrogen. The central Ti and the Ti gradient in the core region were larger in the inward-shifted configuration of Rax = 3.55 m compared with those of Rax = 3.6 m. Interestingly, high Ti, hollow nC, and peaked ne were simultaneously realized in the case of Rax = 3.57 m for the D operation although the bump was formed in the ne profile around reff/a99 = 0.8.
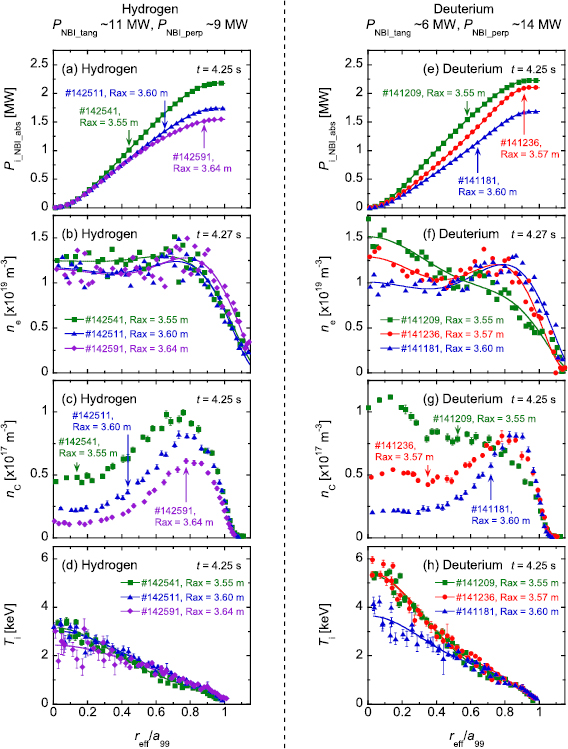
Figure 10. The radial profiles of Pi_NBI_abs, ne, nC, and Ti in several magnetic configurations for (a)–(d) H, and (e)–(h) D plasmas.
Download figure:
Standard image High-resolution imageFigure 11 shows the comparison of the radial profiles of the effective χi normalized by the gyro-Bohm factor between the H and D plasmas for the magnetic configurations (a) Rax = 3.55 m and (b) Rax = 3.6 m. The effective χi clearly reduced for the D plasmas in the plasma entire region both for the configurations of Rax = 3.55 m and 3.6 m. Especially the improvement of the ion thermal confinement in D plasma was significant in the inner half of the minor radius for the configuration of Rax = 3.55 m.
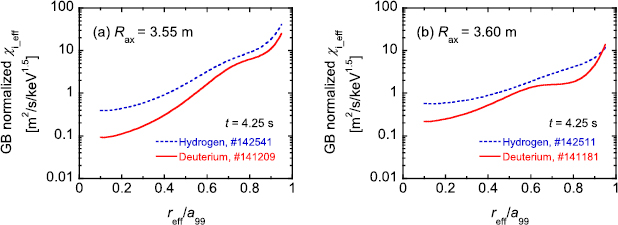
Figure 11. The comparison of the radial profiles of the effective χi normalized by the gyro-Bohm factor between the H and D plasmas for the magnetic configurations (a) Rax = 3.55 m and (b) Rax = 3.6 m.
Download figure:
Standard image High-resolution imageThe configuration dependence of the profile shape of ne, nC, and the ion thermal confinement is summarized in figure 12. Figure 12 shows the configuration dependence of (a) the peaking factor of the ne profile, (b) the peaking factor of the nC profile, (c) the ion temperature gradient, and (d) the effective χi normalized by the gyro-Bohm factor at the reff/a99 = 0.4. The triangles and the circles are the data for H and D, respectively. Here the peaking factor of the radial profiles of ne and nC are defined as the ratio of the value at reff/a99 = 0 to the value at reff/a99 = 0.8. The line-averaged ne of the data in the figures are 1.0–1.3 × 10¹⁹ m−3. From the configuration dependence of the ne peaking factor and the nC peaking factor in the H operation, the ne profiles were almost flat or slightly hollow shape and the hollowness in the nC profile became stronger in the outward-shifted configuration as mentioned above. The Ti gradient became larger in the inward-shifted configuration. In the D operation, the peaking factor of the ne and the nC, and the Ti gradient were significantly increased in the inward-shifted configuration. These tendencies were qualitatively different from those of the H plasmas. The peaked nC profile was also found in the high Ti plasmas W/D using a carbon pellet [80]. As can be seen in figure 12(d), the effective χi was found to be systematically smaller in the D operations than those in the H operations.
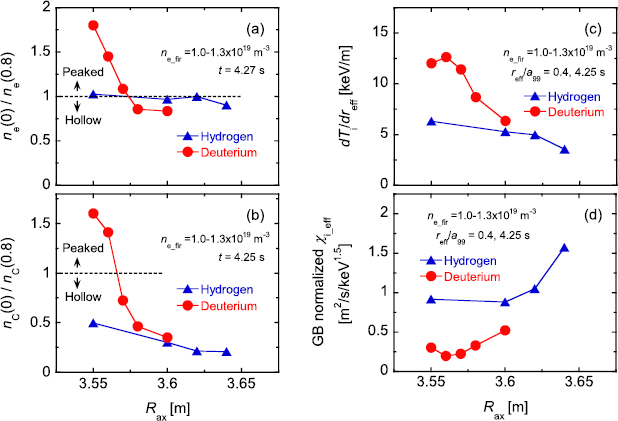
Figure 12. The configuration dependence of (a) the peaking factor of the ne profile, (b) the peaking factor of the nC profile, (c) dTi/dreff, and (d) the effective χi normalized by the gyro-Bohm factor at the reff/a99 = 0.4. The triangles and the circles are the data for hydrogen and deuterium, respectively.
Download figure:
Standard image High-resolution image5. Characteristics of the electron-ITB formation and the isotope effect
5.1. Effect of the current drive direction on the Te profile
In the previous sections, the difference in the ion thermal confinement of the ion-ITB plasmas between H and D was discussed. We also conducted the high Te experiment using high power ECRH with H and D. Here the confinement characteristics of the high Te plasmas associated with an e-ITB are compared between H and D.
Before the comparison of the thermal confinement of the e-ITB plasmas between H and D, the performance of the ECRH plasma depending on the ECRH injection direction is introduced. Figure 13 shows the time evolution of (a) the ECRH injection power PECRH and PNBI, (b) ne_fir, (c) the plasma current Ip, and (d) Te0 and the radial profiles of (e) Te and (f) ne at 4.37 s for three different EC injection conditions. Those plasmas were produced using co ECCD (Co-ECCD), balanced injected ECRH, and counter ECCD (Ctr-ECCD), with the same PECRH of 3.4 MW. The magnetic configuration was Rax = 3.6 m/Bt = 2.705 T and the direction of the toroidal magnetic field was clockwise (CW). Here 'Co-ECCD' means the ECCD injection to increase the rotational transform ι and 'Ctr-ECCD' means to decrease ι. The relation among the direction of Bt, the EC beam, and the driven current is summarized in table 1. The line-averaged-electron density was almost the same value of ~2 × 10¹⁹ m−3 among the three discharges. Although the NBI was superposed on the ECRH plasmas from 3.5 s, this is the perpendicular injection thus the beam had no contribution as NBCD. Unfortunately the ι profiles were not measured in the three cases but the ι is considered to change as intended from the change in the Ip. As can be seen in figure 13(e), the Te profile was clearly affected by the direction of the ECRH injection direction. Centre-peaked Te profile and high Te0 were obtained for the Co-ECCD case. On the other hand, the Te profile was broad for the Ctr-ECCD case. For the balanced injection case, the Te0 was between the value of Co-ECCD and Ctr-ECCD.
Table 1. The relation among the direction of Bt, the EC beam, and the driven current.
| Bt direction | EC beam direction | Driven current direction |
|---|---|---|
| CW | CW | CCW (Ctr) |
| CCW | CW (Co) | |
| CCW | CW | CCW (Co) |
| CCW | CW (Ctr) | |
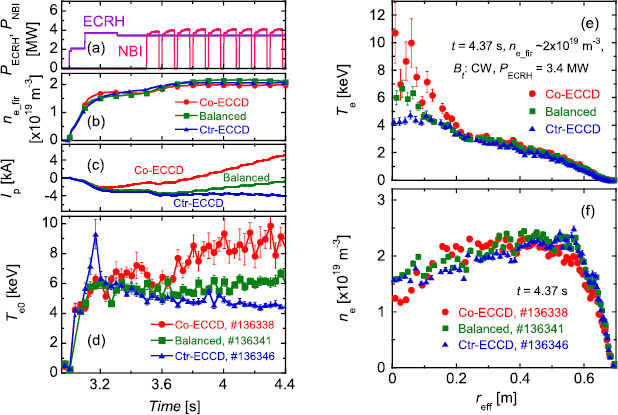
Figure 13. The time evolution of (a) PECRH and PNBI, (b) ne_fir, (c) Ip, and (d) Te0 and the radial profiles of (e) Te and (f) ne at 4.37 s for three different EC injection conditions with the toroidal magnetic field direction of CW.
Download figure:
Standard image High-resolution imageThis Te profile change with the ECCD direction was found not to depend on the polarity of the confinement magnetic field. Figure 14 shows the comparison of the profiles between Co-ECCD and Ctr-ECCD for (a) Te and (b) ι/2π under the magnetic configuration of Rax = 3.6 m/Bt = 2.705 T with the toroidal field direction of CCW, which was opposite magnetic polarity to the operation of figure 13. The ECRH power and the line-averaged-electron density were 2.8 MW and ~2 × 10¹⁹ m−3, respectively. The Te profile was also changed with the ECCD direction and the dependence was the same as that shown in figure 13. That is, the centre-peaked Te was realized for the Co-ECCD case. The ι profile was changed in the plasma central region depending on the ECCD direction. In the previous study, core temperature degradation was observed due to the stochastization of the confinement magnetic field [81, 82]. In those papers, the stochastization in the plasma core region was concluded to be originated from the weakened dι/dr at the low order rational surface of ι/2π = 0.5 and the flattened temperature profile was appeared in the inner area from the position of ι/2π = 0.5. In the present research, higher Te was observed in the low ι shear case with Co-ECCD and the bifurcation point of the Te profile was reff ~0.15 m, which is different from the ι/2π = 0.5 position of reff ~ 0.3 m. Thus, the degradation of the core Te in the Ctr-ECCD observed in the experiment is considered to be a different phenomenon from the stochastization of the magnetic field due to the weakened dι/dr at the position of ι/2π = 0.5. We will continue the investigation for clarifying the mechanism of the Te profile formation depending on the ECCD direction in order to establish the temperature profile control for the maximization and/or the optimization of the plasma performance.
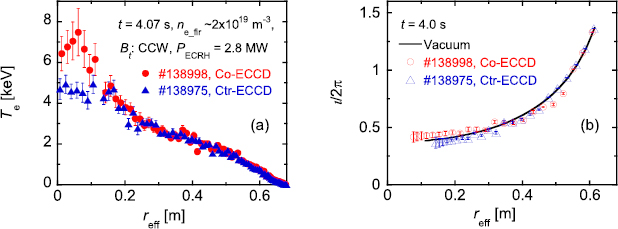
Figure 14. Comparison of the radial profiles of (a) Te and (b) ι/2π between Co-ECCD and Ctr-ECCD with the toroidal magnetic field direction of CCW.
Download figure:
Standard image High-resolution image5.2. Reduction in the electron thermal diffusivity of e-ITB plasmas in the deuterium operation
As introduced in the previous section, higher Te with the strong e-ITB was realized using Co-ECCD in the LHD although the mechanism has not been clarified. In order to investigate the isotope effect on the thermal confinement of the e-ITB plasmas, the target plasmas for the comparison were chosen from the Co-ECCD condition. Figure 15 shows the radial profiles of (a) the absorbed ECRH power density pECRH and the volume integral PECRH, (b) ne, (c) Te, (d) the electron pressure neTe, and (e) the electron thermal diffusivity χe for H and D with approximately the same ne_fir ~2.4 × 10¹⁹ m−3. The magnetic configuration was Rax = 3.6 m/Bt = 2.705 T (CW) both for the H and D plasmas. The purity of the target ions are nH/(nH + nD + nHe) = 0.94 for the H plasma and nD/(nH + nD + nHe) = 0.81 for the D plasma. Unfortunately, one gyrotron had trouble in the D experimental phase and the gyrotron could not be operated in the experiments. Thus the total ECRH injection power became smaller in the D experiments. In spite of the decreased ECRH power for the D plasma, almost the same profiles of Te and neTe with H plasma were realized. Although the ne_fir was fixed as ~2.4 × 10¹⁹ m−3, the ne profile was slightly different between H and D plasma. The χe was evaluated from the power balance analysis and was decreased in reff/a99 < 0.45 both for the H and the D plasma due to the formation of the e-ITB. From the comparison between these two discharges, χe was clearly reduced in D plasma except for the plasma edge. The systematic data for the comparison of the global energy confinement of the e-ITB plasmas between H and D were also obtained with the ne_fir of 1.5–4.7 × 10¹⁹ m−3 and the injection ECRH power of 1–3 MW. The energy confinement in D plasmas was found to be statistically 10%–20% higher than H plasmas [83].

Figure 15. The radial profiles of (a) pECRH and PECRH, (b) ne, (c) Te, (d) neTe, and (e) χe for H and D with approximately the same ne_fir and the different ECH power.
Download figure:
Standard image High-resolution imageThe linear-microinstability simulation using GKV was also applied for the high Te plasmas. Figure 16 shows the dependence of the linear growth rate of ITG and TEM on kyρt at three different positions around the foot point of e-ITB for (a) H and (b) D, where ky is the wave number of the eigenmode perpendicular to the magnetic field line and ρt is the ion thermal gyroradius. The same normalization with vth_H was imposed to the linear growth rates both for the H and the D cases for the direct comparison of the absolute value. The GKV simulation showed the mixture of TEM and ITG depending on the radius. The linear growth rate of TEM/ITG significantly reduced in the D plasma. Note that both the slight difference of Ti gradient and the large difference of ne gradient lead significantly different radial dependence of the linear growth rate, even though the Te profiles are similar in the H and D plasmas. The normalized gradient Te, Ti, and ne at reff/a99 = 0.6 are Rax/ = 8.87 for H and 8.81 for D, Rax/
 = 4.64 for H and 6.80 for D, and Rax/
 = −7.34 for H and 0.124 for D. For further quantitative study, the non-linear simulation taking account of the effect of the mean Er shear is required and will be carried out as future works.

Figure 16. The linear growth rate of ITG and TEM in the e-ITB plasmas for (a) hydrogen, and (b) deuterium.
Download figure:
Standard image High-resolution image
6. Summary
The deuterium operation was initiated in the LHD in 2017. In the first campaign of the deuterium experiments, we successfully extended the high temperature regime in the LHD. The new record of the ion temperature of 10 keV associated with the ITB was achieved due to the upgraded NBI, several operational optimizations such as the wall conditioning, the quantity of the impurity, and the magnetic configuration. In order to achieve higher Ti and to sustain high Ti plasma, the EIC event must be suppressed. The confinement improvement with D also contributed to the increase in the Ti. From the systematic comparison of the transport analyses between the high-purity H and D plasmas with the several magnetic configurations, the effective χi was found to be smaller in the D plasmas. The impurity behaviour of the i-ITB plasmas was found to be different between H and D. The shape of the nC profile depends on the magnetic configuration for D plasmas. The nC profile became peaked intrinsically in the inward-shifted configuration and was different from the hollow nC profile so-called 'impurity hole', which has been usually observed in the i-ITB plasmas in the LHD using hydrogen. With regard to the e-ITB plasmas, almost the same profiles of the electron temperature and the electron pressure between H and D plasma were confirmed in spite of the decreased ECRH power for the D plasma, this was due to the reduction in the χe in D plasmas. The GKV simulation showed the linear growth rate of TEM/ITG significantly reduced in the D plasma with e-ITB. For the i-ITB plasmas, the improvement of the core ion thermal confinement in the plasma with D still has not yet been explained by the linear simulation of the GKV. For further quantitative study, the non-linear simulation taking account of the effect of the mean Er is required. Also, the results from the first campaign of the LHD deuterium experiment presented in the paper represent the first analyses. More detailed studies will be conducted in the near future.
Acknowledgments
This work was supported by NIFS grants ULRR701, 702, 801, 808, 809, KLPR036.