


Abstract
The 2014–2016 JET results are reviewed in the light of their significance for optimising the ITER research plan for the active and non-active operation. More than 60 h of plasma operation with ITER first wall materials successfully took place since its installation in 2011. New multi-machine scaling of the type I-ELM divertor energy flux density to ITER is supported by first principle modelling. ITER relevant disruption experiments and first principle modelling are reported with a set of three disruption mitigation valves mimicking the ITER setup. Insights of the L–H power threshold in Deuterium and Hydrogen are given, stressing the importance of the magnetic configurations and the recent measurements of fine-scale structures in the edge radial electric. Dimensionless scans of the core and pedestal confinement provide new information to elucidate the importance of the first wall material on the fusion performance. H-mode plasmas at ITER triangularity (H = 1 at βN ~ 1.8 and n/nGW ~ 0.6) have been sustained at 2 MA during 5 s. The ITER neutronics codes have been validated on high performance experiments. Prospects for the coming D–T campaign and 14 MeV neutron calibration strategy are reviewed.
Export citation and abstract BibTeX RIS

Original content from this work may be used under the terms of the Creative Commons Attribution 3.0 licence. Any further distribution of this work must maintain attribution to the author(s) and the title of the work, journal citation and DOI.
1. Introduction
The European nuclear fusion research community has elaborated a Roadmap to the realisation of fusion energy in which 'ITER is the key facility and its success is the most important overarching objective of the programme' [1]. In this overview paper, the contribution of the recent (2014–2016) JET experiments with the ITER first wall materials mix (e.g. [2–8]) and the underlying physics understanding with improved diagnostics are reviewed in the context of optimising the ITER Research Plan [9]. Indeed, together with the ITER scenario development for deuterium–tritium (D–T) operation [10–12], a strong focus on JET utilization is pursued for addressing ITER needs and developing a sound physics basis for the extrapolation through first principle and integrated modelling (e.g. [13, 14]), i.e. such as plasma–wall interaction, disruption mitigation taking benefit of the recent installation of a third disruption mitigation valve, L to H mode threshold scaling, core and edge confinement studies with metallic wall, specific ITER relevant scenario aspects, preparation of the ITER non-active phase of operation (hydrogen campaign) etc. Recent progress addressing key issues for the supporting physics research programme accompanying ITER construction is reviewed in five main sections as follows:
- (i)Plasma–material interaction studies with ITER first wall materials (in section 2): The JET ITER-Like Wall experiment provides an insight in the coupling between tokamak-plasma operation and plasma–surface interaction in the unique beryllium and tungsten material environment and acts as a test-bed to verify plasma–wall interaction physics models and modelling tools for ITER.
- (ii)Disruption prediction and mitigation studies for ITER (in section 3): disruptions are considered as the highest programmatic risk in the ITER Research Plan and significant experimental and modelling effort in Europe and JET is reviewed.
- (iii)Physics studies of H-mode access and exit studies with ITER first wall materials (in section 4): high spatial resolution Doppler backscattering measurements and isotope scaling have recently revealed novel insights into the development of the edge transport barrier. These measurements are essential to validate the L–H transition theory and to improve predictions for ITER. In addition, strategies for controlled H-mode plasma termination for ITER have been developed and recently tested on JET.
- (iv)Access conditions to high confinement and ITER scenario development (in section 5): tokamak first wall materials affect plasma performance, even changing the confinement scaling. The operational constraints of a metal wall can prevent plasma energy confinement required for QD–T = 10 on ITER. Progress on JET to mitigate this risk and to understand the confinement modification due the change of the first wall materials is reported aiming at maximizing the core and pedestal performance in stationary condition with the tungsten divertor constrain.
- (v)Nuclear fusion technology in support of ITER (in section 6): The measured D–D neutron fluence and gamma dose rates have been successfully compared with simulations performed with the codes used for ITER nuclear analyses. This is an important step to gain confidence in ITER safety assessment calculations.
To conclude, the prospect for the JET programme towards the integrated preparation of the coming pure tritium and deuterium–tritium experiments is discussed. The scientific benefit to further use the JET tokamak up the start of the ITER scientific exploitation together with its surrounding technology facilities and to provide training facilities for the international teams which will operate ITER will be briefly presented [15].
2. Plasma–material interaction studies with ITER first wall materials
The JET ITER-Like Wall (IJET-ILW) experiment [6] provides an insight into the coupling between tokamak-plasma operation and plasma–surface interaction in the beryllium and tungsten material environment and acts as a test-bed to verify physics models and modelling tools for ITER. Up to now, in the ILW configuration with inertial cooled full tungsten (W) divertor and beryllium (Be) main chamber first wall, JET has been successfully operated with an accumulated plasma discharge time of 61 h since the replacement of the carbon wall in 2011. The bulk tungsten divertor titles have not shown signs of damage. Furthermore, the erosion rate of the W-coatings on divertor tiles (~25 µm W coatings with a 3 µm Mo adhesive layer) does not exceed more than ~2 µm per campaign despite the harsh tokamak conditions with ITER-relevant power loads [16]. Most of the W-coated tile surfaces turned out to be areas of predominant material deposition [17]. Analysis of the intra-ELM and inter-ELM W divertor source has revealed that the W-PFC lifetime is mainly determined by the intra-ELM contribution which governs the total W-sputtering source. The subsequent migration of W within the divertor has been studied by spectroscopy and by post-mortem analysis of erosion-deposition probes and Plasma Facing Components, PFC, tiles from selected poloidal sectors. Transport to remote areas turned out to be an order of magnitude below that in the carbon dominated JET wall configuration. Also, the recent dust collection has confirmed that levels in the JET ILW are two orders of magnitude lower compared with the last campaign in the carbon-wall machine (~200 g) [16]. In addition, we report on recent experiments performed with a new divertor protruding W-lamella installed during the 2014–15 shutdown to resolve the anomalously low heat flux on the exposed tungsten edge inferred from the analysis previous ELM-induced flash melting experiment.
2.1. Tritium retention and removal with JET ILW and impact for ITER
Both recent post-mortem analyses of retrieved PFCs during the last JET shutdown and gas balance studies have confirmed a significant reduction (by factor of 20) of the deuterium fuel retention with the metallic first wall (of the order of 0.3%) compared to the previously used carbon wall [6–8, 16–27]. In JET, the remaining retention fraction is dominated by the retention within intrinsic beryllium co-deposited layers plus a fraction (1/3) due to implantation in the metallic wall. Indeed, the majority of the deuterium fuel is being retained in the divertor region within the deposited Be layers (figure 1 (left)). In addition, WallDYN simulations are able to reproduce the overall retention rate, and, the underlying wall material migration pattern for both the JET-C wall and JET-ILW [26]. WallDYN couples state of the art models for the principal surface processes (e.g. erosion, reflection, implantation, sublimation) with material redistribution data from trace impurity plasma transport models in a fully self-consistent simulation. The simulations for the JET-ILW case also reproduce the gradual formation of mixed Be-W material surfaces after first plasma [27]. Applying the same model and physics process, the impurity migration and resulting fuel species co-deposition in ITER for different wall configurations and background plasmas have been calculated. The simulations show that the ITER tritium-limit of 700 g is reached for a carbon-divertor with only 100–700 full 400 s D–T discharges whereas for the ITER material choice (Be wall and W divertor) between 3000 and 20000 D–T discharges are possible depending on the plasma scenario [26].
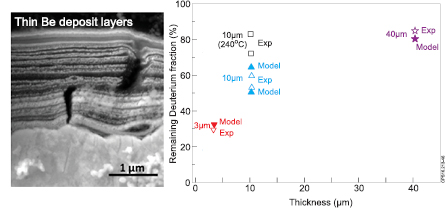
Figure 1. Left: picture of an example of thin Be deposit Layers on the outer corner tile from Scanning Electron Microscopy (deposit thickness: 2–4.5 µm) [25] (Reproduced courtesy of IAEA. Figure from [25]. Copyright 2017 IAEA.); right: the measured and simulated remaining deuterium fraction in the W-divertor and Be wall co-deposited layers versus the deposit thickness after 350 °C/15 h and 240 °C/15 h baking cycles (open squares) (from [30, 31]). The filled symbols correspond to the modelling with TMAP-7 performed for two deposit thickness (from [29]).
Download figure:
Standard image High-resolution imageIn ITER, as seen in JET, co-deposited layers in the divertor are expected to be the driving mechanism behind the tritium inventory [26]. ITER is a nuclear licensed facility and the in-vessel tritium retention will be limited (0.7 kg) to minimize the risks of release of the mobilized tritium during accidents and methods should be developed to recover the remaining tritium [28]. The ITER baseline strategy to recover the trapped tritium in the vacuum vessel is to perform baking of the PFCs, at 240 °C for the Be first wall and at 350 °C for the W divertor [29]. The release of the fuel particles from the co-deposited layers is more challenging than the release of implanted low energy fuel particles from clean Be and W substrates. The fuel release dynamics is slowed down by the deposited layer thickness and its morphology. Moreover, the presence of additional impurities, such as oxygen and carbon or layers with elements being mixed with W, is known to affect the resulted release rate. An important issue is to assess on JET the ITER strategy for tritium removal for very thick mixed co-deposited layers of tritium with beryllium.
To characterise for the first time the deuterium retention and release in ITER-like beryllium co-deposited layers in JET (figure 1), a set of samples were cut from different regions of the divertor and main chamber for studies using Thermal Desorption Spectrometry (TDS) to mimic the nominal baking procedure in ITER [30, 31]. The prepared samples represent PFC locations with varying beryllium co-deposit thicknesses (up to 40 µm). The release kinetics of deuterium have been studied in more detail by varying the temperature ramp-up rates (1 and 10 K min−1) and duration (5 or 15 h) at ITER-relevant bake temperatures during the TDS. Results shown on figure 1 (right) for the thickest beryllium co-deposit (40 µm) in the W-divertor indicate that more than 85% of the deuterium is still retained after 15 h of baking at 350 °C suggesting that baking at such temperatures is relatively inefficient for thick co-deposits [30, 31]. A thinner deposited layer (~5 µm) was found to have ~40% retention after 5 h as also illustrated in figure 1 (right). For the samples of the main chamber beryllium limiter, an even higher (compared to the divertor samples) remaining retention fraction >90% is observed after the baking temperature at 240 °C relevant for the ITER-Be first wall. These measurements are consistent with systematic TDS studies of laboratory reference samples where the deposited layer thickness, material mixing, and co-deposited impurities play an important role in the high temperature retention. Finally, to simulate and extract the parameters affecting retention and release, the TDS results have been analysed computationally with TMAP-7 calculations (https://inldigitallibrary.inl.gov/sti/2906951.pdf), and with rate theory multiscale calculations [29]. By controlling the mixing, the impurity content (Be, C, O), and the deposition thickness, the mechanisms affecting the release have been studied in detail. The ITER relevant baking cycle was simulated up to 15 h, and, the experimental TDS spectra were reproduced with good agreement. Figure 1 (right) shows how a good agreement between the simulation and JET measurement of the remaining deuterium fraction in the W-divertor co-deposited layers is also obtained.
The low deuterium efficiency release at baking temperature of 240 °C and 350 °C for thick deposits (even after 15 h) indicates that the ITER baking cycle should be further optimised (e.g. more frequently during longer intervals) or might not even be sufficient for tritium release and should be complemented by alternative schemes (e.g. arc-discharge method [32] when the vessel is opened, glow discharges, Ion Cyclotron wall cleaning [34, 35]).
Fuel recovery experiments relying on isotopic exchange by ion cyclotron wall conditioning plasmas (ICWC) have been performed on JET. The experiments, exchanging the stored fuel content in the PFC provide insight on the size of the accessible fuel reservoir as well as on RF plasma production in ITER relevant conditions. The use of ICWC during the non-active and active nuclear phases of ITER implies operation at both half (2.65 T) and full (5.3 T) nominal toroidal magnetic field values. Operating the JET antennas at 25 MHz with toroidal field values of respectively B0 = 3.3 T and 1.65 T already mimic on JET the ITER full (5.3 T/40 MHz) and half (2.65 T/40 MHz) field cases with on-axis location of fundamental D+ (resp. H+) resonance layer. A small vertical magnetic field with field lines following the curvature of the inner and outer main chamber PFC (figure 2) is applied with amplitude optimized for maximal poloidal homogeneity (BV/B0 = 8 × 10⁻³) [34]. At the typical ICWC density levels, the RF power is absorbed via coupling to the fast wave, sustaining the plasma predominantly by collisional absorption on electrons and ions [35]. This allows RF plasma for both ITER half or full field conditions over a large range of plasma isotopic ratio, which has been verified on JET-ILW for hydrogen isotope ratios below 25% and above 75%. Furthermore, plasma was also produced successfully at low B0 (range 0.16–0.33 T) and intermediate fields (1.3 T–1.9 T). High plasma densities, peaked on axis (>1018 m−3), were produced on JET by efficient heating of minority ions, observed both in half field and full field scenario with H concentration of respectively 5–10% and 90% (figure 2). It is worth noting that this range of plasma density could also be produced by RF just at the start of the current ramp-up in addition to wall conditioning applications described here. Removal of stored fuel was compared between (i) a repetitive set of 20 ICWC discharges (i.e. 218 s of cumulated discharge time) with 50–240 kW of ICRF power coupled to low density plasma of 0.2–2.4 × 10¹⁷ m−3, and (ii) a set of 13 consecutive L-mode discharges with cumulative plasma duration of ~150 s in limiter and in X point configurations (Ip = 2.0 MA, BT = 2.4 T,  ≈ 4.5 · 1019 m−3, 0.5 MW of ICRH power). The amount of removed fuel via isotopic exchange by ICWC was found to be nearly a factor two larger (6.6 × 10²² atoms) compared to the L-mode references plasmas (3.5 × 10²² atoms) [33]. These results indicate that the proposed ICWC techniques provide access to permanent deposition areas and 52% of the total fuel retention can be removed.
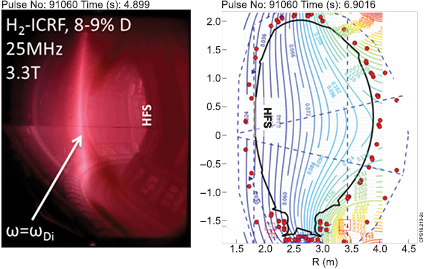
Figure 2. Left: ICRF discharge (IP = 0 A) on JET with minority D heating at 3.3 T/25 MHz—ICRH coupled power is ≈350 kW resulting in dense (>1018 m−3) target plasma production peaked at ω = ωDi. Right: calculation of magnetic flux illustrating 'barrel' shaped poloidal field (~25 mT on axis.) optimized for ICWC at JET.
Download figure:
Standard image High-resolution imageAll beryllium limiters in JET are castellated, see example in figure 3(left), as it is also planned in ITER to ensure integrity and durability under thermo-mechanical and electromagnetic loads. Deposition and fuel retention in the castellated grooves is a potential concern for ITER. It therefore requires specific studies on JET with more than ~170 000 castellations on the ILW corresponding to a total length of the castellation gaps of 7325 m for a surface of 87.9 m2 (for comparison the surface of the plasma facing side is 24.5 m2).
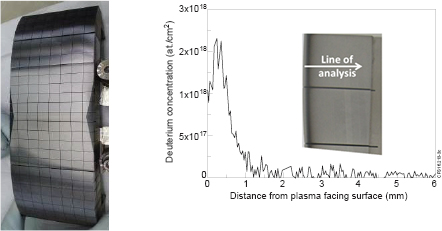
Figure 3. Left: castellated beryllium limiter tile from JET-ILW; right: deposition profiles of deuterium inside the castellated groove of a Be limiter; insert: side of a sectioned tile.
Download figure:
Standard image High-resolution imageTo facilitate studies of the JET castellated limiters (groove width around 0.4 mm) techniques for cutting Be blocks were developed. Selected tiles were sectioned into smaller specimens under a strict temperature control (below 60 °C) in order to avoid the release of hydrogen isotopes. The analyses were performed by means of x-ray diffraction (XRD) in order to determine the phase composition of limiter surfaces and ion micro-beam analysis (µ-IBA) to quantify the content of deuterium and metals (Inconel components: Ni, Cr, Fe and W) inside the castellation. Dedicated experimental procedures had been developed to enable these studies with µ-IBA [24, 36].
On plasma-facing surfaces XRD has clearly shown two distinct composition patterns: Be-W mixed intermetallic compounds on the sides of limiters (deposition zone), whilst only pure Be is detected in the erosion zone. The lack of compound formation in the erosion zone indicates that no distinct changes in thermo-mechanical properties of Be PFC might be expected. It is found that the deuterium fuel is deposited at the very entrance of the castellated groove, within the first 0.5–1.5 mm of the 12 mm deep gap as shown in figure 3 (right) [24]. Deposition profiles for deuterium (figure 3 (right)) and metals have several characteristic features: (i) low D content at the very entrance to the gap, (ii) increase of the concentration with maximum reached at about 0.5 mm and then sharp decrease; (iii) very small content of metals (at least three orders of magnitude lower compared to deuterium). In absolute number, the total deuterium retained within the castellated gaps remains small: 3% of the total fuel inventory. It should also be stressed that the amount of carbon is very low thus confirming the low amount of carbon impurities in JET-ILW. Deposition of deuterium inside the Be castellated structures has been modelled using 3D-GAPS code [24, 37]. Steep profiles have been reproduced for narrow gaps (0.5 mm). The modelling shows very significant increase of deposition (and inventory) with the increase of the gap width, e.g. by a factor exceeding 10 when the width of castellation is increased from 0.5 mm to 2 mm.
2.2. ELM-resolved divertor erosion and impact for ITER
The low core tungsten concentration (of the order of few 10−5) requires a reduction of the tungsten source (e.g. detached plasmas) and transport to the plasma core. Therefore for both operational and PFC lifetime aspects, it is important to understand and model the physics mechanism that governs the erosion of tungsten components with the ITER material mix [38–43]. Tungsten erosion has been quantified in the outer divertor of the JET-ILW environment for a wide range of type I H-mode plasmas in attached divertor conditions [41]. The emphasis is on the time dependence of the tungsten source (within 0.1 ms), where the sources during the transient edge localized modes are time resolved thanks to a novel cross-calibration procedure between low-time resolution divertor spectroscopy (40 ms) and the higher time (0.1 ms) resolution photo multiplier tube measurements through optical filters. Separation of the intra-ELM and inter-ELM W divertor source has revealed that the W-PFC lifetime is mainly determined by the intra-ELM contribution which governs the total W-sputtering source as shown in figure 4 (left). Indeed, during an ELM the W influx (5 × 10²⁰ s−1) could be 50–60 times higher than during the inter-ELM phase. Sputtering during the inter-ELM phases is mainly due to Be ions flowing into the divertor from the main chamber source. The sputtering caused by fuel species (D, T) become significant at higher pedestal electron temperatures (see sputter yield curve versus ion impact energy). The outer divertor W source is larger by a factor of 1.8 ± 0.7 compared to the inner divertor, which is consistent with a factor of ~2 asymmetry in ELM energy loads. The total tungsten source correlates well with power crossing the separatrix since large ELMs, in terms of pedestal energy loss, provide a larger tungsten source. Therefore methods for ELM control are also required to reduce the W source in addition to controling the power loads to the W target. Total tungsten level in the plasma results from a competition between source and tungsten transport processes. In this context, the global plasma tungsten content is found to increase with the ELM frequency (the source term) until approximately 40 Hz where this trend begins to reverse, i.e. the content decreases while the source is still increasing (figure 4 (right)). This is interpreted as a sign of reduction of the tungsten confinement or penetration times at high ELM frequency, i.e. the so-called ELM flushing process used empirically in the scenario development with W-wall [41].
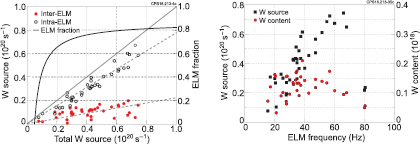
Figure 4. Left: inter and intra ELM W outer divertor sources shown as function of the total W source. Right: The total W content of the plasma and the outer divertor tungsten source as function of the ELM frequency. Reproduced from [41]. © 2016 EURATOM.
Download figure:
Standard image High-resolution imageIn semi-detached or even detached ITER divertor plasmas (i.e. without inter-ELMs W sputtering), we conclude from the JET results that the W source will remain dominated by the intra-ELM phases where high energy ions (Be, D, T) will sputter W from the target plates at each ELM (even for paced ELM), and, during D–T operation the sputtering yield (and resulting W source) will be further enhanced due to triton impact. Therefore, methods for ELM control are required in ITER not only to reduce the energy loads to W target but also to mitigate the W source and divertor erosion. Whether there is an optimum frequency window where both methods are simultaneously efficient remains to be explored for ITER.
The first wall beryllium erosion, beryllium physical/chemical sputtering has been further investigated using 3D local transport and plasma–surface interaction Monte-Carlo modelling (e.g. ERO code [39, 44]). The passive spectroscopy experiments for physical and chemical erosion data [45] were interpreted using the simulations by the ERO code [39, 44]. For the determination of the Be yields and erosion data assessment, dedicated experiments were performed where the limiter plasmas were shifted towards the inner wall with single plasma–wall interaction poloidal contact point [46]. It was shown that the fit of the effective physical sputtering yield (based on molecular dynamic and binary-collision approximation simulations) assuming Be with 50% deuterium in the interaction layer with the PFC is recommended for the erosion modelling of the Be plasma-wetted surfaces [46]. A procedure for numerical (ERO) or analytic [47] generation of angle and energy distributions of sputtering ions on their impact with surface was suggested and proved to be of importance. The accounting of these distributions leads to different effective sputtering yields depending on B-field inclination to the surface and local plasma parameters.
In addition, it has been shown experimentally [45] that chemically assisted physical sputtering contributes to 50% of the total sputtering when the surface temperatures are of the order of 200 °C, but becomes negligible at higher temperatures (~400 °C). It is worth mentioning that, the chemically assisted physical sputtering of Be is a different process compared to Carbon chemical sputtering on the atomistic level and demands a certain energy of the sputtering particles. The surface, atomic and molecular data was validated by reproducing experimental BeI, BeII and BeD A-X band spectroscopic emission during the plasma parameter scan. In addition, an important influence of the coupled RF power from ICRH antenna on erosion (factor 2–3 increase of erosion yield compared to cases without ICRH) was investigated by antenna sequential toggling experiments (switching on and off the antennas) simulated by the ERO code [48]. The analytical procedure necessary for calculating the local effective yields was adapted to take into account an additional surface biasing effect due to RF sheath rectification [49]. It allows using the same sputtering assumptions ('ERO-min' fit) as at the inner wall to reproduce the antenna toggling effect. Several important issues like for instance the fraction of chemically assisted physical sputtering versus physical sputtering, the amounts of Be–D molecules released (fraction of BeD2, BeD3) need further investigation. Some observations with the JET ILW, like the surface temperature and outgassing influence on chemically assisted physical sputtering, are not yet fully understood and reproduced in our modelling which require further development [50]. Finally, we conclude for ITER that simulations performed with the validated 'ERO-min' model for the erosion yields correspond to the most positive ITER first wall life time predictions (4200 ITER QD–T = 10 discharges) [38]. Still, these estimations are to be corrected using the most recent JET ILW experience. For instance the role of CAPS or e.g. detailed plasma-shadowing [44] should be accounted and improved procedure for the local effective yields estimations should be applied.
2.3. Type I-ELM energy flux
The transient heat loads during type I-ELMs are a major threat to ITER and DEMO first wall and divertor materials. Multi-machine scaling of the type I-ELM divertor energy flux density parallel to magnetic field lines on ITER with data from JET (both with CFC and ITER-like walls), ASDEX Upgrade (with CFC and full-W walls) and MAST has been recently proposed [51, 52]. Data from these various devices (figure 5) show an approximately linear dependence of the peak ELM energy density, ε//, (parallel to magnetic field lines) with the pedestal top electron pressure, major radius and a square root dependence of the ELM loss energy. This data set has also been successfully extended to discharges with active ELM control (JET vertical kicks, error field correction coils and pellets, MAST and ASDEX-Upgrade resonant magnetic perturbations operation). Interestingly, the actively controlled type-I ELMs also fit well into the scaling.
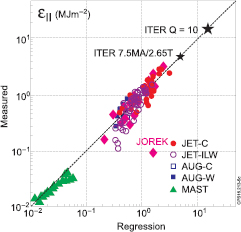
Figure 5. Measured versus scaling of type I-ELMs energy flux density parallel to magnetic field lines in ASDEX Upgrade (both C and W walls), JET (both C and ITER-like walls) and MAST including recent discharges with ELM control techniques. The JOREK simulations for the JET-ILW have been also added and compared with the empirical scaling. From [51, 55].
Download figure:
Standard image High-resolution imageThe result of this proposed scaling gives a range for the peak ELM energy density at the divertor target (when using a ratio of 20 between parallel and target angle, neglecting inclination and castellation of the ITER divertor) of 0.5–1.5 MJ m−2 for ITER QD–T = 10 operation (15 MA, 5.3 T) and 0.125–0.375 MJ m−2 for intermediate ITER operation (7.5 MA, 2.65 T). The latter numbers are close to the maximum nominal surface energy density of 0.5 MJ m−2. However, the presence of thin gaps between monoblocks at the ITER divertor vertical targets result in exposed edges onto which, according to calculations based on a simple model, the heat flux can be focused with shallow edge melting occurring [53]. It is not known today whether or not repeated edge melting would be a problem for ITER operation; experimental studies to address this issue are needed (see section 2.4).

Figure 6. Left: ELM energy losses versus pedestal pressure for multiple JET-ILW pulses: JOREK simulation (star) and experiments (red circles). Right: JOREK simulation of the outer divertor heat flux during ELM crash as calculated with infra-red camera synthetic diagnostic. Reproduced from [54]. © IOP Publishing Ltd. All rights reserved.
Download figure:
Standard image High-resolution imageThe experimental results, the empirical scaling and the ITER prediction have been compared to predictions from the non-linear MHD code JOREK [54–56]. JOREK predictions for the JET–ILW discharges and ITER peak ELM energy density are in agreement with the estimated values obtained from the multi-machine experimental regression (figure 5 where the JOREK simulations have been added) [53, 54]. The ability to predict ELM energy losses and divertor heat fluxes for ITER relies on simulations that can reproduce the experimental ELMs characteristics on present devices. Simulations of ELM with non-linear MHD codes like JOREK have been performed for JET, as well as MAST, ASDEX Upgrade and JT-60U pulses, using diamagnetic terms, at low resistivity, and including multiple toroidal mode numbers [54]. Validation of these simulations is obtained by comparing results against the divertor heat-flux from infra-red camera data, and against ELM energy losses measured by the high-resolution Thomson scattering diagnostic. As shown on figure 6 (left), JOREK simulations using simultaneously low resistivity and low viscosity can reproduce accurately the ELM energy losses for various pedestal conditions [54]. In order to also reproduce the experimental divertor heat fluxes, the essential aspects of simulations are an advanced equilibrium reconstruction, and multiple toroidal harmonics to allow coupling between different peeling/ballooning modes. Simulations at low resistivity and viscosity indicate that the heat flux profile widths with JOREK synthetic IR diagnostic (figure 6 (right)) ranges from 8 cm to 16 cm, averaging at 11.5 cm which is consistent with experimental profile width extracted from IR data. It is worth noting that the simulated heat flux patterns have also repetitive peaks with an isolated 'blobs' structure.
2.4. Divertor heat load investigations for ITER
Another area of concern for ITER is the power handling capability of the castellated tungsten divertor target modules. Indeed, the ITER full tungsten divertor targets will be castellated and made of ~300 000 independent mono-blocks [57]. However, even with optimal shaping finite ion gyro-radius effects during ELMs could lead to local heat loads at geometrically shadowed surfaces sufficient for transient shallow local melting.
One important goal of the JET ITER-like wall is to address these issues taking advantage of its divertor target made of bulk W lamellas and its ability to produce ELM sizes (δW ~ 300 kJ per ELM) comparable to mitigated ELMs expected in ITER. The underlying processes of ELM-induced transient melting including the resulting melt motion and the corresponding evolution of surface morphology by re-solidified melt debris was studied at JET in a first experiment performed in 2013 using a bulk-W lamella (on tile 5) with a protruding sloped surface structure [58–60]. To maximise the ELM-induced temperature excursion, the special lamella was installed in one divertor module with a sharp leading edge exposed to the parallel power flux by slightly lowering the adjacent 8 upstream lamellas (see figure 7 (left)). One limitation of this experiment was that the IR camera did not have sufficient spatial resolution to directly resolve the melt layer temperature. Indeed using the available IR camera view from top, it was difficult to discriminate between the lamella's top and side power loads.

Figure 7. View of the special lamella assembly in the modified divertor module and 3D thermal modelling. Left: leading edge lamella as in the 2013 experiment; right: new special sloped lamella for the 2015/2016 experiment to allow direct temperature measurement by the IR camera system mounted on the top of the machine. The lamella is 5.5 mm wide and the raised section is 20 mm long. Far left: reproduced from [58]. © 2015 EURATOM. Third from left: reproduced from [60]. © 2016 EUROfusion.
Download figure:
Standard image High-resolution imageDue to the limited spatial-resolution the power flux had to be derived by the modelling of the thermal response of the lamella. For this first set of experiments both the local thermal response and the observed melt motion could only be explained under the assumption of a significantly (60–80%) lower heat flux to the exposed leading edge than expected from purely geometrical projection of the parallel heat flux derived from thermography data at standard tile surfaces [58]. The module containing the special lamella has been removed from JET during the 2014–2015 shutdown and photographed. The picture may indicate large number of discrete layers which are possibly driven by the 30 Hz ELMs during the previous melting experiment [60]. The main uncertainty in that experiment resulted from the sub-optimal observation geometry of the infra-red camera system, which viewed the exposed edge from top and therefore did not provide a direct view on the exposed edge. In this context, a new lamella was designed and installed during the 2014–15 shutdown with the main objective to resolve a discrepancy observed in the previous JET transient W-melt experiment with a leading edge exposed to the full parallel heat flux while allowing direct spatially resolved observation of the top surface. This was rectified by the new sloped lamella (see figure 7 (right)), where in the same observation geometry the IR camera system now views directly at the slope exposed to increased heat flux. The new geometry also results in a smaller temperature gradient on the top surface and reduced sensitivity of the analysis to the surface incidence angle of the magnetic field. In the recent 2016 experiments, reproducible 2 T/2.5 MA, 2 MW input power, 2 s lamella exposure, L-mode plasma discharges have been performed [61]. The heat load distribution is computed assuming the optical projection of the parallel heat flux which is determined by iteration comparing synthetic with experimental IR data as illustrated in figure 8. With the improved calculation (figure 8), a fair agreement is obtained between the measured and simulated IR temperatures for three different lamella configurations: standard, sharp leading edge (from the 2013 experiment) and the new special protruding sloped lamella for the 2015/2016 experiment. In the recent 2016 experiments with the new lamella, the directly measured heat load no longer showed a discrepancy in L-mode to the value from geometric projection of the parallel power flux [61], in line with observations from companion experiments at other tokamaks (COMPASS [62] and ASDEX Upgrade [63]). Indeed, concurrently to all these experiments, the originally required ad-hoc assumption of a lower than geometrically deduced power flux could be also rectified for the initial JET transient melt study by improved analysis using a more sophisticated model (full 3D description of the plasma heat load and heat diffusion) for the simulation of the lamella's thermal response [61, 64]. The new results greatly improved confidence in the models used for predictive simulations of the local heat load distribution and of transient melt motion required for the design of optimally shaped castellated ITER divertor target modules [65].
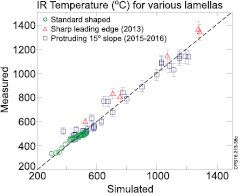
Figure 8. Measured versus simulated (with improved modelling) IR temperatures for three different lamellas: standard, sharp leading edge (from the 2013 experiment) and the new special protruding sloped lamella for the 2015/2016 experiment—from [61].
Download figure:
Standard image High-resolution image2.5. Dust analysis and impact for ITER
Comprehensive and systematic surveys of dust generated in tokamaks have been carried out in order to provide data needed in the licensing process of ITER [66, 67]. In ITER, dust can pose the following issues: (i) safety hazard in the case of loss-of-vacuum accidents, owing to the remobilization of respirable toxic or radioactive dust that has accumulated during operation, (ii) safety hazard in the case of loss-of-coolant accidents, owing to the explosion risk due to hydrogen production by the exothermic oxidation of metallic dust with steam, (iii) operational hazard owing to dust-generated impurities penetrating deep into the core plasma and leading to high radiation losses, (iv) degradation of in-vessel diagnostic components and malfunction of inspection tools, (v) compromise to PFC integrity, for instance by bridging the gaps of castellated PFCs and undermining their resistance to thermo-mechanical stresses. In ITER, the Be first wall is expected to be the main source of dust. ITER-relevant generation mechanisms can be roughly categorized in the following manner: (1) production under steady state conditions mainly delamination of re-deposited Be layers but also arcing, (2) production under transient conditions (unmitigated major disruptions, vertical displacement events, run-away electrons) mainly droplet splashing from molten layers and material ejection during deep melting but also surface cracking and destruction of deposited layers.
In this context, the collection of dust and co-deposits in JET with the ITER-Like Wall are the most relevant information for ITER full-metal device (see figure 9, various pictures of metal particles retrieved from JET during dust collection). Dust collection is performed by two methods: (a) localized sampling using sticky pads from W coated CFC divertor and Be limiter tiles; (b) vacuum cleaning of all divertor modules [22, 68–72]. The amount of loose dust removed by vacuum cleaning of the divertor during the shutdown phases after two main operation periods (2011–2012 and 2013–2014) was respectively 1.4 g (0.06 g m−2 normalised to the divertor surface) and 1.8 g (0.08 g m−2), i.e. over two orders of magnitude less than after the operation of JET with carbon wall which is a positive message for ITER safety issue [25, 69]. These results reveal that steady state dust production was significantly reduced as well as that shallow melting by transients did not create a large amount of Be droplets. It is worth noting that since dust remobilization exhibits a strong size selectivity [70, 71], the collected size distribution does not reflect the generated size distribution. Nevertheless, the quantities of collected dust in JET-ILW are small, these studies are crucial for ITER, because these are unique data from a full metal-wall with the ITER material mix [72]. These activities revealed that metal dust is mainly produced by flaking of the co-deposited layers and from W-coated tiles (which is of no relevance to ITER). In addition, a comprehensive analysis of the collected dust and divertor tiles has been carried out at the International Fusion Energy Research Centre (IFERC) in order to identify dust characteristics such as structures, material components and hydrogen isotope retention [73]. In [68], evidence on the formation of two types of beryllium particles was presented: flakes of co-deposits and small droplets. These two types of beryllium-rich particles are of great importance for ITER. In the case of tungsten-based particles two main forms were found: agglomerates originating from the coatings and spheroids. From the ITER point of view, agglomerates are of secondary importance as no coated PFCs are planned.
The determination of the exact structure and size of Be and W dust will also be useful for the development and benchmarking of codes simulating dust generation and transport. Melting experiments in JET have confirmed the formation of droplets for both Be and W tiles [59, 60, 72] and in situ imaging has already provided indication of the droplet sizes. The planned tile extraction will allow a more detailed documentation of the morphology. The injection velocity, angle and size provide initial conditions to dust transport codes, since the phenomena of droplet and dust generation are decoupled from the physics of their further transport. For the validity of modelling predictions for ITER concerning the dust life-time but also the final dust destination and the formation of accumulation sites, information on the initial size is particularly important since the physics of dust-wall impacts and sticking exhibit a strong size dependence [74, 75].
Progress has been made in the understanding of transient impurity events (TIEs), identified by a sharp increase in radiated power. A clear statistical correlation with disruptions was found, TIE occurrence is more probable during disruption-proceeding discharges [76]. Moreover, an excellent correlation between the TIE rate and dust detection by high resolution Thomson scattering suggests that TIEs are caused by dust. The overall picture is the following [73, 76]: during disruptions the dust inventory is re-distributed and consequently part of the dust population is loosely adhered to the PFCs at the beginning of sequent discharges. Such dust remobilizes and migrates in the plasma, where its ablation releases high-Z impurities.
Finally, the impact of arcing and cracking co-deposits on dust formation and, consequently, on the performance of diagnostic components (i.e. metallic mirrors) has been addressed in [77–79]. The study has proven significant erosion by arcing and melting of coated mirrors. This result should give indication for ITER in the selection and design of diagnostic systems.
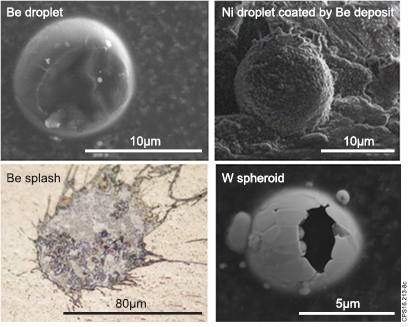
Figure 9. Examples of metal particles retrieved from JET during dust collection: (a) beryllium droplet; (b) nickel droplet covered by beryllium-rich co-deposit (from [79]); (c) beryllium droplet splashed on the surface of a test mirror located in the main chamber (from [79]); (d) tungsten spheroid with recrystallized surfaces, the broken shell reveals empty interior (from [68]). (a) Reproduced from [79]. CC BY-NC-ND 4.0. (d) Reproduced from [68]. © 2015 EURATOM.
Download figure:
Standard image High-resolution image2.6. Divertor neutral modelling
One of the most important systems in a fusion device is the particle exhaust system whose primary objective is density and impurity control as well as helium removal. The torus exhaust vacuum pumping system inherently couples the plasma core and edge conditions with the subdivertor neutral pressure. ITER will utilize cryopumps for plasma exhaust at subdivertor pressures in the range between 1 and 10 Pa for hydrogen plasmas [80]. These conditions translate to varying collisionality regimes in the subdivertor, described by the Knudsen number  , i.e. the ratio of the mean free path to the characteristic length of the system. Thus, the exhausted gas is more likely to be in the continuum regime near the private-flux region (PFR), covering transitional flow in the subdivertor region and ending up in the free molecular flow regime inside the cryopumps [81]. The complexity of its description demands an integrated approach between plasma and vacuum particle dynamics. Particularly for the subdivertor system sophisticated neutral models should be implemented, which not only take into account the geometrical complexity of the ITER divertor but also the capability to describe the neutral–neutral interactions sufficiently well such that the transport coefficients, namely neutral viscosity and thermal conductivity are modelled in a realistic way. In the above framework, the most efficient and suitable numerical method for neutral particle modelling is the direct simulation Monte Carlo method (DSMC), which is a particle-based algorithm for the simulation of gases at the kinetic scale [82]. It solves the non-linear Boltzmann equation by simulating group of model particles that statistically mimic the behavior of real molecules. Typically, in the DSMC approach the simulation of large number of model particles are evolved in small time steps in which their free motion and collisions are uncoupled. Based on this approach, a novel divertor gas simulator code (DIVGAS) is capable of modelling complex neutral gas flows in a tokamak sub-divertor.
For validation of the code, demonstration of its feasibility and general benchmark, experimental data from JET (L-mode plasma cases with the JET ITER-like wall configuration) are successfully replicated over a wide range of density. To be more specific, the pressure gauge readings taken in the subdivertor region, properly corrected for the influence of the low conductance connection pipe so as to get representative values for the subdivertor volume, are well described using EDGE2D-EIRENE calculations as boundary conditions on the plasma side [83]. Figure 10 illustrates a typical example of a pressure plot calculated with the code including the cryopump domain.
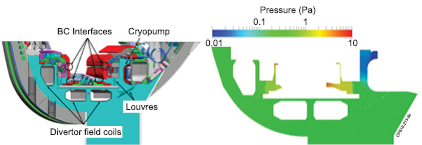
Figure 10. Geometrical representation of JET sub-divertor structure (cyan area, left) and a typical calculated pressure contour plot (right).
Download figure:
Standard image High-resolution imageThe new approach has been successfully applied in the European ITER Physics Programme to describe the ITER subdivertor region with the background plasma calculated by the fluid edge code package SOLPS (B2-EIRENE) [84]. DIVGAS was used to assess the neutral gas recirculation towards plasma and through the gaps behind the vertical targets. The use of DSMC for this kind of problems is first-of-its kind and is considered to be most innovative with an excellent perspective for future applications, in particular for high density detached scenarios as envisaged for DEMO. Following the validation at JET, the effort of benchmarking and testing the capability of DIVGAS code has been continued by modelling the JT60SA subdivertor [85] and, currently on the way, the DEMO particle exhaust system [86].
3. Disruption prediction and mitigation studies for ITER
Disruptions are considered as the highest programmatic risk in the ITER Research Plan which deserves significant experimental and modelling effort in Europe. The disruption mitigation system for ITER is presently in the design phase, with two main candidates: massive gas injection (MGI) and shattered pellet injection (SPI) [87]. The ITER disruption mitigation system is aiming at simultaneously: (i) the reduction of heat loads to prevent the PFC melting, (ii) the reduction of the electromagnetic forces in the in-vessel components and in the vacuum vessel itself, and, (iii) the avoidance or the mitigation of run-away electrons. In ITER, three upper port plugs are allocated for the installation of disruption mitigation system components as well as one equatorial port [87].
3.1. Disruption experiments
Disruption mitigation experiments carried out in different tokamaks have demonstrated the viability of massive gas injection to reduce the heat loads and electromagnetic forces. However, uncertainties in the thermal load mitigation efficiency exist due to toroidal and poloidal asymmetries in the radiation. On JET, a third Disruption Mitigation Valve (DMV) has been brought into operation since 2015, which together with the other two DMVs are at toroidal and poloidal locations mimicking the ITER set-up (figure 11). Mitigation by massive gas injection (MGI) is mandatory for JET operation, and, dedicated experiments have been carried out to address ITER relevant issues related to: (i) the effect of the poloidal location of massive gas injection on the efficiency of disruption mitigation; (ii) the reduction of the radiation asymmetries using an optimised combination of MGI [88–91].
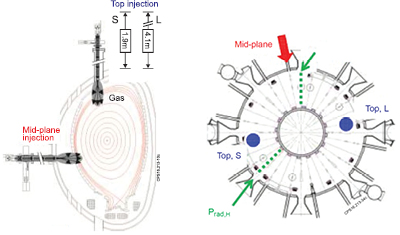
Figure 11. Poloidal and toroidal cross-section of JET with the locations of the three massive gas injection valves and the horizontal (Prad,H) and vertical (Prad,V) bolometers. Reproduced with permission from [89].
Download figure:
Standard image High-resolution imageElectromagnetic loads are the result of halo and eddy currents induced into the vessel structures. The dynamic vertical vessel forces following a MGI have been measured over a plasma current range up to 3.5 MA (for a given magnetic configuration in either low or high triangularity) for all three injection locations separately while the quantity of injected argon has been kept constant (figure 12 (left)) [88, 89]. Over the explored range of plasma current the unmitigated disruption force, which has been determined by deliberate test-VDEs (black line), has been reduced by 33%–40% with MGI injections (figure 12 (left)). The deduced vessel force scaling for each injector system indicates that the choice of the injection location or impurity gas (argon or neon) has no influence on the vessel force reduction and that the mitigation efficiency is not reduced when increasing the plasma current (up to 3.5 MA). The gas amount from the mid-plane injector has been varied at two plasma currents (1.5 MA and 2.0 MA) to determine the optimum impurity injection that is required to minimise the vertical force. A minimum of the disruption vessel force is found with a very low amount of injected impurity injection ( 1 × 10²² particles). The existence of the minimum is interpreted as a trade-off between two competitive effects: the increase of the forces induced by the eddy current with impurity injection (shorter current quench phase) while the vessel force due to the halo current is reduced.
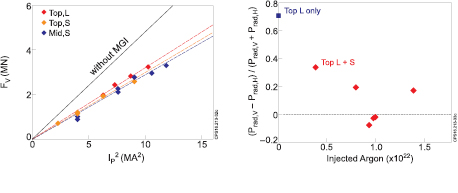
Figure 12. Left: vertical vessel force FV as function of plasma current squared in low triangularity configuration. The black represents the FV for unmitigated vertical displacement events. The dashed lines are the scaling derived from the corresponding data set for each injector. Right: measured radiation asymmetry deduced the horizontal (Prad,H) and vertical (Prad,V) bolometers defined as (Prad,V − Prad,H)/(Prad,V + Prad,H) for dual injections as a function of Ar-amount from Top,S injector while the Ar injected from Top,L is kept constant. Left: reproduced with permission from [89]. Right: reproduced with permission from [88].
Download figure:
Standard image High-resolution imageITER is aiming at radiating at least 90% of the stored thermal energy for mitigating disruptions at high plasma energy content. Initial experiments at JET carried out with one injector on the top of the machine have resulted in a saturation of the radiated energy fraction with increasing impurity injection [91, 92]. In ohmic disruptions, the asymptotic radiation fraction is in the range of 80–85% integrated over the entire disruption and is decreasing with increased ratio of thermal to total energy inside the vessel, explored up to the ITER nominal value of about 0.5 [88–91]. It should be noted that this includes the radiation during all phases of the disruption and the achieved radiated energy during the thermal quench phase might be even lower. Similar saturation levels have been observed when using the other MGI at the top location but with a higher particle throughput (factor 2), or, the one located in the mid-plane. Saturation and therefore highest values of radiation fraction are achieved at relatively low injected impurity quantities ( 1–4 × 10²¹ particles injected before the current quench). However, at present it cannot be concluded, due to diagnostic limitations, whether the saturation level is significantly different from unity or whether it indicates insufficient radiative energy dissipation.
Thermal quench mitigation through an increase of the radiated power fraction is feasible provided that uneven poloidal and/or toroidal distribution of the radiated power do not result in very large localised radiation that will locally enhance the thermal loads to the first wall [87]. The radiation asymmetry results from the presence of the MHD activity (n = 1 mode) and from the localised injection. This effect is enhanced or diminished depending on the relative location between the n = 1 mode island and the MGI-location (e.g. maximum radiation peaking occurs when the injection is done close to the O-point of the n = 1 mode) [93]. The toroidal distribution of the radiated power is characterised by a peaking factor: the ratio of the maximum radiation to the average radiation. With a single injection, it has been found that the toroidal peaking factor of the radiated power is up to 1.8, which could lead to shallow melting of the first wall in ITER. By optimising the massive gas injection combining two injectors this value has been reduced down to a very low level, i.e. 1.2 [88, 89]. This has been obtained by combining the impurity injection from the two top injectors separated toroidally by an angle of 180deg. The minimum in the radiation asymmetry is found by increasing the injected impurity level from one toroidal injector while the injection from the other is kept constant. Remarkably, in a very small range around 1.0 × 10²² injected argon atoms the asymmetry between the two bolometry measurements on JET (horizontal and vertical) at two toroidal locations almost vanishes as illustrated in figure 12 (right) [88, 89]. These experimental findings on JET support the choice of injection locations for the ITER-disruption mitigation system.
3.2. Disruption modelling
First simulations of a D2 MGI-triggered disruption in a purely ohmic JET plasma have been performed with the 3D non-linear MHD code, JOREK [94, 95]. The objective is to progress in the understanding of MGI-triggered disruptions by validating the model on a 'simple' case before applying it to more complicated situations like injecting high-Z impurities and to ITER. A purely diffusive equation for describing the neutral density evolution including ionisation/recombination atomic physics process has been added in the fluid reduced MHD JOREK codes with 3D toroidal geometry treating X-point and SOL. The simulations indicate that the MGI gives rise to a localised over-density front that rapidly propagates in the parallel direction. To reproduce the experimental interferometric data it is assumed that not all the neutral gas enters into the plasma. The MGI also causes the consecutive growth of several magnetic island chains (mainly 2/1 and 3/2) and seeds the 1/1 internal kink mode in cases with q0 < 1. The O-points of all islands are located in front of the gas injection region (outer mid-plane), consistently with experimental observations performed with a set of saddle loops in ohmic JET plasma [91]. In a second phase, a continuous increase of the magnetic islands width leads to a formation of stochastic layer at the plasma edge and to a fast loss of the plasma thermal energy by thermal conduction along the stochastic field lines (see figure 13). A burst of MHD activity and a peak in plasma (thermal quench) current take place at the same time as in the experiment when the assumed resistivity is approaching the Spitzer's resistivity. However, the reduction of magnetic energy is much smaller than in the experiment. The simulated radiation is also much below the experimental level. As a consequence, the thermal quench is not quantitatively reproduced, and, it is likely that larger unstable current gradient, via a sharper cold front, would strengthen the MHD amplitude. Present model limitations are the assumption of a purely diffusive transport of neutrals and the absence of background impurities in the target plasmas that may contribute to the explanation of these discrepancies.

Figure 13. JOREK simulation of a JET disruption triggered by massive gas injection showing stochastisation of the plasma configuration. Poloidal cross section of the electron temperature; electron density, current density and Poincaré plots for the JET pulse 868 87 at t = 5.7 ms after the massive gas injection, i.e. at the start of the thermal quench-from [95]. Reproduced from [95]. © IOP Publishing Ltd. All rights reserved.
Download figure:
Standard image High-resolution imageTo improve the simulation of the neutral gas penetration a new 1D radial fluid code, IMAGINE, has been recently developed and applied to the JET D2 MGI-triggered disruption and the run-away MGI mitigation experiments [96]. The approach that has been developed treats the neutral gas transport within the plasma background according to first principle convective equations and includes ionization, recombination and charge exchange atomic processes for describing the interaction of the neutral fluid with the background plasmas. Indeed, it is found that plasma charge exchange and (to a smaller extent) recombination processes slow down the gas flow at the plasma edge and a shock wave propagates away from the plasma further braking and compressing the incoming gas. As a result, only a small fraction of the gas penetrates into the plasma, and, the time to reach the q = 2 surface (5–10 ms) estimated in the simulations that take into account these atomic processes becomes compatible with the experimental time, i.e. the thermal quench onset time (thermal quench is usually triggered when the cold front reaches q = 2 surface). Another important result related to the question of gas penetration is the unsuccessful attempt to suppress the run-away electrons beam after its formation using MGI on JET [94]. This result is of paramount importance for ITER as JET is the only tokamak where run-away beam suppression using MGI was found to be inefficient. Again, the simulations indicate that the run-away electrons beam is shielded by the surrounding cold plasma when its background density is large enough (typically 1020 m−3) to prevent the neutral gas penetration. The mechanism identified is the gas-plasma friction force due to charge exchange process which is proportional to the plasma background density. Indeed, at lower plasma background density (typically 1019 m−3) the gas penetrates up to the run-away beam. These simulations contribute to explain the difference between JET and ASDEX Upgrade or Tore Supra experiments performed at lower plasma background density where run-away electrons beam suppression is observed with MGI. To further investigate this process experiments have been initiated in view of varying the plasma background densities. In addition, it is foreseen to install during the 2016–2017 shutdown a new Shattered Pellet Injection system (within the frame of an international collaboration) to compare the gas penetration conditions and further elucidate the differences between JET, DIII-D and ASDEX Upgrade experiments in view of ITER extrapolation.
3.3. Disruption prediction
A pre-requisite to trigger any mitigation scheme is to reliably predict in real-time the foreseen disruption event with sufficient anticipation time. The ITER requirement on the success rate will vary for the different operational phases, but is expected to be above 95% for high performance operation with high disruption loads. The detection time has to be longer than about 20–40 ms prior to the disruption to be compatible with the reaction time of the mitigation system. A typical disruption predictor is the amplitude of the locked mode signal: macroscopic instabilities start locking to the wall and the locked mode amplitudes increase during the slowing down of the plasma rotation. When this amplitude reaches a certain threshold (established beforehand), it is interpreted as high probability of an imminent disruption. This signal is used either to attempt a safe landing of the discharge or to trigger mitigation actions. However, a simple amplitude threshold of the locked mode signal does not deal satisfactorily with ITER required prediction rate. The amplitude of locked instabilities, likely magnetic islands, seen as precursors to disruptions has been studied using data from the JET, ASDEX Upgrade and COMPASS tokamaks [97]. It was found that the thermal quench, is triggered when the amplitude has reached a distinct level. This information is used to determine thresholds for simple disruption prediction schemes. To improve the success rate of disruption prediction, machine learning methods that fully exploit the time and frequency domain of the signals have been developed and applied to JET [98]. An Advanced Predictor Of DISruptions (APODIS) was set-up during the first ITER-like wall (ILW) campaign and it is working routinely in the JET real-time network [99]. APODIS was trained with more than 8000 JET discharges corresponding to carbon wall operations and it is being used during the ILW campaigns without any retraining since 2010. The initial result just after the first three ILW campaign (991 discharges) has shown a success rate of 98.36% (with a warming time on average 426 ms prior to the disruption time) and a false alarm rate of 0.92% [100].
The requirement of a large database of disruptive discharges to train the predictor is not compatible with safe ITER and DEMO operations. Therefore, adaptive predictors have been proposed with high learning rates using a limited disruption database [101–104]. The strategy is to retrain the predictors on a wider database only after missed disruption detection. The most recent predictor developed in JET avoids the use of past discharges for training purposes [105, 106]. The objective is to learn in each discharge the non-disruptive behaviour, and, to trigger an alarm when an anomaly appears. The locked mode signal has been used to implement a first disruption predictor based on anomaly detections. A wavelet transform of the locked mode signal is used to retain simultaneously information from both time and frequency domains. Success rates are above 85% and false alarm rates are below 5%. This single signal predictor based on anomaly detection (SPAD) has a disruption detection rate above 85% and false alarm rate below 5% and has been compared not only with the classical locked mode predictor based on threshold (LMPT) but also with the initial APODIS without retraining since the first ILW campaign (figure 14). Figure 14 shows the disruption detection success rate of the three predictors versus the warning time, i.e. the alarm detection time prior to the disruption time. SPAD has a higher disruption detection success rate and earlier detection time. SPAD is being installed in the JET real-time network [107]. The ongoing effort for improvement focuses particularly in the direction of reducing the dispersion of the warning time, at present too large to allow detailed adjustments of the mitigation strategies. To reach this objective it is necessary to adopt new approaches and use a combination of signals. Indeed, the information carried by the locked mode signal is already fully exploited by the new generation of predictors such as SPAD. The possible strategy consists of developing tools capable of classifying the type of disruption, using a nonlinear manifold learning method [108–111].
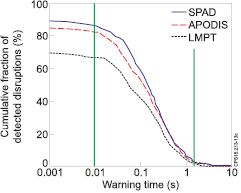
Figure 14. Disruption detection success rate versus warning time, i.e. predictor detection time prior to the disruption time. Three disruption predictor comparisons locked mode predictor threshold (LMPT), APODIS, SPAD (JET ILW campaigns with 566 unintentional disruptions and 1738 non-disruptive discharges). Reproduced with permission from [107].
Download figure:
Standard image High-resolution image4. Physics of H-mode access and exit studies with ITER first wall materials
Access to type I ELMy H-mode operation is an important milestone in the ITER research plan already in the non-active ITER phase of operation. Indeed, H-mode access needs to be demonstrated: (i) to ensure a fast and risk-controlled path to early D–T operation in ITER, (ii) to timely assess the need for an external heating upgrade, (iii) to develop ELM control schemes and H-mode exit strategy. Based on current 0D scaling laws (e.g. in [112]), the most viable path for ITER during the non-active phase to access the type I ELMy H-mode is presently in helium plasmas. If H-modes can be achieved in hydrogen at much lower threshold with the ILW, compared to the carbon wall and to the existing scaling laws (e.g. by changing magnetic configuration), it will significantly impact the ITER research plan. Knowledge of the L–H threshold power is therefore critical to the optimization of the time sequence of the experimental programme towards D–T operation and availability of the ITER systems. In the active phase of ITER operation, the anticipated threshold power on ITER is 53 MW in deuterium and 43 MW in deuterium–tritium mixture (at a density of 5 × 10¹⁹m−3 at 5.3 T) and is extrapolated from a multi-machine scaling [112], based on density, magnetic field and machine size. Many hidden parameters are known to affect PL–H leading to large scatter (factor 4) in PL–H in the present database and induce considerable uncertainty in the extrapolation. Because the available external heating power on ITER (73 MW max) is only marginally above the expected threshold, there is an ongoing effort to understand the underlying physics behind these additional dependencies and to evaluate if any could be used to lower the power threshold on ITER and widen the operational space.
4.1. H-mode access for ITER
Identical discharges with the Be/W wall in deuterium have shown a 25%–30% reduction of the L to H power threshold, PL–H, in ASDEX Upgrade and in JET with metallic PFCs and a minimum as function of density not observed in JET-Carbon wall (e.g. figure 15) [113, 114]. Zeff is shown to be a potential candidate explaining a lower power threshold in JET-ILW when compared to JET-carbon wall [115]. Indeed, it has been demonstrated that the JET-C threshold can be recovered with nitrogen seeding [116]. In addition, the H-mode power threshold in JET-ILW is found to be sensitive to variations in main plasma shape [117], the divertor recycling pattern and the plasma current leading to significant differences (factor of two) compared to 0D scaling laws predictions.
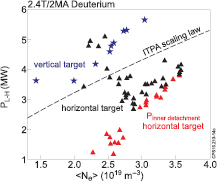
Figure 15. L–H threshold power at 2.4 T/2 MA for two magnetic configuration (vertical and horizontal target blue stars and black triangles) and power threshold for detachment of the inner divertor leg in the horizontal target configuration (red triangles) [117]. The dashed line correspond to the ITPA scaling [112].
Download figure:
Standard image High-resolution imageBetter understanding of the physics causing the divertor configuration effect could potentially open up strategies to reduce PL–H on ITER [117, 118]. An increase in edge Er × B shear through the SOL radial electric field Er is proposed as a mechanism to explain the divertor configuration effect on the L–H threshold [117, 118]. Observations on JET-ILW indicate that configurations with a strong inner/outer asymmetry in the divertor recycling pattern are beneficial for H-mode access at reduced power [117]. Experiments in JET in the ITER-like wall show a factor of two reduction of PLH in a configuration with the outer strike point on the horizontal tile (Horizontal Target configuration) compared to that with the outer strike point on the vertical target (Vertical Target configuration), observed in the high density branch where PLH increases with plasma density. With no significant difference between global parameters in these two magnetic configurations, it is concluded that the difference in PLH is related to a difference of plasma parameters in the scrape-off layer (SOL) and divertor.
EDGE2D-EIRENE simulations reproduced a large difference in experimental target profiles, leading to a significant difference in radial electric field which, in turn, may influence plasma turbulence around the separatrix location via Er × B shear [118]. The difference in observed target temperature profiles indicates a more positive Er in the SOL for the Horizontal Target configuration, creating a higher shear in the outer part of the Er well, and the EDGE2D-EIRENE modelling supports these observations due to a difference in the recycling pattern of neutrals between the two configurations. In addition, as shown on figure 15 a clear correlation between detachment of the inner divertor leg to create highly asymmetric divertor conditions and the L–H transition in the high density branch has been recently reported [117]. These results indicate a strong role of the SOL in the physics of the L–H transition. At the highest densities in the L–H threshold density scans, the detachment of the inner divertor will immediately trigger an L–H transition, which demonstrates that this state, associated with a higher SOL Er, is beneficial for H-mode access. The understanding of the physics behind this mechanism could open up prospects of lowering the L–H threshold on ITER through influencing the divertor and SOL conditions: for instance by creating a dense high recycling inner strike point and hot outer target to increase Er in the SOL.

Figure 16. Stationary zonal flows in Ohmic conditions preceding the L–H transition at different densities (Ip = 2.5 MA, Bt = 3 T with a slow NBI power ramp to identify the transition): (a) Er profiles inferred from Doppler backscattering measurements. (b) Density profiles from reflectometer [120]. Reproduced from [121]. CC BY 3.0.
Download figure:
Standard image High-resolution imageSubsequently, experiments have been conducted in 2014 and 2016 in hydrogen plasmas to investigate the isotope effect on PL–H in JET-ILW. It was found that PL–H is increased by a factor two in the high density branch as it was anticipated, but for the first time it has been observed that the minimum density value is shifted to higher density in experiments performed with ICRH only at 1.8 T/1.2–1.7 MA [119]. Comparison between the hydrogen and deuterium discharges show the transition occurs at similar values of stored energy and closely matched edge density and temperature profiles in the high density branch, but a higher edge temperature is required in the low density branch in hydrogen compared to deuterium. This points to a higher Er shear required to balance a higher mode growth rate. The different isotope effect at low and high density provides a challenging test for L–H theories.
In addition, during the 2016 experiments, the dependence of PL–H on the effective mass has been systematically investigated by scanning the H and D mixture (i.e. isotope ratio, nH/(nH + nD)) both the in low and high density branch of the L–H threshold [120]. It was unexpectedly found, that PL–H has a non-linear dependence with the isotope ratio (for both the two density branches). PL–H is approximately constant over a broad range of H and D mixture 20% ⩽ nH/(nH + nD) ⩽ 80%, with a value which is approximately an averaged between pure hydrogen and pure deuterium plasma. This intermediate PL–H value rapidly decreases (respectively increases) towards the pure D (resp. H) threshold value in the extreme part of the curve 0% ⩽ nH/(nH + nD) ⩽ 20% (resp. 80% ⩽ nH/(nH + nD) ⩽ 100%). We conclude that trace quantity of hydrogen in deuterium (or vice-versa) may leads to significant variation of the L–H threshold. In addition, we have also shown in preliminary JET experiments that an injection of a trace quantity of helium gas (below 10%) in hydrogen plasmas also leads to a reduction of the L–H threshold [120]. These results opens a new route for reducing PL–H in the ITER non-active hydrogen phase by adding a small amount of non-active gas with a higher atomic mass (like helium) leading to a lower L–H threshold. This new approach needs further experimental and modelling investigations. It should also be noted that injection of helium gas may modify the edge conditions (e.g. edge radiation, particle penetration) and their impacts on plasma performance should be further assessed in a near future.
Finally, high spatial resolution Doppler backscattering measurements have revealed novel insights into the development of the edge transport barrier thanks to high spatial resolution measurements of the edge radial electric field, Er (figure 16). For the first time, fine-scale spatial structures in Er, well with a wave number krρi ≈ 0.4–0.8, consistent with stationary zonal flows (ZF) have been observed in a tokamak [120, 121]. These observations imply that stationary ZFs are crucial for the pedestal development in JET. The characteristics of the structures depend with density (figure 16), i.e. as density is increased, the fine-scale spatial structures have reduced amplitude, reduced wavelength and their region of existence moves outward. The zonal flow amplitude and wavelength both decrease with local collisionality, such that the zonal flow E × B shear increases. Above the minimum of the L–H transition power threshold dependence on density, the zonal flows are present during L mode and disappear following the H-mode transition, while below the minimum they are reduced below measurable amplitude during L mode, before the L–H transition. Edge density fluctuation and Er measurements at high and low densities provide insight to the non-monotonic behavior of PL–H with density. Differences in the development of the edge Er profile in the high and low density branches of the transition are also observed, which point to a role for momentum transport in transition dynamics and not just heat transport. After the transition in the high density branch, there is a clear drop in density fluctuation δn/n by 20%–30% in the Er well (whereas smaller change to density fluctuations in the low density branch is reported). The measurements are consistent with a fundamental difference in the turbulence regime in the two density branches [120]. These new measurements are essential to validate the L–H transition theory and improve ITER predictions.
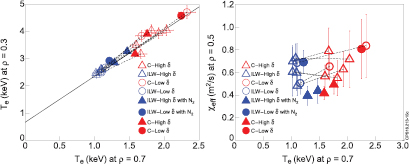
Figure 17. Left: core Te (ρ = 0.3) versus Te (ρ = 0.7), (right) heat conductivities at ρ = 0.5 versus Te (ρ = 0.7). In both figures, the blue and red symbols indicate the plasmas in the ITER-like wall and the carbon wall, respectively. Dashed lines indicate the change from the carbon wall to the counterpart discharge in the ITER-like wall. Blue filled symbols are N2 seeded ILW plasmas, and red filled symbols are their counterparts in CW. Open symbols are without impurity seeding. The triangles and circles indicate high and low δ, respectively. Reproduced from [139]. © IOP Publishing Ltd. All rights reserved.
Download figure:
Standard image High-resolution imageThe L–H transition studies at JET have also revealed an n = 0, m = 1 magnetic oscillation, starting immediately at the L to H transition (called M-mode at JET) [122]. While the magnetic oscillation is present a weak ELM-less H-mode regime is obtained, with a clear increase of density and a weak electron temperature pedestal. The axisymmetric magnetic oscillation is dominantly up-down, and its typical frequency is ~1 kHz. Analysis of magnetic signatures of the so-called I-phase in ASDEX Upgrade [123] reports both similarities and differences between I-phase and M-mode. The frequency of the JET M-mode appears to scale with the poloidal Alfvén frequency: the mass dependency was confirmed in the comparison of hydrogen and deuterium ICRH heated plasmas, the density and current dependencies were studied in deuterium. The MHD oscillation is detected in the pedestal, and modulates particle and heat fluxes to the divertor target.
All these results have direct implications for ITER to optimize the operational window (density, magnetic and divertor configuration, effective impurity, plasma detachment and SOL conditions) for accessing the H-mode at reduced power.
4.2. H-mode exit for ITER
Operation of tokamaks with tungsten plasma facing components in the H-mode confinement regime presents specific challenges regarding the control of the impurity concentration in the main plasma [124–128]. Lack of impurity control can lead to the loss of the H-mode, the radiative collapse of plasmas by W accumulation and increased disruptivity, which is detrimental to ITER operation [128, 129]. Control of W in H-mode plasmas requires, as a first step, the control of W production and its transport into the core plasma through the SOL and edge transport barrier. In addition, even when the concentration of W at the pedestal is kept at low levels, unfavourable core W transport can lead to its uncontrolled accumulation and to loss of the H-mode due increased radiation. Strategies have been developed in present JET experiments to avoid W accumulation in stationary phases of H-mode discharges by controlled ELM triggering to control the edge W density and central RF heating to prevent core accumulation [125, 127–129]. Such schemes are also expected to be effective in ITER, where strong core W accumulation is not expected to occur due to the low particle source provided by the 1 MeV negative-NBI injection, which is in agreement with H-mode experiments with low core source [128]. On the other hand, the control of W transport can be more challenging during the confinement transient phases between L-mode and H-mode and in particular in the transition from stationary H-mode to L-mode [130, 131]. During this phase the pedestal plasma density and temperature decrease as the input power is reduced. This leads to long-ELM free phases causing uncontrolled increase of the edge W density and peaking of the core density profile, which is favourable for impurity accumulation. To avoid this effect, an approach developed in present experiments consist in triggering a fast H–L transition to increase the W flux from the core to the plasma periphery. This approach is, however, not applicable to ITER high Q regimes due to the impossibility to suddenly stop the alpha heating, and, because the fast change in plasma energy would lead to direct contact of the plasma with the inner wall [128, 130]. Therefore a slow decrease of the plasma energy in H-mode termination is required, which is prone to W accumulation.
In order to address W control issues in the H-mode termination phase a series of dedicated experiments have been performed at JET supported by integrated modelling, using the JINTRAC suite of codes [131, 132]. In these experiments several H-mode termination scenarios with constant plasma current have been explored including variation of the decrease of the power ramp rate, gas fuelling level, central ICRH heating with and without active ELM control by vertical kicks and pellets during the H-mode termination phase [131]. JET H-mode plasma termination scenario has been developed to mimic with a slow NBI power ramp-down the expected slow decrease of the plasma energy during the ITER termination phase due to alpha heating in ITER, and, to avoid plasma contact with the inner wall. The experimental results demonstrate the key role of maintaining ELM control and ICRH heating to minimise the W concentration in the exit phase of H-modes with slow (ITER-like) ramp-down of the NBI power in JET. Without ELM control, long ELM free phases occur and W accumulation takes place despite the application of central ICRH heating. The required level of ELM control is achieved at JET through adjustment of gas fuelling level (unlikely to be effective in ITER) or by active ELM control. The latter scenario provides an integrated solution regarding the control of W concentration and plasma energy evolution in the termination of H-modes that can be readily extrapolated to the corresponding phase of 15 MA Q = 10 plasmas in ITER.
Modelling of experimental results carried out with JINTRAC [132] has highlighted the importance of the effect of ELM control on particle transport and edge temperature screening. Without ELM control, the ratio in time-averaged particle versus heat diffusivities in the edge transport barrier is reduced, leading to an increase in ion density relative to the temperature gradients and enhanced inwards neoclassical W transport in the pedestal region. In addition, the dependence of neoclassical core W transport on NBI momentum and particle sources as well as ICRH-assisted heating were found to be crucial for the explanation of observed core W transport properties in the H-mode termination phase. The existing core transport models seem to appropriately reproduce the plasma evolution in general and the accumulation of W in particular in the termination phase of JET H-modes. The model assumptions may thus be adequate for the prediction of the W transport behaviour in the H-mode termination phase in ITER as shown in [133].
4.3. H-mode density limit
In order to understand the mechanisms for the back transition to L-mode confinement at high density, the so-called H-mode density limit, systematic experimental investigations have been performed on JET-ILW by increasing either the deuterium or hydrogen neutral gas fuelling injected from the plasma periphery [134, 135]. The various phases when increasing the density towards the H-mode density limit in deuterium or in hydrogen plasmas are as follow: a stable H-mode regime followed by a degraded H-mode phase, then, a reduction of the H-mode confinement with a dithering cycling phase that ends with a back transition to L-mode edge. We found that the density limit is not related to an inward collapse of the hot core plasma due to an overcooling of the plasma periphery by radiation. Indeed, the total radiated power as well as the radiation power in the main chamber stays almost constant during the H-mode phase until the H to L-back transition. We also found, by comparing similar discharges but fuelled with either deuterium or hydrogen, that the H-mode density limit exhibits a dependence on the isotope mass: the density limit is up to 35% higher in deuterium compared to similar hydrogen plasma conditions. In addition, the density limit is nearly independent of the applied power either in deuterium or hydrogen fuelling conditions. The H-mode density limits measured in various experimental conditions normalised to the Greenwald density are found to be consistent with the predicted values derived from a heuristic model based on the SOL pressure threshold of an MHD instability as recently proposed by Goldston [136, 137]. When applying this model validated on JET-ILW to ITER, the H-mode density limit is estimated to be close to the Greenwald density in ITER D–T operation. To summarise the JET results on the H-mode formation (section 4.1) and back transition to L-mode at high density, we conclude that the JET and ITER operational domains are significantly broaden when increasing the plasma effective mass (e.g. tritium or deuterium–tritium operation), i.e. the L to H power threshold is reduced whereas the density limit for the L-mode back transition is increased.
5. Access conditions to high confinement and ITER scenario development
Tokamak first wall materials affect plasma performance, even changing confinement scaling. The operational constraints of a metal wall can prevent reaching plasma energy confinement required for the achievement of QD–T = 10 on ITER. To gain physics insight, dimensionless physics parameters scans have been performed in low triangularity baseline plasmas. In the course of the JET D–T scenario preparation, a major effort is made to maximise the core and pedestal performance in stationary condition while controlling the divertor surface temperature via strike points sweeping or/and extrinsic impurity seeding focusing on two ITER scenarios, i.e. baseline and hybrid H-mode of operation. Specific ITER relevant scenario aspects (e.g. real time control of divertor detachment, ICRH scenarios, fueling) are reported.
5.1. Thermal core and pedestal confinement with ITER-like wall
5.1.1. Global and core confinement.
After the replacement of the plasma facing components, the global energy confinement of JET plasmas was often found lower compared to similar plasmas in the carbon wall configuration, particularly when scenarios were not properly optimized [138]. These observations have a direct impact on the extrapolation to ITER plasma performance.

Figure 18. Normalized thermal energy confinement versus volume averaged ρ* (left), ν*(middle) and thermal normalised pressure  (right) The blacks symbols (circles or squares) correspond to the JET-Carbon data. In the middle box, dashed line shows the collisionality trend with the JET-ILW as determined in (McDonald et al Proc. 20th Int. Conf. on Fusion Energy 2004 (Vilamoura, 2004) (Vienna: IAEA) CD-ROM file EX6/6). Reproduced from [141]. © IOP Publishing Ltd. All rights reserved.
Download figure:
Standard image High-resolution imageIt is therefore important to find the cause for this deterioration. As the electron temperature at the top of the pedestal is lower in the ITER-like wall configuration, it is not obvious whether the decrease in core temperature is only due to the degradation of the edge confinement or if the core confinement itself has also been degraded. In order to address this question, a systematic interpretative heat transport analysis has been carried out where 10 pairs of 'similar' discharges for the two walls configuration have been selected (i.e. 10 carbon wall discharges and 10 corresponding ITER-like wall discharges). Among the baseline ELMy H-mode plasmas obtained in C-wall at normalised beta below two, the ILW counterpart discharges have been carefully selected to match the time-averaged value of the global plasma parameters, i.e. Ip, Bt, PNBI,  , q95, and δ [139]. Figure 17 (left) and (right) provide an overview of the results where the core electron temperatures and the effective diffusivities at mid-radius have been plotted versus the electron temperature outside the core confinement region at ρ = 0.7 for similar discharges obtained with the two wall materials. Core Te(ρ = 0.3) in the ITER-like wall configuration is lower than the C-wall (figure 17 (left)), but this is systematically accompanied by the temperature reduction at the top of the pedestal in plasma regime with stiff temperature profiles. Indeed, both ITER-like wall and carbon wall core Te data are well represented by the same linear fit, indicating that Te gradients are not significantly modified by the change of plasma facing components. This result implies that the threshold value of the normalized temperature gradient for turbulent heat transport is not decreased in ITER-like wall plasmas. It has also been observed in ITER-like wall discharge that nitrogen seeding can help to recover pedestal Te [140]. Consistently with this observation, figure 18 (left) indicates that the seeding of nitrogen in ITER-like wall discharge has the effect of moving the profiles towards its counterpart discharge in the carbon wall. The electron temperature changes with nitrogen seeding are described with the same linear fit, i.e. keeping similar Te gradient. The dashed lines in figure 17 (right) connect the calculated effective diffusivity at mid-radius of the carbon wall discharges with its ILW counterpart part. The effective heat conductivities, χeff, have been estimated by TRANSP interpretative analysis using the experimental profiles. As shown on figure 17 (right), there is no significant change in χeff (within the error bar for the estimation of χeff) between the similar pair of discharges. This result indicates that the core confinement is not degraded after the PFCs replacement [139].
Three dimensionless scans in the normalized Larmor radius ρ*, normalized collisionality ν* and normalized plasma pressure β have been performed in JET with JET-ILW [141, 142]. In these studies, not only the global thermal energy confinement has been studied (figure 18) but both the core and the pedestal confinement (next section) have been investigated separately [141, 142]. Dimensionless scaling in plasma physics are recognized as an important technique to extrapolate the plasma performance to future fusion machines such as ITER and to compare different tokamak experiments [143]. The analysis of the dimensionless ρ* scan shows that the change from the carbon wall to the metal wall in JET has not modified the ρ* scaling for the global (figure 18 (left)) and local core confinement as indicated on the effective diffusivity. The scaling exponent is consistent with a gyro-Bohm scaling for both wall materials. This shows that the extrapolations of the energy confinement to low ρ* for ITER-relevant predictions remain unchanged. The analysis of the dimensionless ν* scan in JET-ILW shows an increase of the normalized energy confinement with decreasing ν*. The earlier JET-C results have a weaker dependence (figure 18 (middle)). In the core, a strong reduction of the effective diffusivity is observed with decreasing ν* which is similar for the ILW and C-wall. Therefore, the stronger dependence of the global confinement with ν* in JET-ILW is related to an improvement in the pedestal stability at low collisionality (next section). Finally, the analysis of the dimensionless β scan in JET-ILW shows two different behaviours depending on the collisionality (behaviours not observed with the C-wall) as shown on figure 18 (right). At low collisionality (ν*  0.03), JET-ILW normalized confinement has no clear dependence with β, in agreement with earlier scaling. At high collisionality (ν*
  0.15), a reduction of the normalized confinement with increasing β is observed. The degradation of the JET-ILW normalized confinement with increasing β at high ν* is due to the reduction of the pedestal confinement, since the core transport remains constant.
In addition, recent dedicated core heat transport experiments in JET [144–147], based on ICRH heat flux scans and temperature modulation, have confirmed the importance of two transport mechanisms that are often neglected in modelling experimental results, but are crucial to reach agreement between theory and experiment and may be significant in ITER.
The first mechanism is the stabilizing effect that the gradient of the total pressure (including the fast ion component, which may be a large fraction) has on ion heat transport driven by Ion Temperature Gradient, ITG, instabilities [145]. Such stabilization is found in non-linear gyro-kinetic electro-magnetic simulations using GENE [148] and GYRO [149], and is the explanation for the observed loss of ion stiffness in the core of high NBI-power JET plasmas. The effect was recently observed also in JET plasmas with dominant ICRH heating and small rotation, due to ICRH fast ions, which is promising for ITER where low rotation but large fast ion populations are expected. In the central region the electromagnetic stabilization dominates over the ExB flow shear stabilization, which becomes more relevant outside mid-radius. Such non-linear mechanism therefore needs to be included in quasi-linear models to increase their ability to capture the relevant physics.
The second mechanism is the capability of small radial scale Electron Temperature Gradient, ETG, instabilities to carry a significant fraction of turbulent electron heat flux [144, 145, 150–152]. In JET, a decrease in the experimental electron temperature normalised gradient (R ∇ Te/Te) is well correlated with the reduction of the normalised quantity τ = Zeff Te/Ti as illustrated on figure 19. This new experimental observation suggests that ETG destabilisation plays a role in explaining the anomalous electron heat transport. Non-linear single-scale ITG/TEM turbulence simulations performed with the GENE code [148] in the local limit showed that the electron heat flux driven by ITG/TEM turbulence alone is not enough to match the experimental data, and that the observed level of electron stiffness is higher than the simulated one. Including ETG turbulence could provide a better match of the experimental electron heat flux, but it requires taking into account interactions between ion and electron scales, with the ion zonal flows being a saturating mechanism for ETGs. First results of these costly multi-scale simulations, the first of this kind for JET plasmas, indeed indicate a significant fraction of electron heat flux carried by ETGs in the experimental conditions studied.
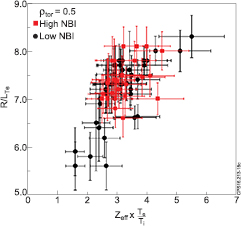
Figure 19. Electron temperature normalised gradient (R ∇ Te/Te) versus τ = Zeff Te/Ti at mid plasma radius.
Download figure:
Standard image High-resolution image5.1.2. Pedestal confinement.
The main conclusion of section 5.1.1 is that the changes in the global confinement with the ILW are ascribed to the modification of the pedestal structure. This important conclusion has motivated significant number of studies to understand the underlying physics (the interplay between plasma, atomic and neutrals physics) and the root cause that affect the pedestal confinement and structure [139, 141, 142, 153–160]. Operation with the ILW usually requires an increase of the level of neutral deuterium gas fuelling at the plasma periphery to control the W influxes into the plasma core. Typically, increasing the gas injection leads to a degradation of the pedestal energy confinement by reducing the pedestal temperature [e.g. 153]. It was empirically found for the ITER baseline scenarios developed in the JET-ILW that efficient pumping conditions, with the strike-points of the magnetic configuration close to the divertor pump duct entrance leading to a reduction of the divertor neutral pressure, are required to recover the fusion performance with an enhancement confinement factor close to unity [11]. The physics mechanisms leading to the pedestal degradation with different neutral content (gas fuelling, or/and, divertor geometry, or/and, first wall materials) is not fully resolved, and, recent progress on this important issue for ITER prediction and operation are reported.
The pedestal structure is studied in terms of pedestal pressure radial width, w, and normalized pressure gradient, α. The recent dimensionless scans have revealed significant different behaviour between the core and pedestal confinement behaviour. Concerning the normalised Larmor radius dependence, the experimental pedestal width and normalised pressures are not affected by the scan of ρ*. These observations are consistent with the simulated pedestal MHD stability boundaries that are also weakly modified with ρ*. These results imply that the ITER pedestal stability will not be negatively affected by the low ρ*. Concerning the β scaling in the ITER baseline regime, two different behaviours have been observed in JET-ILW, depending on the collisionality which is related to the pedestal. At low ν*, an increase of α with  is observed. This is expected, since the increase of β improves the pedestal stability via the increase of the Shafranov shift [156]. Instead, at high ν*, a reduction of α with
  is observed. This result is not expected and indicates that the stability is affected not only by β but also by another mechanism. Finally, the strong dependence with ν* in JET-ILW is related to an improvement in the pedestal stability at low collisionality (figure 20). The Peeling-Ballooning stability analysis shows that this improvement at low collisionality is due to three factors: (i) the increase of the bootstrap current, (ii) the reduction of the pedestal width, and, (iii) the reduction of the relative shift between the positions of the pedestal density relative to the pedestal temperature. The behaviour of the pedestal stability with collisionality might suggest an explanation for the difference in the scaling of the normalized confinement versus ν* observed in JET-C and JET-ILW. Indeed, the pedestal width and relative shift of the JET-C dataset are not affected by collisionality.

Figure 20. Pedestal width normalized to the square root of  verus
verus  . The horizontal line shows the value used in EPED from [142]. Reproduced from [142]. © 2017 EURATOM.
Download figure:
Standard image High-resolution imageIn this context, the relative shift between the electron density and the temperature pedestal position, hereafter referred to as 'pedestal relative shift', seems to play an important role. The pedestal relative shift, recently observed on JET [159] (like on ASDEX-Upgrade [161] and DIII-D [162, 163]) affects the pedestal stability. The observed 'pedestal relative shift' on JET is up to 3.0% of the poloidal flux with the ILW (figure 21 (left)). Analysis of a JET-ILW gas fueling scan performed at constant β has shown that the 'pedestal relative shift' increase is correlated with a reduction in the normalized pressure gradient, α [159]. The edge MHD stability indicates that this effect is due to a reduction of the pedestal stability when the maximum pressure gradient shift closer to the plasma edge [159]. The gas flow increase (and power as well, to maintain beta) leads to an increase of 'pedestal relative shift' since the pedestal density moves outwards with neutral fueling.
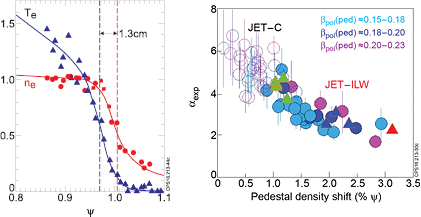
Figure 21. Left: normalised pedestal Te and ne profiles for high gas flow conditions, low δ baseline JET-ILW pulses; (right) α versus the 'pedestal relative shift' for JET-ILW (filled symbols) and JET-C (open symbols) low δ baseline pulses (q95 ≈ 2.6 and 3, ν∗(ped) ≈ 0.1–0.35). The filled triangles correspond to a power scan at constant beta in the hybrid regime for three gas levels: low, medium, high gas injection (green, blue and red resp.) at ν*(ped) ≈ 0.15–0.37 and βpol(ped): 0.21–0.25. Reproduced with permission from [159].
Download figure:
Standard image High-resolution imageComparison of JET-C and JET-ILW data low δ-baseline operational regime within the same range of β and ν* shows that JET-C H-mode regimes have systematically a smaller 'pedestal relative shift' compared to JET-ILW, and, that α values decrease with the relative shift (figure 21 (right)) [159]. Normalized pressure gradient has been calculated for extended dataset of JET-ILW baseline low δ pulses and compared with low δ JET-C pulses. In agreement with the experimental results, stability analysis shows an improvement in the pedestal stability when the relative shift is reduced. Moreover, for similar values of the 'pedestal relative shift', the normalized pedestal pressures, α, are comparable for the two types of wall materials. The origin of the 'pedestal relative shift' is still unclear and is currently under high investigation. Indeed, these experimental findings suggest that different plasma facing components affect the pedestal density position and pedestal stability. Different plasma facing component materials may affect the atomic physics, the SOL transport, the ionization source profile which determine the pedestal density position and the pedestal stability. Therefore, at the moment it is not yet possible to predict the behaviour of the relative shift without disentangling these various physics effects.
The edge ideal MHD stability limit and comparison of the experimental results with the theory is done within the framework of the peeling-ballooning (P-B) model [160, 164, 165]. The pedestal stability of the experimental plasmas is represented in the j–α stability diagram, where j is the current density, and, α the normalized pedestal pressure gradient. When assessing the edge stability, the pressure pedestals with the carbon wall are consistently found close to the P-B limit before an ELM crash. In this case the experimental α is approaching the αcrit which represents the maximum normalized pedestal pressure expected by the P-B model. αcrit is determined by increasing height of the pedestal temperature and then self-consistently calculating the current profile in order to find the marginally stable pedestal temperature height [160]. On the contrary, pedestal measurements with the JET-ILW usually show that the operational points are far from the ideal P-B stability boundary even at the onset of the type I ELM as illustrated on figure 22 (left). In particular, this behaviour is systematically observed in the high-gas/ow-β and high collisionality plasmas [153, 154]. Nevertheless, it is remarkable that the P-B stability analysis shows qualitative trends consistent with the experimental results in the dimensionless scalings experiments [141]. This shows that the P-B model is able to correctly reproduce at least a part of the physics that determines the pedestal stability.
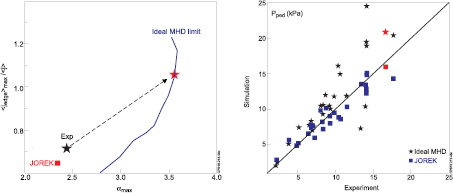
Figure 22. Left: j–α pedestal stability diagram for the JET pulse # 83340 illustrating the distance of the operational point (black star) from the ideal Peeling Ballooning boundary as calculated with HELENA/ELITE-red square is the non-ideal JOREK calculation; (right) Critical pedestal pressures at the onset of the MHD unstable modes deduced from ideal MHD (HELENA/ELITE, black stars) and non-ideal MHD calculations (JOREK, blue squares) versus the experimental pre-ELMs pedestal pressure, Pped. The red square and star correspond to the pulse # 83340 shown in the j–α pedestal stability diagram on the left.
Download figure:
Standard image High-resolution imageThe quantitative disagreement observed in the ILW is still under investigation. A possibility is that the present MHD stability model does not consider kinetic effects such as those related to the ion diamagnetic drift and plasma rotation. Recent studies have investigated these effects by deriving diamagnetic MHD equations for plasmas with fast flow [156]. When applying this new model to calculate the MHD stability boundary including self-consistent plasma rotation in toroidal and poloidal directions, it is found that the distance in the j–α plane between the experimental operating point at the type I ELMs onset and the MHD stability boundary is reduced [157].
In addition non-ideal and non-linear MHD JOREK simulations, which use a low viscosity and resistivity MHD model, have been systematically performed to assess the pedestal pressure at the onset of the MHD modes on a subset of the JET-ILW database [53, 54]. The critical non-ideal MHD limit is determined by running JOREK, starting from a stable pedestal pressure, pped value, and increasing it progressively (together with the corresponding bootstrap current deduced from the Sauter's model) until a MHD mode becomes unstable. For comparison, the critical ideal MHD limits have also been estimated on the same database by increasing pped values (and self-consistent bootstrap current) until the finite-n Peeling Ballooning modes growth rates deduced from ELITE [159, 164, 165] indicate that the stability threshold has been crossed. Figure 22 (right) shows the ideal and non-ideal MHD critical pedestal pressures versus the experimental pre-ELMs pedestal pressures. The agreement with the experiment is significantly improved when using the non-ideal MHD JOREK modelling that includes self-consistently the resistivity, viscosity, diamagnetic effects. The future work consists in investigating which physics effect is dominant to explain the difference between the ideal and non-ideal MHD pedestal pressure limit. This could provide an indication on how to extend the pedestal MHD limits for increasing the fusion performance with the ILW.
5.1.3. Integrated core and pedestal simulations.
The understanding of the first wall material effect on confinement requires a global and coupled description of plasma wall interaction SOL physics together with coupled pedestal and core physics (e.g. [166]). Transport studies in the JET tokamak [167] have shown that the weak confinement degradation with power in high beta plasmas is due to both an increase in pedestal pressure and core pressure peaking by collisionality and supra-thermal pressure effects [145, 167, 168]. In this context, these observations strongly highlight the need for coupled core and pedestal simulations as a first step in the whole integration. This was initially done with the CRONOS suite of codes [169] for C-wall JET and JT-60U discharges with the aim of predicting JT-60SA performance [170]. Integrated modelling suites (CRONOS [169] or JINTRAC [132]) have been coupled to pedestal model with different level of sophistication, e.g. (i) Cordey's 0D pedestal scaling [171] for estimating the pedestal temperature, or, (ii) the more recently developed EUROPED model [172] as an extension of the EPED [173, 174] model for predictive simulation. In these coupled core and pedestal modelling, the simulations could reproduce for the first time the observed trend for the rapid increase in plasma stored energy with heating power and the departure of the IPB98(y,2) scaling at high power thanks to a positive feedback loop between core and pedestal at high beta [167]. Access to high confinement at high beta is therefore consistent with an increase of the pedestal pressure consistent with peeling/ballooning modelling leading to higher core electron temperature and lower core collisionality resulting in a higher electron density peaking. The plasma core energy is further increased due to the reduction of the core plasma turbulence at high beta associated with the presence of fast ions. These non-linearly coupled effects need to be taken into account in our integrated simulation for predicting future fusion D–T performance on JET [175] and on ITER.
5.2. Particle transport
Particle transport in tokamaks has received much less attention than electron and ion heat transport channels. It is still often not treated self-consistently in transport modelling and predictions for future tokamaks. As a consequence, particle transport and fuelling have remained one of the major open questions in understanding the ITER physics. The shape of the density profile has a significant influence on fusion performance and impurity transport.
Extensive database studies in JET showed that density peaking scales with several plasma parameters, the most dominant ones being collisionality ν*, Greenwald fraction and NBI fuelling [176–178]. Collisionality was found to be the dominating parameters in JET. On the other hand, while the database studies suggested the dominant role played the collisionality in peaking the density, other particle transport analyses in JET emphasise the importance of the particle sources [179–181], i.e. the NBI fueling and also the neutral particle fueling inside the pedestal. Core particle transport has been studied in JET by performing various dimensionless collisionality scans both in H-mode and L-mode plasmas [182]. Gas puff modulation technique was exploited to obtain particle transport coefficients. This is the first time to exploit gas puff modulation in JET with diagnostics having good time and spatial resolution. The three-point ν* scans were performed in four different JET conditions: (i) high power ELMy H-mode featuring low β, (ii) hybrid like high β H-mode plasma, (iii) ELMy H-mode plasma in hydrogen and (iv) L-mode with carbon wall. In each scan, roughly a factor five in ν* was achieved by scanning Ip and Bt and the NBI power. Density peaking has been found to increase with decreasing ν* in all H-mode scenarios while in L-mode, no dependency was found. However, both the experimentally determined particle transport coefficients from gas puff modulation data, predictive transport simulations with GLF23 and preliminary gyro-kinetic analysis all emphasise a significant role of the NBI fueling rather than anomalous inward convection in affecting density peaking. The resulting particle diffusion coefficient is small, i.e. Deff/χe,eff ≈ 0.2, consistent with [181]. Under these plasma conditions performed in these scans, all the models and gyro-kinetic analyses show that transport is ITG dominated. Therefore, the anomalous pinch is quite low for all discharges under this collision dominated, for ITG/TEM turbulence, regime. In more collisionless cases, the modelling would give larger turbulent density peaking, making the extrapolation to ITER from these cases less certain. The extrapolation to future tokamaks, like ITER, is the final goal here and based on these results, the density peaking may not be as high as predicted in the earlier database papers [176–179] in the absence of core particle sources.
In addition to core particle transport studies, several edge diagnostics were exploited to diagnose the neutral sources and understanding edge particle transport and fuelling [183]. Experimental analysis suggests that particle source inside separatrix is fairly narrow and it does not contribute much inside the pedestal top. Inward convection of the order of 5 m s−1 at the plasma edge is needed to sustain the steep pedestal. This is also supported by time-dependent EDGE2D-EIRENE modelling that was performed for roughly over one modulation cycle [184].
5.3. Novel three-ion ICRF heating scenarios and potential ITER application
Plasma heating with waves in the ion cyclotron range of frequencies (ICRF) is an efficient method for increasing plasma temperatures in present-day and next-step fusion machines, including ITER [185]. The reference ICRH scheme for ITER burning plasmas is second harmonic heating of fuel tritium ions, assisted with the injection of a few per cent of 3He minority ions at the beginning of the heating phase [186]. Both second harmonic T and 3He minority heating scenarios were successfully tested and validated in the past D–T experiments on TFTR and JET. The use of 3He as a minority ion is also applicable for ICRH heating during the ITER non-active (H and 4He plasmas) and active phases of operation. However, currently the supply of 3He reduces and the industrial demand of this gas is progressively increasing. In view of ITER development, this motivates studies of alternative ICRF scenarios minimizing the consumption of 3He, reducing core dilution or avoiding its use by identifying a different minority species.
A new and efficient ICRH absorption scheme in multi-ion plasmas has been recently proposed [187]. The so-called three-ion ICRH scenarios feature strong absorption of RF power possible at very low concentrations of minority ions. This resonant mechanism of wave-particle interaction hinges on the presence of at least three ion species in the plasma. In addition, a proper plasma mixture has to be chosen such that the L cut-off layer, which is intrinsically present in plasmas with two ion species, is located close to the cyclotron resonance of the third ion species. Thanks to an enhanced left-hand RF field component associated with the mode conversion layer, RF power can be efficiently absorbed even if the third ion species is being present in trace quantities (~0.1%–1%). As such, a larger absorbed RF power per resonant particle can be achieved, enabling three-ion ICRH scenarios to be an efficient tool for generating energetic ions in fusion plasmas.
To validate this conceptual idea, proof of principle experiments have been carried out at JET following initial studies performed on the Alcator C-Mod tokamak [188, 189]. Three-ion minority heating of 3He ions in H–D plasma mixtures, abbreviated in what follows as D–(3He)–H scenario, has been successfully explored on JET with 3He concentrations as low as ~0.2%. Such tiny amounts of 3He ions have been computed to be sufficient for heating H-D plasma mixtures with nH/ne  70%. These RF experiments were carried out in 3.2 T/2 MA plasmas, and up to 4.5 MW of ICRF power was coupled to H–D plasmas in addition to 3.2 MW of deuterium NBI power. The isotopic ratio, H/(H + D), and the 3He concentration were systematically varied to assess the sensitivity of ICRF performance as a function of the chosen plasma composition. Generation of energetic 3He ions with ICRF was confirmed by a several independent measurements: fast-ion loss detector, characteristic γ-ray emission (see figure 23), sawteeth stabilization, excitation of toroidal Alfvén eigenmodes (TAE) instabilities. Gamma-ray emission measurement is a powerful diagnostic, which is routinely used on JET to interpret fast-ion physics effects [190]. Figure 23 shows the reconstructed γ-emission profile for one of the three-ion ICRF pulses on JET. It clearly indicates core localization of 3He energetic ions and associated γ-emission, from nuclear reactions between ICRF-accelerated confined 3He ions and 9Be impurities, intrinsic for JET-ILW plasmas. Further evidence for generating MeV-energy range ions with the D–(3He)–H ICRF scenario in JET plasmas is provided from the observation of TAEs. These modes are excited if there is a significant population of high-energy ions with velocities comparable to the Alfvén velocity in the plasma. TAE 'tornado' modes (TAE activity inside the q = 1 radius) in the frequency range ~310–340 kHz have been recorded. Finally, the effect of ICRF antenna phasing on fast-ion dynamics has been further explored, highlighting the importance of the ICRF-induced pinch effect [191] on the profiles of energetic 3He ions in this original RF scenario and benefit of launching RF waves preferentially in the co-current direction.

Figure 23. Reconstructed gamma-ray emission profile for JET three-ion ICRF heating discharge, visualizing the population of the MeV-range 3He ions. Pulse #90755, D–(3He)–H scenario: 3.2 T/2 MA, f = 32.2–33.0 MHz, PICRF  3.8 MW (+π/2 phasing), ne(0)
  4 × 10¹⁹ m−3, Te(0)
  4.5 keV, 3He concentration
  0.2–0.3%, edge H/(H + D)
  0.85–0.90.
Download figure:
Standard image High-resolution imageThe newly proposed three-ion scenarios bring new applications and opportunities for ICRF operation, including a dedicated tool for fast-ion physics studies and new scenarios of plasma heating for JET and ITER. Indeed, one can take the unique advantage that intrinsic 9Be impurities are present at low levels in JET–ILW as well as on ITER with the beryllium first wall [192]. For instance, having ~2% of 9Be in the plasma core potentially allows accelerating tiny amounts of helium-4 ions in hydrogen plasmas with ICRF (using the resonant scheme 9Be–(4He)–H) and mimic fusion-born alpha particles, without the generation of neutrons in the non-active phase of ITER operation [189]. In the active ITER phase, intrinsic 9Be impurities can be used as a minority for maximizing the fraction of RF power, which is deposited on fuel D and T ions by collisions. For the same amount of coupled ICRF power, full-wave and Fokker–Planck computations predict larger fraction of bulk ion heating for 9Be minority scenario than the commonly considered scenario using 3He as a minority [192]. The T–(9Be)–D scenario could be tested in future D–T experiments in JET-ILW plasmas to check if the intrinsic level of 9Be impurities is sufficiently low (~1%) for this newly proposed ITER scenario to be efficient.
5.4. High-triangularity H-mode operation with JET-ILW
Achievement of high confinement at high density is a necessary condition for reaching the ITER target of QD–T = 10 (HIPB98(y,2) = 1, βN = 1.8 and ne/nGw = 0.85) [193]. High performance H-mode operation at high density strongly relies on the improved edge stability provided by higher plasma shaping. In the case of JET with the C-wall, it was found that high confinement quality (HIPB98(y,2) = 0.9–1) could be maintained at high density (ne/nGW ⩾ 1) in highly shaped plasma (δav ⩾ 0.4) [194] and this was linked with access to the mixed type I/Type II ELMy regime. On the other hand, past experiments in JET with the ILW in 2012–2014 showed that the high puff rates (>1022 D s−1) used to keep W core radiation within acceptable limits in the ELMy H-mode baseline scenario at high-δ (δav ~ 0.4, Ip = 2.5 MA) resulted in a confinement deterioration larger (10–30%) than that observed with the C-wall for similar conditions [138]. Those earlier experiments did not show positive effect of triangularity on global confinement [138]. Only by using nitrogen seeding it was possible to partially recover the confinement at high-δ [140, 167, 195, 196]. The reduced confinement of the high-density H-mode plasmas at high-δ remains one of the least understood results in JET after the change of wall materials. Since a high-δ shape is the reference shape for ITER [193], it is important to identify the physics elements that are limiting the pedestal/core confinement of high-δ plasmas in JET-ILW [197].
Recent 2015–2016 experiments on JET [197] have been conducted using a newly developed high-δ configuration (δav = 0.39) with a divertor geometry optimized for pumping (figure 24 (left)), with both strike points located in the divertor corners (building on the low δ results where confinement is optimised with optimised pumping [198]). In these experiments figure 23 (middle), high confinement H-mode plasmas have been sustained at high triangularity up to 2 MA/2.2 T during 5 s confirming that divertor pumping is a key element to improve confinement in ILW scenarios. These new results represent a significant progess with respect to earlier JET-ILW experimental campaigns [140], where the access to good confinement at high triangularity was restricted to low plasma current discharges (1.4 MA/1.7 T, βN ~ 2–3) [167] that typically operate at lower gas injection rates.
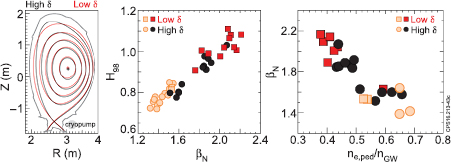
Figure 24. Left: plasma shapes at low and high triangularities with magnetic configurations optimised for divertor pumping; approximate location of the cryopump is indicated; (middle) HIPB98(y,2) Improved confinement factors for low-(square) and high-δ plasmas (closed blacks circles) (2 MA/2.2 T) corresponding to a gas scan at fixed input power (P/PL–H = 2). Data at 2 MA from previous campaigns (before 2014) in light orange circles; (right) βN versus pedestal density normalized to Greenwald density limit ne,ped/nGW from 2015/2016 experiment but with different magnetic configuration.
Download figure:
Standard image High-resolution imageIn optimum pumping conditions, higher pedestal temperatures and pressures (lower collisionality) are obtained at higher triangularity in agreement with edge stability predictions. Higher pedestal temperature via profile stiffness lead to an increase of the total plasma pressure and stable discharges with HIPB98(y,2) ~ 0.9–1 and βN ~ 1.8–2 are now routinely obtained for both plasma shapes at 2 MA but at ne,ped/nGW ~ 0.5 (figure 24 (right)). The density profile of the high-δ discharges remains rather flat, thus the improved confinement is clearly a pedestal effect. This result highlights the importance of operating at low collisionality (high edge current) to recover the beneficial effects of triangularity on pedestal stability when approaching the Peeling-Ballooning limit. However, in contrast to results in JET-C, increasing the gas injection rate to operate at ne,ped/nGW > 0.5 leads to significant (~20%) confinement deterioration (figure 24 (right)) and a higher fELM (up to ~100 Hz), but no signature of the type I/II ELMy regime was found. The differences found between JET-C and JET-ILW H-mode plasmas suggests that the change in wall materials has strongly affected the divertor recycling/radiation patterns in gas fuelled JET-ILW H-mode plasmas, although the mechanism responsible of the observed differences in pedestal confinement has so-far not been identified.
5.5. JET prospects for D–T operation
One of the main objectives of the coming deuterium and deuterium–tritium campaigns is to extend the performance of the ILW at higher plasma current (>2.5 MA) by fully exploiting the JET machine capability at high additional powers in the range of 40 MW with up to 34 MW of NBI power and 6 MW ICRH [4, 5, 12]. The quantitative 0D, high level objective is to reach deuterium plasma scenarios with thermal energy content of the order of Wth(D–D) ~ 12 MJ with HIPB98(y,2) ⩾ 1 generating a stationary fusion D–D neutron rates of RD–D ~ 6 × 10¹⁶ n s−1 (around 15 MW of fusion power) during 5 s [5, 12].
To reach these objectives, two main approaches are being pursued at low triangularity configuration [11, 167], i.e. (i) the ITER baseline scenario by simultaneously increasing the current, toroidal field and applied powers at q95 ~ 3 and βN ~ 1.8–2, (ii) the ITER hybrid scenario at slightly reduced plasma current and higher q95 ~ 3–4 but at βN > 2 to enter in the virtuous cycle where confinement is increased at high beta through the interplay between the core and edge confinement optimisation [167]. With the available applied power in the range of 26–30 MW, the JET performance has been recovered up to a plasma current of 2.5 MA for both the ITER baseline and hybrid scenarios [11]. As part of the scenario development it is also essential for JET and ITER that attention is given to minimize the occurrence of disruptions close to full performance, by developing disruption avoidance techniques [199].
With the goal of simultaneously increasing the fusion performance while controlling the core W content, a dual frequency ICRH heating scheme has been recently explored using both the H and 3He minority heating schemes optimising respectively the electron and ion minority heating [200]. These initial tests were conducted in H-mode at a magnetic field Bo = 3.4 T and plasma current Ip = 2 MA with typically 15 MW of neutral beam power and 6 MW of total ICRH power at 51 MHz (on–axis H minority) and 33 MHz (on-axis 3He minority), of which up to 2 MW were delivered by the ITER-like antenna [201]. In this promising scenario, the lowest bulk radiation with the highest ion temperatures was obtained in the dual frequency ICRH heating compared to the pure H-minority scheme.
The challenge is to reach and sustain the fusion performance while not exceeding the power and energy limits imposed by the inertially cooled W-divertor. In this context, ITER relevant real time divertor detachment control algorithms have been tested on JET [202, 203]. Since Langmuir probes are expected to be part of the ITER divertor diagnostics, this opens possibility to control the divertor target power density through the control of the detachment level using the measured probes saturation current (Isat). In order to provide a proof of principle experiments for ITER, new real-time detachment control algorithms have been successfully implemented and qualified on JET in type-I ELMy H-mode regime [202] (see figure 25 as an illustration). The degree of divertor detachment conditions has been maintained in real time control conditions through the seeding of radiative extrinsic impurities as actuator (e.g. nitrogen seeding in this proof of principle experiment), and, as a sensor the measurements of the saturation current of the divertor Langmuir probes have been utilized [202]. The level of divertor detachment is calculated in real-time by comparing the outer target saturation current measurements to its value at the roll-over (Iroll) (figure 25). The algorithm recently developed at JET is able to control the degree of detachment with either fix or swept divertor strike point in horizontal outer target divertor configuration. In addition, it has been shown that the roll-over conditions for the detachment is found automatically if the control starts in attached divertor conditions. It has also been demonstrated that the gains of the controller are automatically adapted in real-time to avoid oscillations of the controlled system. This control is useful for JET operations with impurity seeding and could be coupled with other real-time controllers such as X-point sweeping to spread the heat load on the divertor tiles and/or real time ELMs control by injecting deuterium neutral gas [202]. Following the success of these first attempts, other tests are foreseen in different divertor configuration (vertical targets) and also with other impurities like Ne, Ar or CD4. This reliable and simple system tested in JET could be one of the options for real-time detachment control to be transferred on ITER provided that reliable Langmuir probes will be installed in the divertor.

Figure 25. ITER relevant real time divertor detachment control for two levels of detachment references in two JET discharges #90517 (left) and #90519 (right) (Bt = 2.2 T/Ip = 2 MA, low triangularity configuration). For each figure, time evolution of the nitrogen injection level (top box), and (bottom box) real-time level of attachment (Isat/Iroll) (blue curve) with pre-roll-over request (green curve) and post-roll-over request (red curve). Reproduced from [202]. © 2017 EUROfusion Universidade de Lisboa Instituto Superior Tecnic.
Download figure:
Standard image High-resolution imageIn addition to the experimental development, a significant modelling program has been initiated with the aim of optimizing the path towards sustained fusion energy production in deuterium–tritium (D–T) [175, 204]. D–T projection of the expected fusion performance has been first calculated based on present plasma scenario but assuming that the experimental profiles and confinement enhancement factors could be translated at higher field, current and applied powers (i.e. temperature and density profile shapes are kept constant with a fixed ratio of the density normalised to Greenwald density when increasing the plasma current). With these assumptions the predicted fusion performance is 7.5 MW for the baseline scenario (at HIPB98(y,2) = 0.8) at high current (4.5 MA) and 13 MW for the hybrid regimes with 40 MW of applied power at lower current (2.5–3.0 MA).
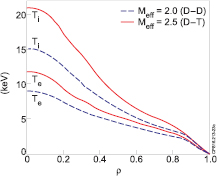
Figure 26. Comparison between the electron and ion temperatures obtained with TGLF transport model for D–D and D–T mixtures with otherwise identical settings (no credit for alpha power). JET Projection at 2.5 MA/2.9 T/40 MW volume averaged density of 3.9 × 10¹⁹m−3. Reproduced from [175]. © IOP Publishing Ltd. All rights reserved.
Download figure:
Standard image High-resolution imageTo complement this simple prediction, more sophisticated time dependent integrated scenarios modelling have been performed [175] using Trap Gyro-Landau Fluid (TGLF) model [205] for the core transport validated on the JET database [204]. For that purpose, high beta domain has been chosen for its optimization due to its low power degradation obtained in low gas conditions, something beneficial for maximizing the fusion power at high input power [167]. An optimum plasma operational point, in terms of electron density, has been found due to the good penetration of the NBI power at reduced average density [176].
More importantly, the impact on turbulence and on fusion power of the effective mass change from D–D to D–T [175] has been explored by performing simulations at maximum power and including D and T species in TGLF model. With exactly the same external heating source profiles (without including the alpha-heating effect to single out the isotope effect on transport modelling), both ion and electron temperatures show a significant increase from D–D to D–T mixtures when including the isotope effect on core transport in TGLF, especially strong for the ion channel (figure 26). This is due to a stronger turbulence stabilization of core turbulence in D–T than in D–D, which also leads to an increase of density peaking for D–T. Therefore, the equivalent fusion power also significantly increases in D–T when including the effective mass change on transport, from Pfus  11 MW to 16 MW. A simple explanation has been proposed by taking into account the mass effect in the effectiveness of the E × B flow shear for quenching ITG transport (it scales as the square root of the ion mass) and has been confirmed by performing D–D and D–T simulations with and without ExB flow shear stabilization [175]. The isotope effect has also been analyzed by performing gyro-kinetic simulations with the GENE code for the ITER hybrid scenario including kinetic electrons, collisions, electromagnetic effects and up to five species [206]. It is found that the interplay between nonlinear micro-turbulence effects generate an isotope effect leading to a change of the ion heat fluxes from D–D to D–T plasmas. In this context, one of the objectives of the future pure JET tritium campaign, foreseen in 2018, will be to investigate the hydrogen isotope effects on the core and pedestal confinement, on the L to H transition and on ELM physics. Regarding alpha power effects, the simulation indicates that the fusion power generated should have a noticeable impact on the fast ion generation and electron heating in regimes without sawteeth activities [207]. This will allow the analysis of Toroidal Alfvén Eigenmodes (TAE) stability and the impact on turbulence reduction [208]. This opens up the possibility of analyzing already at JET some key physics issues expected in ITER nuclear active phase of operation, such as the impact of alphas fast ion pressure, electron heating on tungsten impurity transport, fast ion confinement and neutron yield production [209].
6. Nuclear fusion technology in support of ITER
Significant effort and results have been obtained recently within the JET programme in the field of nuclear fusion technology in support of ITER [5, 211–214], i.e. neutronics, neutron induced activation and damage ITER materials, nuclear safety, tritium cycle, nuclear waste production and characterization.
6.1. Neutronics and code validation
The 14MeV neutron rates issued from the D–T fusion reaction should be accurately measured for the scientific exploitation of the JET and ITER D–T experiment (code validation, performance optimisation), for the accurate measurement of the fusion power (including tritium burn and tritium accountancy), and, for a precise estimate of the machine activation within the available neutron limit. On JET, an accurate calibration procedure of neutron detectors at 14 MeV neutron energy (235U fission chambers and the in-vessel activation system) has been developed to measure the fusion power during the future D–T experiments. The 14 MeV neutron calibration is designed using a 14 MeV neutron generator to be deployed in JET by remote handling. The calibration layout and strategy have been developed taking into account the source characteristics, the safety requirements and the limitations imposed by the remote handling capabilities. As a calibration source, the neutron generator must be fully characterized, in terms of neutron energy spectrum and anisotropy of neutron emission, and absolutely calibrated. As it cannot be considered a stable source, its neutron emission rate during the in-vessel calibration has to be continuously monitored using more than one monitoring detectors which, in turn, have to be absolutely calibrated. Two 14 MeV neutron generator units (~2 · 108 n s−1) and the power supply/control unit were purchased and delivered in October 2015. Both units have been fully characterized during two experimental campaigns at a dedicated neutron facility (the National Physics Laboratory, NPL, Teddington, UK) that took place in November 2015 and June 2016: emission rates at many different angles, neutron spectra at several different angles, stability of the monitoring detectors attached to the neutron generators were measured using several neutron detection and spectroscopy techniques. The count rate of monitoring detectors has been related to the neutron generator absolute intensity as well. The deployment of the D–T neutron generator inside the JET vacuum chamber in different toroidal and poloidal positions will take place in the 2016–2017 shutdown. The operation time required for the neutron generator in each position is in the range 0.3–4 h during which the neutron emission rate by the generator will be provided by the monitoring detectors. Extensive neutronics modelling of the neutron generators/detectors and of the JET machine are required to provide the characterization and the calibration of the neutron generators, and to derive the response of JET neutron monitors to the neutron D–T plasma source at the required accuracy level. The JET calibration strategy is an important step to benchmark the calibration procedure for ITER where neutron detectors have to provide the fusion power (10% accuracy) and the amount of T-burnt for T-accountancy.
Dedicated neutron measurements around JET have been performed to validate the various codes used in ITER to predict quantities such as the neutron flux along streaming paths, the activation of materials, as well as the resulting shutdown dose rates [212, 213]. For this purpose, several streaming experiments have been carried out, consisting of measuring the neutron fluence and dose-rates in the torus hall and along its ducts. It was demonstrated that the neutron fluence measurements along penetrations of the JET torus hall biological shield are well reproduced by the Monte-Carlo codes over six orders of magnitude of the neutron fluence as shown in figure 27 and reported in [211]. Calculations have been carried out using ITER relevant Monte-Carlo codes such as MCNP, a validated geometrical model of JET and neutron cross-section data from the ITER reference nuclear data library (FENDL-3). Benchmark against the AutomateD VAriaNce reducTion Generator (ADVANTG) software, which generates variance reduction parameters for Monte Carlo simulations and which is now increasingly used in ITER to speed up neutronics analyses, has also been performed showing a good agreement between this code and the full MCNP calculations.
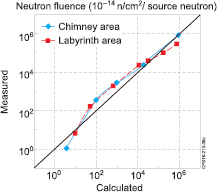
Figure 27. Comparison between measured and calculated neutron fluence along two penetrations through the JET Torus Hall biological shield: the access labyrinth and the air duct chimney [211].
Download figure:
Standard image High-resolution imageShutdown dose rates have been also calculated with various codes (Advanced D1S, R2Smesh, MCR2S and R2S-UNED). A good agreement is found among the codes that reproduce the measured gamma dose rates along the mid-port and in several cells outside the vessel. The measured D–D neutron fluence and gamma dose rates have been compared with simulations performed with the codes used for ITER nuclear analyses. A good agreement is obtained which is an important step to gain confidence in ITER safety assessment calculations [212, 213].
6.2. Tritium fuel cycle and detritiation
Up to the start of ITER operation, JET is the only tritium compatible magnetic confinement fusion device currently active. The active gas handling system, AGHS, was constructed to process and recycle the gases from the torus and Neutral Beam Injectors [214]. The tritium facility is located in a separate building equipped with its own ventilation system and connected with the JET torus via gas transfer and pumping lines. The AGHS is presently being upgraded with the possibility of using four Gas Injection Modules (GIMs) instead of one used in the previous D–T campaign (1997), with an improved T-accountancy and a new water detritiation system to fully close the tritium fuel cycle at JET [215]. This GIM upgrade will ease the transfer from deuterium to tritium plasma scenarios initially developed using different GIMs and will provide a better control of the D–T mix within the JET plasmas.
There is also a requirement to improve our tritium accountancy techniques to allow the quantities of tritium being transferred to, and returning from, the JET machine to be accurately traced at a level below 1%. The first steps have been made to improve the tritium accountancy with an upgrade of the instrumentation for tritium measurement, e.g. by the development of a solid state based detector.
The AGHS exhaust detritiation system produces tritiated water at a rate averaging 9200 litres per year. This is collected in a tank and stored in stainless steel drums. These drums have historically been shipped to the Ontario Power Generation Inc. in Canada for disposal and recycling. However, it has been decided that an on-site water detritiation system will be constructed to allow the processing of tritiated water and the recovery of contained tritium. The tritium recovered from the water will be fed back into the AGHS plant for processing (figure 28). The water detritiation system is designed to have an annual throughput of approximately 15 000 kg with activities of up to 200 GBq l−1. It is planned to start non-active commissioning of the water detritiation system by 2016.

Figure 28. Sketch of the JET tritium cycle with the new water detritiation system where tritium waste will be re-processed and recovered to close the on-site tritium cycle [215]. Reprinted from [215], Copyright 2015, with permission from Elsevier.
Download figure:
Standard image High-resolution image
The valuable experience gained both in the preparation and the execution of the JET tritium and D–T experimental campaigns at JET is contributing to train the future ITER operator of the Tritium plant in terms of operation and maintenance and will provide quantitative information for the nuclear regulator, e.g. radioactive waste management contaminated with tritium.
6.3. Nuclear waste production and characterization
JET operations generate large quantities of waste, some of which radioactive and contaminated with tritium. Moreover, as beryllium is used in the ITER-like Wall, it is assumed to be present within all type of solid waste. ITER is interested in any information from JET experience that may help with aspects of ITER waste production and characterization in order to establish the routes for the subsequent decontamination and the available disposal routes. In this context, activity has been carried out to validate the tools and processes required by ITER [216].
7. Prospects and conclusion
The JET tokamak and its surrounding technology facilities have a number of features that are presently unique: possibility to operate with all hydrogen isotopes, ITER-like wall, tritium and beryllium handling facilities, remote maintenance facility. We have shown that the operation of these facilities could play an important role in optimising the ITER research plan and thereby in ensuring a rapid transition from ITER first plasma to ITER D–T operation. Indeed, recent analysis of the ITER research plan has focussed on maintaining the shortest achievable path to D–T operation and the achievement of the QD–T = 10 milestone. In this context, the exploitation of all metal plasma facing components facilities will support this important challenge during both the non-active and active ITER operation.
We conclude that the underlying physics understanding of the JET ITER like wall operation and results requires developing an integrated vision where the science of the wall materials, plasma surface interaction, scrape-off layer, pedestal and plasma core physics are strongly coupled and interconnected. A sound scientific based extrapolation of the JET results towards ITER and future reactor (DEMO) operation will require a new paradigm to be developed inter-linking these various physics processes beyond a simple empirical scaling extrapolation.
Up to 2020114, the focus of the JET campaigns is the preparation of the deuterium, tritium and D–T campaigns and the investigation the hydrogen isotope effects on fusion performance with the ITER material mix. Both baseline and hybrid operational regimes should progress towards ITER dimensionless parameters (H-factor, beta, ρ*, ν* etc.) leading to stationary fusion performance, while remaining compatible with the ILW. After the 2016–2017 shutdown, the major challenge for the 2018–2019 experimental campaigns consists of integrating high confinement operation with the divertor constraints at full applied heating power. During the 2016–2017 shutdown, in addition to the installation of the Shattered Pellet Injector for ITER relevant disruption experiments, it is foreseen to upgrade the actively cooled components of the NBI system that exhaust the heat load from non-dissociated  ions [5]. When these new components will be installed, the NBI system will be capable in providing steady 34 MW during at least 5 s in a reliable manner in either deuterium or tritium [5]. Therefore, one of the main objectives of the next deuterium campaigns are to further extend the performance of the ILW by fully exploiting the JET machine capability at high additional powers in the range of 40 MW with up to 34 MW of NBI and 6 MW of ICRH powers. The quantitative objective is to reach stationary deuterium plasma scenarios in 2018/2019 with thermal energy content of the order of Wth(D–D) ~ 12 MJ with HIPB98(y,2) ⩾ 1. Then it is foreseen, to assess the transferability of the developed scenarios when varying the plasma isotope content from deuterium to tritium before the D–T campaigns in 2019. The D–T campaign will provide an integrated test of fusion technology and ITER scenarios with the ITER material mix including the isotope effects on confinement, alpha physics, L–H threshold, ELM and pedestal physics.
In parallel, it has also been proposed to extend the life of JET beyond 2020 as an ITER test-bed facility until the start of the scientific exploitation of ITER [15]. After a number of enhancements and refurbishments the JET device will be even more suited to perform risk mitigation experiments for ITER and to train the ITER operation staff [15]. To make JET even more relevant for ITER, a number of enhancements (hardware and software) have been proposed and extensive feasibility studies have been performed for a 10 MW Electron Cyclotron Resonant Heating system at the ITER frequency (170 GHz) [217], a better diagnosed and more ITER-like divertor upgrade [218] and Resonant Magnetic Perturbation Coils [219]. In addition, it is proposed that JET becomes a test bed to develop and demonstrate real time control concepts for ITER using identical algorithms and software. In this context, it is proposed to upgrade the existing real-time control system to a new system, based on more powerful hardware and software architecture. The primary goal of such an extension and set of upgrades would be to prepare for integrated ITER operation with the ITER control tools (actuators and real time plasma controllers), with the ITER mix of materials for the first wall using the ITER modelling tools for experiment preparation and analysis [220].
Acknowledgment
The corresponding author would like to warmly acknowledge the impressive collective work of the JET Task Force Leaders, the JET Project Leaders, the JET contributors, the JET operator, the JET Exploitation Unit and the EUROfusion Programme Management Unit for achieving the scientific results reported in this overview paper. In addition, the corresponding author would like to acknowledge valuable scientific discussions and inputs from the JET international partners, and, in particular from his colleagues at ITER Organization Central Team. This work has been carried out within the framework of the EUROfusion Consortium and has received funding from the Euratom research and training programme 2014–2018 under grant agreement No 633053. The views and opinions expressed herein do not necessarily reflect those of the European Commission.
Footnotes
- 114
Pending decisions on funding EUROfusion and the JET Operating Contract in 2019–2020.