

Abstract
The suitability of hydrogel biomaterials for bone regeneration can be improved by incorporation of an inorganic phase in particle form, thus maintaining hydrogel injectability. In this study, carbonate microparticles containing different amounts of calcium (Ca) and magnesium (Mg) were added to solutions of the anionic polysaccharide gellan gum (GG) to crosslink GG by release of Ca2+ and Mg2+ from microparticles and thereby induce formation of hydrogel–microparticle composites. It was hypothesized that increasing Mg content of microparticles would promote GG hydrogel formation. The effect of Mg incorporation on cytocompatibility and cell growth was also studied. Microparticles were formed by mixing Ca2+ and Mg2+ and  ions in varying concentrations. Microparticles were characterized physiochemically and subsequently mixed with GG solution to form hydrogel–microparticle composites. The elemental Ca:Mg ratio in the mineral formed was similar to the Ca:Mg ratio of the ions added. In the absence of Mg, vaterite was formed. At low Mg content, magnesian calcite was formed. Increasing the Mg content further caused formation of amorphous mineral. Microparticles of vaterite and magnesium calcite did not induce GG hydrogel formation, but addition of Mg-richer amorphous microparticles induced gelation within 20 min. Microparticles were dispersed homogeneously in hydrogels. MG-63 osteoblast-like cells were cultured in eluate from hydrogel–microparticle composites and on the composites themselves. All composites were cytocompatible. Cell growth was highest on composites containing particles with an equimolar Ca:Mg ratio. In summary, carbonate microparticles containing a sufficient amount of Mg induced GG hydrogel formation, resulting in injectable, cytocompatible hydrogel–microparticle composites.
Export citation and abstract BibTeX RIS
1. Introduction
Hydrogels, or polymer networks in which water is entrapped, are often enriched with an inorganic phase, i.e. mineralized, with the aim of making them more suitable as biomaterials for the regeneration of bone tissue. The most popular approach, and arguably also the most straightforward approach, is the addition of pre-formed inorganic particles, most commonly a form of calcium phosphate (CaP), during hydrogel gelation (Gkioni et al 2010). Enrichment of hydrogels with inorganic particles has promoted adhesion, proliferation and osteogenic differentiation of bone-forming cells in vitro and bone regeneration after implantation in bone defects in vivo (Anderson et al 2011, Bongio et al 2011).
One hydrogel material that has been enriched with inorganic particles is gellan gum (GG) (Douglas et al 2014a, Gorodzha et al 2016). GG is an anionic polysaccharide which forms hydrogels upon crosslinking with divalent ions such as Ca2+ or Mg2+.
Certain organic particles, e.g. CaP, bioactive glasses and calcium carbonate (CaCO3), can release ions such as Ca2+ and can be used as delivery vehicles for such ions. This concept of causing hydrogel formation by ion release from particles has been referred to as 'internal gelation' (Chan et al 2002). Several studies have been published on internal gelation of the calcium-binding polysaccharide alginate by incorporation of CaCO3 and acidifiers such as glucono-delta-lactone (GDL), which promote dissolution of CaCO3 by lowering the pH (Kuo and Ma 2001).
CaCO3 has also been widely and successfully applied in bone regeneration. CaCO3 can occur as amorphous calcium carbonate (ACC) and also as three crystalline polymorphs, namely calcite, aragonite and vaterite, the most thermodynamically unstable forms (Andersen and Brecevic 1991). Coral-derived scaffolds consisting of aragonite have been reported to have outperformed CaP materials when implanted in vivo (Viateau et al 2013).
Hence it is conceivable that the addition of CaCO3 particles to hydrogels would improve their suitability as bone regeneration materials. Several enrichment strategies have been reported in the literature, including addition of nacre powder (Flausse et al 2013).
Recently, substantial attention has been focused on the enrichment of inorganic, CaP-based materials for bone regeneration with magnesium (Mg). Several groups have reported a positive effect of Mg enrichment of CaP-based biomaterials in vitro and in vivo (Landi et al 2006, Zhao et al 2012). In contrast, Mg enrichment of carbonate-based biomaterials for bone regeneration remains unexplored. The calcite-based exoskeletons of mineralized marine organisms can contain Mg (Nash et al 2013) and natural and synthetic calcites can contain up to 30% and 39% Mg (Morse et al 2007, Long et al 2012), respectively.
In this work, self-gelling hydrogel-particle composites were generated by addition of microparticles of CaCO3, MgCO3 and Ca–Mg carbonate to the GG solution. Addition of microparticles induced homogenous gelation by slow release of the divalent ions. This approach was used in previous work to cause formation of self-gelling composites of GG and bioactive glass particles (Douglas et al 2014a, Gorodzha et al 2016). One of the advantages of this approach is the avoidance of the use of acidifiers such as GDL.
It was hypothesized that the presence of carbonate would improve osteoblast-like cell adhesion and proliferation, and that the presence of Mg would lead to an increase in the number of cells.
Calcium carbonate, magnesium carbonate and calcium–magnesium carbonate microparticles were preformed by mixing a solution containing Ca2+ and/or Mg2+ ions with another solution containing  ions. Five different Ca2+:Mg2+ concentration ratios were compared.
The effect on Ca2+:Mg2 concentration ratio on particle composition was evaluated. Elemental composition was determined using atomic absorption spectroscopy (AAS). Attenuated total reflectance Fourier-transform infrared spectroscopy (ATR-FTIR), Raman spectroscopy, x-ray diffraction (XRD), transmission electron microscopy (TEM), selected area electron diffraction (SAED) and scanning electron microscopy (SEM) were also carried out.
After the addition of particles to the GG solution, the speed of gelation was evaluated by rheometry. Distribution of particles in the resulting hydrogel–particle composites was assessed by micro-computer tomography (μCT). Composites were characterized biologically by cytocompatibility tests to evaluate bone cell growth both in eluates from the composites as well as directly on the composites themselves.
As mentioned above, enrichment of calcium carbonate biomaterials for bone contact with metal ions other than Ca2+ (e.g. Mg2+) has not been well explored. This study aimed to fill these gaps in the scientific literature and elucidate the physicochemical and biological effects of incorporation of magnesium in carbonate formed in hydrogels.
2. Materials and methods
2.1. Materials
All materials, including GG (Gelzan™ CM, Product no. G1910, 'Low-Acyl', molecular weight 200–300 kD), CaCl2 (21 074), MgCl2, Na2CO3 (57 795), were obtained from Sigma-Aldrich, unless stated otherwise.
2.2. Production of microparticles
Ca2+/Mg2+ solutions of different Ca:Mg elemental ratios and  solution (0.333 M) were prepared as described in table 1.
Table 1. Concentrations of solutions used to form microparticles in this study. Equal volumes of Ca2+/Mg2+ solution and  solution were mixed to form microparticles.
| Microparticle sample group | Concentrations in Ca2+/Mg2+ solution | Concentration in  solution solution |
|
|---|---|---|---|
| CaCl2 (mol dm−3) | MgCl2 (mol dm−3) | Na2CO3 (mol dm−3) | |
| A | 0.333 | 0 | 0.333 |
| B | 0.250 | 0.083 | 0.333 |
| C | 0.167 | 0.167 | 0.333 |
| D | 0.083 | 0.250 | 0.333 |
| E | 0 | 0.333 | 0.333 |
4 ml of a Ca2+/Mg2+ solution and 4 ml  solution were mixed for 30 s at room temperature using a magnetic stirrer. A particle suspension was formed which was centrifuged for 2 min at 4 °C at a speed of 13 000 rpm. The supernatant was removed, and the same volume of double-distilled water was added. The particles were resuspended using a vortexer. The particle suspension was centrifuged again for 5 min at 4 °C at a speed of 2000 rpm. The supernatant was removed and discarded and particles were dried in an oven for 2 d at 37 °C. Dried particles were then sterilized by autoclaving at 121 °C for 15 min (Astell, VWR International, Leuven, Belgium).
2.3. Physicochemical and morphological characterization of microparticles: ATR-FTIR, Raman, XRD, SEM, TEM, AAS, DLS, ICP-OES
A FTIR spectrometer van Perkin Elmer type Spectrum BX in ATR mode (attenuated total reflectance) was used to obtain infrared spectra of the samples. The spectra were recorded over the wavenumber range 4000–550 cm−1 at 32 scans with a resolution of 4 cm−1.
Raman spectra were recorded using a Kaiser Optical Systems Rxn1-532 device equipped with a 532 nm (Nd:YAG) laser source as described previously (Douglas et al 2014b). Spectra were recorded after 10 accumulations of 5 s each.
XRD measurements were performed with a Thermo Scientific™ ARL™ X'TRA Powder Diffractometer set to 40 kV and 30 mA. The slits that were used are: 0.6 and 1 at the source side and 0.6 and 0.2 at the detector side. Scans were made in continuous scan mode over a 2θ range from 10 to 50 with a step size of 2θ = 0.02° degrees and a scan rate of 1.2 s/step. To study the crystallographic phases of the structures the XRD technique with post processing analysis with Highscore plus software by PANalytical B.V. (Netherlands) was used. The phase content analysis was performed by the semiquantative Rietveld method. The theoretical CaCO3 spectra were taken from the works of Sitepu (2009) and Le Bail et al (2011) for calcite and vaterite, respectively. The theoretical spectra of sodium chloride and magnesium calcite were taken from Strel'tsov et al (1987) and Althoff (1977), respectively.
SEM was performed using a JEOL JSM-5600 instrument equipped with a secondary electron detector. Samples were sputtered with a thin gold layer (15–20 nm) to make the sample surface conductive. In certain samples, the size distribution of vaterite microparticles and the percentage of particles attributable to vaterite and calcite were calculated on the basis of SEM images. Size distribution of particles and percentage quantification of the calcite (cubic-like structures) and vaterite (spherical polycrystals) were obtained by post processing and image analysis of SEM images by Image J software (NIH, http://rsb.info.nih.gov/ij/). At least 90 particles were used for statistical analysis. The average size was shown as mean ± standard deviation.
TEM was performed using a Jeol (S)TEM JEM-2200FS instrument operated under 200 kV as described in a previous work (Douglas et al 2014b).
Total concentrations of Ca and Mg in particles were determined using flame atomic absorption spectrophotometry (AAS) as described previously (Liskova et al 2015). Briefly, the weight of each sample was determined to the nearest 0.1 mg by weighing. Samples were dissolved in 14 M HNO3, and diluted by a factor of 20 to reach a final concentration of 5% HNO3 (v/v). Concentrations of Ca and Mg were determined using flame AAS (SpectrAA100, Varian, Mulgrave, Australia), after calibration with 4 standards in the range 0–1.00 mg l−1. Calibration was verified with an independent reference material with a maximum certified deviation of 7.5%. Analysis of a procedural blank was performed and the value obtained was below the quantification limit (0.1 µg mg−1 for a 10 mg sample). Concentrations of Ca and Mg were calculated as µg Ca and µg Mg/mg dry weight of the sample.
Dynamic light scattering (DLS) was employed to characterize the size and surface charge of the particles by measuring the hydrodynamic diameter, polydispersity index (PDI) and zeta potential on a Zetasizer Nano Series (Malvern Instruments, Hoeilaart, Belgium). The particle suspensions were added into the disposable folded capillary cells DTS 1070. Measurements were carried out at temperature of 25 °C and a scattering angle of 173°.
Release of Ca and Mg from particles was studied using inductively coupled plasma optical emission spectroscopy (ICP-OES). Particles were suspended in 1 ml Milli-Q water at a concentration of 2.5% in 1.5 ml Eppendorf microcentrifuge tubes. After a certain time point (5, 12.5, 20 min), the tubes were centrifuged for 1 min at 10 000 rpm. 0.5 ml of the supernatant was retained for ICP-OES analysis which was conducted as described previously (Gassling et al 2013), using standard Ca and Mg solutions in the concentration range 0–5 µg ml−1. For all microparticle groups, n = 4.
2.4. Preparation of gellan gum (GG) solution, formation of hydrogel–microparticle composites, light microscopy characterization and rheometric testing
Sterile GG solution was prepared as described previously (Douglas et al 2014a). Briefly, 16 ml aqueous 0.875% (w/v) GG solution was sterilized by autoclaving as described in section 2.2. To generate hydrogel–microparticle composites, microparticles were resuspended in ddH2O at 10% (w/v). 0.2 ml of this microparticle suspension was mixed with 0.6 ml autoclaved 0.875% (w/v) GG solution. Gelation took place at 37 °C. The final concentrations of microparticles and GG in the resulting composites were 2.5% (w/v) and 0.66% (w/v), respectively. Images of composites were taken using a IX81 light microscope (Olympus) after allowing composites of volume 0.8 ml to form in 24-well plates.
Gelation speed was investigated by performing rheometrical measurements with an AR1000N Rheometer (TA Instruments). All experiments were performed at 37 °C using a plate-cone setup with a stainless steel plate and an acrylic cone of 4 cm diameter. First, a time sweep was performed for 1200 s at strain 0.1% and frequency 1 Hz. Immediately afterwards, a frequency sweep was performed from 1 to 100 Hz, which corresponds to angular frequencies of 6.3–627.7 rad s−1.
2.5. μCT examination
The distribution of microparticles inside hydrogel–microparticle composites was examined using μCT. The samples were scanned using the HECTOR μCT setup (Masschaele et al 2013) at the Centre for x-ray Tomography of Ghent University (UGCT), which is a custom built system developed in collaboration with the company XRE (www.xre.be). The acquisition parameters for each of the hydrogel–microparticle composites were identical and the total acquisition time was 43 min/sample. The microfocus x-ray source was operated at 120 kV, with a power of 10 W and 2401 radiographs per scan were acquired with an exposure time of 1000 ms using a flat panel detector with 2000 × 2000 pixels. The acquired radiographs were reconstructed using the software package Octopus (Vlassenbroeck et al 2007) resulting in a 3D volume of 2000 × 2000 × 1680 voxels with a voxel size of 5 µm.
The 3D volume was visualized and analyzed using the 3D analysis software Avizo (FEI). The more attenuation microparticles were segmented from the hydrogel matrix using grey-value based single thresholding on the 3D images, resulting in a 3D distribution of the microparticles shown in figure 8.
2.6. Cytocompatibility testing
2.6.1. Cell culture in eluates from hydrogel–microparticle composites
Cytocompatibility was evaluated by determining the viability of MG-63 cells after culture in eluate from composite samples. Eluate was produced by incubating 1 g of composite samples in 5 ml of medium (EMEM, PAN Biotech, Germany) for 24 h at 37 °C. The eluate was diluted in EMEM by factors of 1 (undiluted), 2, 4, 8 and 16. MG-63 cells (7000/well of a 48-well plate) were cultured for 24 h and then subsequently incubated in the eluate (1 ml) at the abovementioned dilutions for the next 24 h, 3 and 7 d.
Cell viability was then evaluated using Alamar Blue reagent (In vitro Toxicology Assay Kit, Resazurin based). 0.05 ml of Alamar Blue reagent was added and the cells were incubated for 4 h at room temperature. Reduction of Alamar Blue was measured fluorescently (excitation wavelength 530 nm, emission wavelength 590 nm) (FLUOstar Omega, BMG labtech) and calculated according to the following formula:

where Sx is the fluorescence of samples, Scontrol is the fluorescence of medium without cells and S100%reduced is the fluorescence of reagent reduced in 100% (reagent with medium was placed in autoclave for 15 min at 121 °C).
The result of this measurement is the reduction ratio of the reagent (the higher the reduction, the more cells). This test was conducted three times, after 24 h, 3 and 7 d. Measurements were performed in triplicate.
Cell attachment, distribution and viability were evaluated 24 h, 3 d and 7 d post-seeding by fluorescence microscopy using an Axiovert 40 microscope (Carl Zeiss, Germany) after live/dead staining (Calcein AM/propidium iodide).
2.6.2. Cell culture directly on hydrogel–microparticle composites
Composites of volume 0.5 ml were formed by pouring ingredient mixtures into 24-well plates with subsequent gelation for 24 h. After gelation, 20 000 cells suspended in 1 ml EMEM were seeded onto each hydrogel sample and cultured for 24 h, 3 d and 7 d. Alamar Blue and staining were performed the same way as in the case of eluates.
3. Results
3.1. Physicochemical characterization of microparticles formed: FTIR, Raman, XRD, SEM, TEM, AAS and DLS
FTIR spectra of microparticles are displayed in figure 1. Differences were observed between different microparticle groups. Groups A, B, C and D displayed bands at 712 and 871 cm−1, corresponding to ʋ4 and ʋ2 symmetric and antisymmetric bending, respectively. These bands are typical for calcite, as is the band at approximately 1400 cm−1, corresponds to ʋ3 antisymmetric stretching (Andersen and Brecevic 1991). However sample E, which contained only magnesium and no calcium, displayed a markedly different absorption spectra. The double band at 1472 and 1416 cm−1, which corresponds to ʋ3 antisymmetric stretching of carbonate groups, and the band at 792 cm−1, which corresponds to ʋ2 symmetric bending of carbonate groups, both demonstrate the presence of the magnesium carbonate hydromagnesite (Mg5(CO3)4(OH)2·4H2O) (White 1971, Frost 2011).
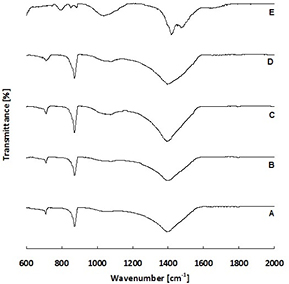
Figure 1. FTIR spectra of microparticle groups A, B, C, D and E.
Download figure:
Standard image High-resolution imageRaman spectra of microparticles are shown in figure 2. Microparticle group A showed bands at 1087 cm−1 and 283 cm−1 which are consistent with the υ1  symmetric stretching and vibration (L) lattice modes, respectively (Bischoff et al 1985). Microparticle group B showed similar but broader bands at 1089 cm−1 and 285 cm−1, as well as another band at 714 cm−1, which corresponds to the υ4
  in-plane stretching. The shift and broadening of the υ1 and L bands to higher values is consistent with incorporation of Mg in the calcite lattice (Bischoff et al 1985). Another band was observed at 1069 cm−1, which is untypical for magnesian calcite; the reason for its appearance is unclear. Microparticle group C showed a single broader band at 1087 cm−1, suggesting increasing amorphicity. Microparticle group D displayed a single band at 1097 cm−1. This shift suggests that calcite is no longer present, but that a Mg-rich carbonate phase has formed (Bischoff et al 1985). Microparticle group E shows a broad band in the range 1080–1130 cm−1 with a peak at 1109 cm−1 which appears to correspond to the υ1
  symmetric stretching mode (Edwards et al 2005, Frost 2011).
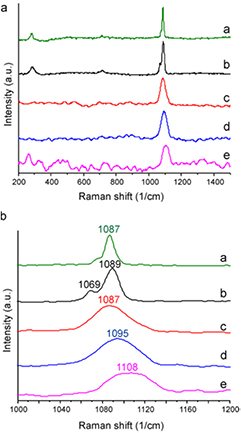
Figure 2. Raman spectra of microparticle groups A, B, C, D and E.
Download figure:
Standard image High-resolution imageXRD results are shown in figure 3. Microparticle group A displayed peaks at 2θ values of 23.2, 29.5, 36.1, 39.5, 43.3, 47.7, 48.6 and 57.5 which are characteristic for calcite (Sitepu 2009), and peaks at 25.0, 27.2 and 32.9, which are characteristic of vaterite (Le Bail et al 2011), suggesting the presence of both calcite and vaterite. Quantitative analysis based on the Rietveld method revealed that the sample contained 60% vaterite and 40% calcite by mass. In microparticle group B peaks characteristic of vaterite were not present, however, the main peak characteristic of the (1 0 4) plane of calcite was observed at 29.9. This shift from 29.5 is characteristic of magnesian calcite (Rahman et al 2013). Further shifts typical for magnesian calcite were observed in the 2θ range 30–50 (Althoff 1977). In addition, peaks characteristic for NaCl were observed, particularly at 31.9 (Strel'tsov et al 1987). Quantative analysis based on the Rietveld method revealed that the sample contained 80% magnesian calcite and 20% NaCl by mass. Microparticle groups C and D were more amorphous because they showed very broad peaks at approximately 32.0. The broadness and low intensity of these peaks suggest the presence of an amorphous phase. Microparticle group E appeared to be largely amorphous, However, peaks at 2θ values of approximately 31.9, 32.9 and 45.5 were also observed, which can be ascribed to NaCl (Strel'tsov et al 1987).
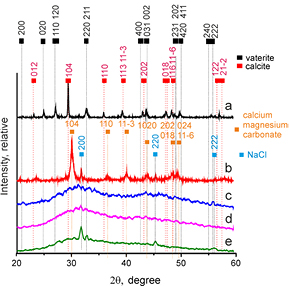
Figure 3. XRD diffractograms of microparticle groups A, B, C, D and E.
Download figure:
Standard image High-resolution imageResults of DLS measurements of average particle diameter are presented in table 2. The average diameters ranged from approximately 2 to 8 µm. The high polydispersity index of the particles in sample groups A, D and E indicated a large variability in the particle size or homogeneity.
Table 2. Determination of microparticle size using DLS.
| Microparticle sample group | Diameter (µm) | Polydispersity index (PDI) |
|---|---|---|
| A | 2.8 | 0.456 |
| B | 3.9 | 0.196 |
| C | 4.9 | 0.13 |
| D | 2.1 | 0.591 |
| E | 8.3 | 1 |
SEM images of microparticle groups A, B, C, D and E are shown in figure 4. The microparticle diameters observed on SEM images were consistent with the DLS data (table 2). Group A contained porous spherical deposits characteristic of vaterite, and cubic, non-porous deposits characteristic of calcite. The size distribution of the vaterite particles is shown in online supplementary figure S1 (stacks.iop.org/BMM/11/065011/mmedia). The average diameter was 1.6 ± 0.3 µm. Analysis of SEM images shown in figure S1 revealed that 83% of the particles were vaterite and 17% were calcite. Microparticles in all other groups were irregular in shape.

Figure 4. SEM micrographs of microparticle groups A, B, C, D and E. The scale bars are indicated on each image.
Download figure:
Standard image High-resolution imageResults of AAS analysis to determine Ca and Mg content and elemental ratio of microparticle groups A–E are shown in table 3. The elemental ratios in all microparticle groups were approximately equal to the elemental compositions of the starting solution.
Table 3. AAS determination of mass of elemental Ca and Mg per unit mass of dried microparticles.
| Sample group | µg element/mg sample | µmol element/mg sample | Molar % of Mg (Mg/(Mg + Ca)) * 100 in sample | ||
|---|---|---|---|---|---|
| Ca | Mg | Ca | Mg | ||
| A | 392 | 0.2 | 9.80 | 0.01 | 0.1 |
| B | 205 | 39 | 5.13 | 1.63 | 24.1 |
| C | 167 | 90 | 4.18 | 3.75 | 47.3 |
| D | 99 | 135 | 2.48 | 5.63 | 69.4 |
| E | 0.7 | 380 | 0.02 | 15.83 | 99.9 |
TEM images and associated SAED diffraction patterns are presented in figure 5. In microparticle group A, porous vaterite microspheres were observed. The diffraction pattern revealed rings, indicating the presence of small crystallites, which corresponded to the (0 0 2), (1 1 0), and (2 2 0) planes of vaterite. In contrast, all other microparticle groups were composed of agglomerates of roughly spherical nanoparticles, which varied in size. Indistinct and broad rings were seen on diffraction patterns, which indicate far lower crystallinity.
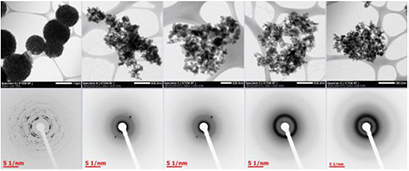
Figure 5. STEM images (top row) and SAED diffraction patterns (bottom row) of microparticle groups A, B, C, D and E (left to right). The scale bars are indicated on each image. In sample A, the (0 0 2), (1 0 2), and (2 0 2) planes of vaterite correspond to the three innermost rings.
Download figure:
Standard image High-resolution image3.2. Physicochemical characterization of hydrogel–microparticle composites
Addition of microparticle groups A and B did not induce GG hydrogel formation. In contrast, addition of microparticle groups C, D and E caused gelation.
Light microscopy images of the hydrogel– microparticle composites are shown in figure 6. It can be seen that there was some variance in the size of the microparticles and/or microparticle aggregates present, which was most apparent for composites containing microparticle group E. Aggregates were larger in width than the microparticles observed using SEM (figure 4) and measured using DLS (table 2) Images of the hydrogels can be seen in online supplementary figure S2. All samples were non-transparent to the naked eye.
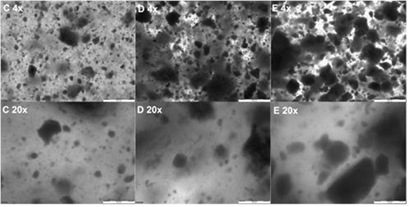
Figure 6. Light microscopy images of hydrogel–microparticle composites formed after addition of microparticle groups C, D or E to GG solution. Top row: magnification 4×, scale bar = 500 µm. Bottom row: magnification = 20×, scale bar = 100 µm.
Download figure:
Standard image High-resolution imageResults of rheometric analysis are shown in online supplementary figure S3. Time sweeps revealed that a plateau value was reached after 1200 s (20 min) in all groups, indicating completion of gelation. Composites containing microparticle group E reached the plateau value after approximately 400 s, considerably more slowly than those containing microparticle groups C and D. The storage modulus decreased in the order D > C > E. Subsequent frequency sweeps showed that angular frequency at which the storage modulus declined increased in the order E < C < D.
The release profiles of Ca and Mg from microparticle groups C, D and E suspended in Milli-Q water are shown in online supplementary figure S4. No marked differences in Ca and Mg concentration were observed between 5 and 20 min. This suggests that most Ca and Mg release occurs in the first 5 min of incubation. Release of Ca from microparticle groups C and D was comparable. As expected, no Ca release from microparticle group E was observed. Release of Mg from microparticle groups C, D and E was markedly higher than Ca release from microparticle groups C and D. Release of Mg from microparticle group D was markedly higher than that from groups C and E.
μCT analysis results are shown in figure 7. Aggregates of varying sizes were seen in three composite types, which were obviously larger in size than the particle sizes observed by SEM (figure 4) and DLS (table 2). Aggregates in composites containing microparticle group E were smaller than those observed in those containing microparticle groups C and D.
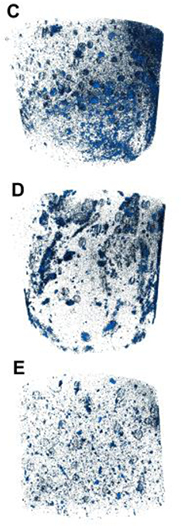
Figure 7. μCT images of hydrogel–microparticle composites formed by mixing microparticle groups C (top), D (middle) or E (bottom) with GG solution. Sample diameter = 9 mm.
Download figure:
Standard image High-resolution image3.3. Cell biological characterization with MG63 osteoblast-like cells
Fluorescence microscopy images of MG-63 cells cultured in eluates from hydrogel–microparticle composites are shown in figure 8. Growth and vitality of cells were comparable to control samples after 1, 3 and 7 d. Results of the Alamar Blue assay are shown in online supplementary figure S5. These results are in agreement with the results of the fluorescence microscopy analysis (figure 9).
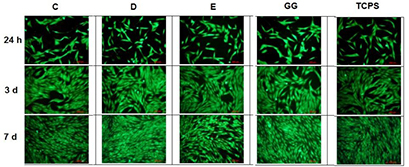
Figure 8. Fluorescence microscopy images of MG-63 osteoblast-like cells cultivated for 24 h, 3 and 7 d in eluates from hydrogel–microparticle composites formed after addition of microparticle groups C, D or E to GG solution. Images of cells cultured in eluate from GG hydrogels without particles and cells cultured on TCPS are shown as controls.
Download figure:
Standard image High-resolution image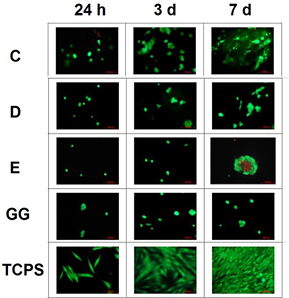
Figure 9. Fluorescence microscopy images of MG-63 osteoblast-like cells cultivated for 24 h, 3 and 7 d directly on hydrogel–microparticle composites formed after addition of microparticles C, D or E to GG solution. Images of cells cultured on GG hydrogels without particles and cells cultured on TCPS are shown as controls.
Download figure:
Standard image High-resolution imageFluorescence microscopy images of MG-63 cells cultured directly on hydrogel–microparticle composites are shown in figure 9. Cells cultured on TCPS displayed a well-spread morphology. In contrast, cells grown on GG hydrogels and hydrogel–microparticle composites displayed a more rounded morphology and were mainly present as single cells or small cell clusters. After 7 d, larger cell clusters were observed on hydrogel–microparticle composites than on GG. Some dead cells were observed on composites containing microparticle group E.
Results of the Alamar Blue assay are shown in figure 10. Proliferation after 7 d was highest on composites containing microparticle group C. Proliferation after 1, 3 and 7 d was lower on composites containing microparticle groups D and E than on composites containing microparticle group C and GG samples.

Figure 10. Quantification of number of MG-63 osteoblast-like cells cultivated for 24 h, 3 and 7 d directly on hydrogel–microparticle composites formed after addition of microparticle groups C, D or E to GG solution. GG hydrogels without particles and TCPS served as controls. Scale bars = 10 µm on all images.
Download figure:
Standard image High-resolution image
4. Discussion
The goals of this study are: (i) the generation and characterization of carbonate particles with different calcium and magnesium contents and (ii) the generation of injectable gellan gum hydrogel–microparticle composites and their characterization.
4.1. Physicochemical characterization of particles and particle-hydrogel composites
In the absence of Mg, i.e. in microparticle group A, a mixture of vaterite and calcite formed. This was demonstrated by the FTIR (figure 1) and Raman (figure 2) XRD (figure 3), SEM (figures 4 and S1), TEM and SAED (figure 5) data.
Vaterite particles have a porous polycrystalline structure with surface with porosity of approximately 40% (Volodkin et al 2004, Parakhonskiy et al 2013, Donatan et al 2016) independently of particle size and shape. For this reason the density of the vaterite spherolite was 1.6 gcm−3 (Volodkin et al 2004) which is 1.7 times lower than the solid calcite or vaterite crystal with a density of 2.6–2.7 g cm−1. Based on this fact it is possible to explain the difference between the amount of calcite and vaterite particles calculated on the basis of SEM images (by number of particles) and by XRD spectra (by mass). Simple recalculation of the vaterite mass using spherical approximation of the particles shape yields a particle volume of 2.1 µm3, which in turn yields a particle mass of 3.4 × 10⁻¹² g. For calcite, the average particle size is 2.1 ± 0.6 µm, which translates to a particle mass of 13 × 10−12 g.
Based on SEM results, numerically 83% of the particles are vaterite and 17% are calcite. This corresponds to 57% vaterite and 42% calcite by mass. This in turn corresponds well with the XRD results (60% vaterite and 40% calcite).
It is well known that when Ca and carbonate ions are mixed in solution, the polymorph vaterite forms, which undergoes conversion to calcite in aqueous media and in the presence of sodium chloride (Parakhonskiy et al 2011, 2012, 2013). The fact that a significant proportion had recrystallized to calcite was probably due to the fact that drying took place overnight at 37 °C. Residual moisture may have enabled some recrystallization to take place.
Increasing Mg content of the microparticles led to a reduction in crystallinity, as demonstrated by the decrease of the intensity and increase of width of Raman bands (figure 2), XRD peaks (figure 3) and the increasing occurrence of undefined non-crystalline mineral deposits by SEM and TEM (figures 4 and 5) and the decrease in clarity of SAED diffraction patterns (figure 5). Microparticle group B appeared to consist of magnesian calcite with some vaterite, as evidenced by Raman (figure 2) and XRD (figure 3). Mg ions are more strongly hydrated than Ca ions and can inhibit calcite formation by binding to the surface of calcite nuclei and hindering further crystal growth (Folk 1974). This explains the decrease in crystallinity in the order A > B > C > D > E.
Presumably, the increasing amorphicity in the order A > B > C > D > E results in increasing solubility, which in turn leads to higher release of Mg and Ca ions which can crosslink GG. Indeed, the amorphicity of sample D led to higher Mg release (online supplementary figure S4). This would explain why microparticle groups C, D and E induced gelation of GG (figure 6, online supplementary figures S2 and S3), whereas microparticle groups A and B did not. The decrease in mechanical strength of the hydrogel–microparticle composites in the order D > C > E (online supplementary figure S3) might be explained by the differences in Ca and Mg release (online supplementary figure S4). Microparticle group D released more Mg than group C, which in turn released more Ca than group E. It should be borne in mind that release studies were performed in water. The kinetics of ion release into water and the diffusion of ions in water may not be similar to those in GG solution and crosslinked GG hydrogels, as GG has the ability to bind Ca2+ and Mg2+ ions and crosslinking of GG polymer chains during hydrogel formation may impede diffusion.
4.2. Cell biological characterization
Cytotoxicity testing of hydrogel–microparticle composites (figure 8 and online supplementary figure S5) revealed no striking differences between them and controls. This suggests that the concentration of Ca and Mg ions in eluates is not cytotoxic and does not promote cell proliferation.
Cells seeded on hydrogel–microparticle composites did not show a more spread morphology than those on GG (figure 9). Perhaps the particle concentration (2%) is too low to significantly influence cell adhesion. The reason for the increased cell clustering on hydrogel–particle composites in comparison to GG remains unclear. The reasons for the increased cell death on composites containing microparticle group E remain unclear. Ion release from microparticle group E was lower than that from groups C and D (online supplementary figure S4), which suggests that increased ion release is not the cause, but in the absence of further data, such discussion must remain speculative. It is also unclear why cell proliferation was higher on composites containing microparticle group C (figure 10). One may speculate that the differences in ion release from microparticles (online supplementary figure S4), caused by differences in crystallinity, and differences in hydrogel stiffness (online supplementary figure S3) may play a role.
MG-63 cells are considered to be a good model for studies on cell adhesion and proliferation, as performed in this study. Further work will include investigation of osteogenic differentiation and bone matrix production. For such studies, Saos-2 cells and primary osteoblasts will be selected as their expression of important osteogenic markers is generally much higher on both mRNA and protein levels (Pautke et al 2004, Shapira and Halabi 2009, Saldana et al 2011, Czekanska et al 2012, 2014).
5. Conclusions
Solutions of Ca2+/Mg2+ ions and  ions were mixed to produce carbonate microparticles. The Ca:Mg elemental ratio in microparticle groups A, B, C, D and E was approximately the same as the elemental ratio of Ca2+ to Mg2+ ions in solution. Increasing the amount of Mg mineral led to a reduction in the crystallinity of the mineral formed. Group A consisted mainly of vaterite with some calcite. Group B, containing more Mg, consisted of magnesian calcite with some vaterite. By increasing the Mg amount still further, the mineral became amorphous, as detected in groups C, D and E. Microparticles formed in group A had a spherical morphology characteristic for vaterite, but microparticles in all other groups had a irregular morphology. Addition of microparticle groups A and B to GG solution did not induce hydrogel formation, but addition of groups C, D and E caused gelation within 20 min. μCT revealed that microparticles of groups C, D and E were dispersed in hydrogel–microparticle composites. Hydrogel–microparticle composites containing groups C, D and E were cytocompatible towards MG-63 osteoblast-like cells. Cell growth on hydrogel–microparticle composites containing group C was superior to growth on pure GG hydrogels after 7 d. However, cell growth on composites containing groups D and E was inferior.
Acknowledgments
Timothy E L Douglas and Bogdan V Parakhonskiy acknowledge the Research Foundation Flanders (FWO) for support in the framework of a postdoctoral fellowship. Tom Planckaert, Nancy De Saeyer, Emmy Peuquer, Johanna Aernoudt and Pieter Zwaenenpoel are thanked for excellent technical assistance. Prof Kevin Braeckmans and Dr Bart Lucas are thanked for enabling rheometrical measurements to be performed. Prof Lucie Bačaková, Academy of Sciences of the Czech Republic, is thanked for helpful discussions. Andre G Skirtach also acknowledges the support of BOF UGent. The ERA-Net Rus Plus project 'Fabrication and investigation of new hybrid scaffolds with the controlled porous hierarchy for bone tissue engineering' (Intelbiocomp) is thanked for support.
Conflict of interest, ethical approval, original publication and author contribution statements
The authors have no conflict of interest. No ethical approval was required for this study. No part of this work has been previously published or submitted for publication elsewhere. The authors made the following contributions to the paper: Timothy E L Douglas conceived, designed, planned and coordinated the study, interpreted the data and wrote the majority of the manuscript. Agata Łapa wrote a significant part of the manuscript and together with Katarzyna Reczyńska and Krzysztof Pietryga, created and prepared all the samples for physicochemical and cell biological characterization. Sangram Keshari Samal performed DLS analysis (table 2) and helped with rheometry (figure S3). Małgorzata Krok-Borkowicz performed cell biological characterization (figures 8–10 and S5). Heidi A Declercq performed licht microscopy analysis (figure 6). David Schaubroeck performed SEM analysis (figure 4). Marijn Boone and Veerle Cnudde performed μCT analysis (figure 7). Pascal Van der Voort performed Raman and XRD analysis (figures 2 and 3). Karel De Schamphelaere performed AAS analysis (table 3). Christian V Stevens performed FTIR analysis (figure 1). Vitaliy Bliznuk performed TEM and SAED analysis (figure 5). Bogdan V Parakhonskiy analysed, presented and discussed Raman results (figure 2) XRD results (figure 3) and analysis of SEM images (figure S1). Lieve Balcaen and Frank Vanhaecke performed ICP-OES analysis of release of elemental calcium and magnesium from particles (figure S4). Elżbieta Pamuła co-coordinated the study, co-performed extensive preliminary studies, instructed A Łapa in sample preparation and provided significant logistical help. Andre G Skirtach co-coordinated the study and provided significant logistical help. All authors contributed to the interpretation of the results and the improvement of the discussion.