

Abstract
We quantify the source contributions to surface PM2.5 (fine particulate matter) pollution over North China from January 2013 to 2015 using the GEOS-Chem chemical transport model and its adjoint with improved model horizontal resolution (1/4° × 5/16°) and aqueous-phase chemistry for sulfate production. The adjoint method attributes the PM2.5 pollution to emissions from different source sectors and chemical species at the model resolution. Wintertime surface PM2.5 over Beijing is contributed by emissions of organic carbon (27% of the total source contribution), anthropogenic fine dust (27%), and SO2 (14%), which are mainly from residential and industrial sources, followed by NH3 (13%) primarily from agricultural activities. About half of the Beijing pollution originates from sources outside of the city municipality. Adjoint analyses for other cities in North China all show significant regional pollution transport, supporting a joint regional control policy for effectively mitigating the PM2.5 air pollution.
Export citation and abstract BibTeX RIS

Content from this work may be used under the terms of the Creative Commons Attribution 3.0 licence. Any further distribution of this work must maintain attribution to the author(s) and the title of the work, journal citation and DOI.
1. Introduction
Severe particulate matter pollution in recent years has become a major environmental problem in China and has received broad interest worldwide (van Donkelaar et al 2010, Zhang et al 2013, He et al 2014, Guo et al 2014, Huang et al 2014). In January 2013, northern and eastern China experienced record-high polluted haze events with daily mean PM2.5 concentrations exceeding 500 μg m−3 at some cities in North China, raising deep public concerns on the health effects, particularly in the populated Beijing–Tianjin–Hebei region (Wang et al 2014a, 2014b). Better understanding of the sources and processes controlling the PM2.5 pollution over North China has become an important and urgent issue with implications for air quality policy.
PM2.5 includes various directly emitted primary aerosols and secondary aerosols that are formed through chemistry of gaseous precursors in the atmosphere (Seinfeld and Pandis 2006). The complexity in composition and nonlinearity in chemistry make it a challenge to quantify the contributing sources for PM2.5 pollution. Previous studies on source attribution of Chinese air pollution are based on measurement statistics (such as positive matrix factorization (PMF)) (Zhang et al 2013, Tao et al 2014, Zhang et al 2014a), back-trajectory receptor models (Wang et al 2004, Zhang et al 2013), the response surface modeling technique (Wang et al 2011) or sensitivity simulations with a chemical transport model (CTM) (Wang et al 2014a). However, these methods generally ignore the nonlinear chemistry of aerosol formation, or require unaffordable computational time. Here we use the nested-grid GEOS-Chem CTM and its adjoint model with a horizontal resolution of 1/4° × 5/16° to examine the sources of PM2.5 pollution over North China, and we interpret the source attribution results based on emission sectors, chemical species, and local versus regional transport influences.
2. Model description and method
The GEOS-Chem CTM (http://geos-chem.org, Bey et al 2001) is driven by assimilated meteorological data from the Goddard Earth Observing System (GEOS) of the NASA Global Modeling and Assimilation Office (GMAO). The latest version of GEOS-FP dataset has a temporal resolution of 3 h (1 h for surface variables and mixing depths) and a horizontal resolution of 1/4° × 5/16°. We use a nested-grid version of GEOS-Chem (Chen et al 2009, Zhang et al 2014b) with the native 1/4° × 5/16° horizontal resolution over East Asia (70°E–140°E, 15°N–55°N) and 2° × 2.5° over the rest of the world.
The model simulates a fully coupled tropospheric ozone-NOx-hydrocarbon-aerosol chemistry (Park et al 2004), with gas-aerosol phase partitioning of the ammonium- sulfate–nitrate–water system calculated with the ISORROPIA II thermodynamic equilibrium model (Fountoukis and Nenes 2007). Details of the model chemical scheme and global emissions have been described by Zhang et al (2012, 2014b) in the context of nitrogen deposition and surface ozone pollution over the United States. Model simulated PM2.5 concentrations are sums of black carbon (BC), organic carbon (OC), sulfate (SO42−), nitrate (NO3−), ammonium (NH4+), and fine dust concentrations.
For anthropogenic emissions over China we use the Multi-Resolution Emission Inventory of China for the year 2010 (MEIC, http://meicmodel.org), which is an updated version of the bottom-up emission inventory developed by Zhang et al (2009) and Lei et al (2011). Emissions are separated to five major sectors including industry, residential, power plants, transportation, and agriculture (Zhang et al 2009). Primary aerosols and gas precursors emissions over China for January are estimated to be: SO2 (2.6 Tg), NOx (2.4 Tg as NO2), NH3 (0.55 Tg), BC (0.23 Tg), OC (0.62 Tg), and anthropogenic fine dust (0.62 Tg). The standard GEOS-Chem model only includes emissions of natural mineral dust in four size bins with radii 0.1–1.0, 1.0–1.8, 1.8–3.0, and 3.0–6.0 μm as described by Fairlie et al (2007). They are involved in tropospheric chemistry through aerosol effects on photolysis rates (Martin et al 2003) and heterogeneous aerosol chemistry parameterized as uptake coefficients (Jacob 2000, Fairlie et al 2010). Bottom-up emission estimates suggest that other anthropogenic primary PM2.5 emissions besides BC and OC (mainly Ca and Mg) over China can be significant (Zhang et al 2007, Lei et al 2011). Here we have implemented in GEOS-Chem the anthropogenic PM2.5 emissions (Lei et al 2011) and treated them as the finest mineral dust.
The adjoint model offers a computationally efficient approach to calculate the sensitivity of a model scalar (e.g. PM2.5 concentration at a given receptor) to all model parameters (e. g. emissions in all model grid cells) in a single model run. As described in Henze et al (2007, 2009) and Zhao et al (2015), the GEOS-Chem model can be viewed as a numerical operator F:  where cn denotes all tracer concentrations at time step n and p is a vector of model parameters such as emissions. Considering the PM2.5 concentration at a given receptor and time, J, we define the sensitivity
  and
and  then
then  represents the sensitivity of J to model parameters (meaning how much J would change due to small perturbations in p), and
  represents its sensitivity to the initial conditions. The adjoint model iteratively computes those sensitivities simultaneously backwards in time:
  and
and  where
where  and
and  are the transpose of the model Jacobian matrices with respect to cn and p.
The adjoint of GEOS-Chem was developed by Henze et al (2007) and Kopacz et al (2009) for optimizing aerosol and CO sources, respectively. The adjoint includes transport, gas-phase chemistry, and heterogeneous chemistry to fully represent the inorganic PM2.5 simulation (Henze et al 2007, 2009). Capps et al (2012) further implemented the adjoint of the ISORROPIA II model. The GEOS-Chem adjoint model has been validated and applied in a number of studies to analyze aerosol sensitivities and optimize aerosol sources (Henze et al 2007, 2009, Wang et al 2012, Kharol et al 2013, Zhu et al 2013). We extend here the capability of the GEOS-Chem adjoint to a nested-grid version driven by the GEOS-FP data with the fine 1/4° × 5/16° horizontal resolution. This fine resolution allows GEOS-Chem to better represent the heterogeneity in topography and emissions over North China (Chen et al 2009), which is particularly important for resolving urban air pollution discussed in this study.
3. Results and discussion
3.1. Model simulation of PM2.5 over China
We compare the model simulation of PM2.5 concentration and chemical composition to surface measurements by the China Meteorological Administration (CMA) for the winter month of January. A number of studies have analyzed the episodic haze events during January 2013 (He et al 2014, Wang et al 2014b, Zhang et al 2014a). We focus on the monthly averages representing the mean atmospheric condition to target emission control strategies for a long-term air quality improvement. Previous studies have shown that the haze pollution events in January 2013 over North China were characterized by large amounts of sulfate aerosol and models underestimated the observed sulfate enhancements likely due to missing mechanisms of heterogeneous chemistry (He et al 2014, Wang et al 2014b, Zheng et al 2015). The standard GEOS-Chem model simulates sulfate production from aqueous-phase oxidation of SO2 by hydrogen peroxide (H2O2) and ozone (O3) in clouds, and gas-phase oxidization of SO2 by OH (Park et al 2004). By adding heterogeneous uptake of SO2 on deliquesced aerosols under high-relative humidity conditions, Wang et al (2014b) partly improved the model sulfate simulation. In this study we examine the mechanism of aqueous-phase oxidation of S(IV) (the sum of dissolved SO2, HSO3−, and SO32−) by dissolved nitrogen dioxide (NO2) that has been documented in the literature (Lee and Schwartz 1983, Clifton et al 1988, Sarwar et al 2013) but not yet included in GEOS-Chem.
The mechanism proposed by Lee and Schwartz (1983) gives the aqueous-phase reaction:  Clifton et al (1988) further studied the reaction and found rate constants 1–2 orders of magnitude higher than Lee and Schwartz (1983). The rate constants were summarized by Sarwar et al (2013) as a function of pH:
  Although NO2 is only weakly soluble, the reaction can be important under conditions with high NO2 concentrations and pH values (Littlejohn et al 1993). We implement this aqueous-phase reaction on both cloud droplets and deliquescent aerosols using the rate constant function as described above. The pH values are assumed to be 4.5 in clouds (Alexander et al 2009) and 5.6 for deliquescent aerosols based on aerosol measurements taken at a suburban site near Beijing in winter 2012 (T-M Fu, unpublished data). Figure 1 shows the simulated mean sulfate aerosol concentrations in surface air over North China for January 2013 from the standard and improved simulations. With this reaction, the simulation shows on average 68% increases in January mean sulfate concentrations at the surface of North China. Using a pH value of 4.5 for deliquescent aerosols would decrease the sulfate concentrations by 14% relative to the results with pH value of 5.6. In addition, we apply the aqueous-phase oxidation of SO2 by H2O2 and O3 on deliquescent aerosols, further increasing the surface sulfate concentrations over North China by 22% (figure 1(c)).

Figure 1. GEOS-Chem simulation of surface sulfate aerosol concentrations over North China for January 2013. Model results from (a) the standard simulation are compared to improved simulations with (b) the aqueous-phase oxidation of S(IV) by NO2 and (c) further with the aqueous-phase oxidation of SO2 by H2O2 and O3 on deliquescent aerosols (see text for more details). The values inset represent the mean concentration averaged over North China.
Download figure:
Standard image High-resolution imageFigure 2 compares monthly mean observed versus simulated total PM2.5 concentrations at 34 CMA monitoring sites for January 2013. Aerosol chemical composition measurements including sulfate, nitrate, ammonium, black carbon (BC), and organic carbon (OC) at 13 CMA monitoring sites for January 2006–2007 (Zhang et al 2012) are also shown in figure 2. The model generally captures the spatial distributions of measured PM2.5 and aerosol composition concentrations with correlation coefficients of 0.65–0.84 and small biases for sulfate, nitrate and ammonium (within 10%; up to −23% for BC).
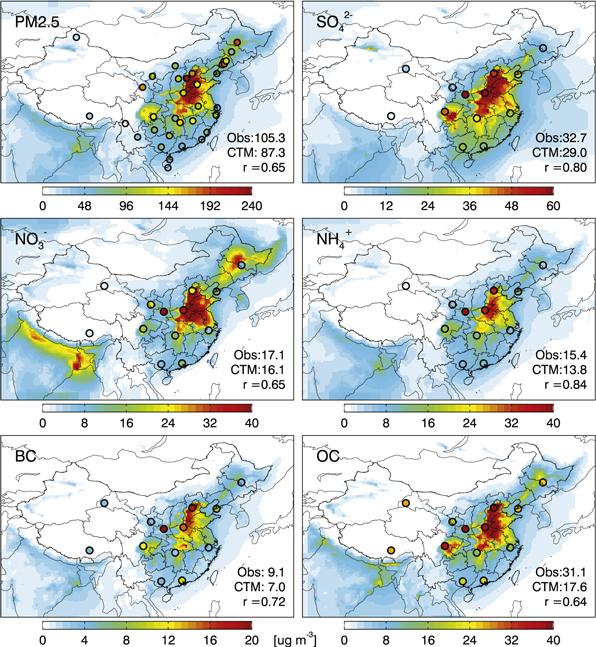
Figure 2. Model simulation of surface concentrations of PM2.5 and aerosol composition including sulfate (SO42−), nitrate (NO3−), ammonium (NH4+), black carbon (BC) and organic carbon (OC) in January over China. Measurements of PM2.5 (January 2013) and aerosol composition (January 2006–2007) at the China Meteorological Administration (CMA) surface sites (circles) are compared with model results (January 2013). Mean observed and simulated concentrations, and correlation coefficients are shown inset.
Download figure:
Standard image High-resolution imageThe model underestimates OC concentrations by 43% on average, particularly over the sites in the western China and southern China. This large OC underestimate has also been discussed by Fu et al (2012). Using surface measurements including those presented here, they pointed out a national-scale underestimate of the Chinese OC anthropogenic emissions and in western China a missing OC source associated with biofuels for heating during the cold months. In addition, our study does not include secondary organic carbon, which accounts for 21% of the annual mean surface OC in China as simulated by GEOS-Chem (Fu et al 2012).
The model successfully simulates the high sulfate concentrations over North China in winter owing to the improved aqueous-phase chemistry for sulfate production as described above. The finer model horizontal resolution also improves the comparison by better capturing the spatial variability in PM distributions. We find BC and OC concentrations in a simulation at the coarser 2° × 2.5° resolution are respectively 48% and 65% lower than the measurements.
3.2. Adjoint source attribution for PM2.5 pollution
We use the adjoint model to calculate the sensitivity of surface PM2.5 concentration over Beijing (the 1/4° × 5/16° grid cell covering the center of Beijing: 39.9°N, 116.3°E) to all aerosol sources over North China. Figure 3 shows the adjoint sensitivities for the mean surface PM2.5 concentration at Beijing averaged from January 2013 to 2015 separated into different source sectors and chemical species at the model underlying resolution. The magnitudes represent approximately how much the January mean PM2.5 at Beijing would reduce in the absence of the specific emissions. Summing all values over the model domain gives 122 μg m−3, about 86% of the simulated mean PM2.5 concentration (142 μg m−3). The discrepancy is mainly attributed to the nonlinear response of PM2.5 to emissions (Henze et al 2007, 2009). We find contributions from natural emissions (e.g. NH3 from oceans and NOx from soils) and sources outside the model domain are small (less than 2%).
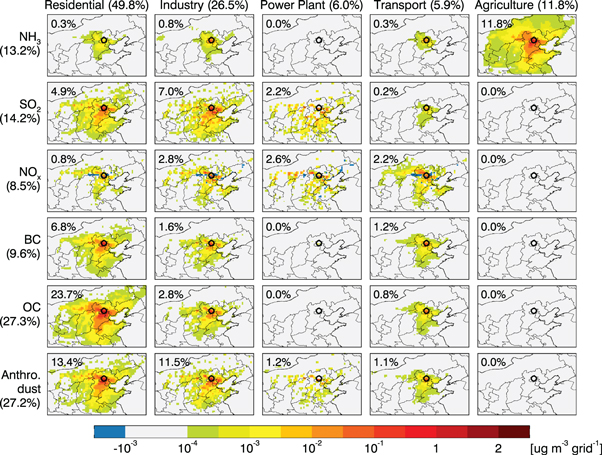
Figure 3. Sensitivity of surface PM2.5 concentration over Bejing to aerosol emissions over North China averaged for January 2013–2015 as computed by the GEOS-Chem adjoint model. Sensitivities are separated by different emissions sectors and chemical species at the model 1/4° × 5/16° horizontal resolution. The numbers represent percent contributions of sensitivity from the specific emissions to the total sensitivity summed over all emissions and over the model domain. The open circle denotes the location of Beijing.
Download figure:
Standard image High-resolution imageFigure 3 shows large source contributions from residential and industrial emissions of SO2, OC, and anthropogenic fine dust, consistent with the intensified use of coal over North China during the heating season (Zhang et al 2014a, Zhang et al 2013). Large source contributions are also seen from agricultural emissions of NH3 reflecting formation of ammonium sulfate and ammonium nitrate aerosols (Wang et al 2011, Kharol et al 2013). We find in the model increasing NOx emissions would enhance the wintertime ozone titration, and thus suppress sulfate production from SO2 oxidation by ozone, leading to some negative sensitivity with respect to NOx emissions.
We sum the adjoint sensitivities across different dimensions and interpret them as percentage contributions to the total sensitivity. By chemical species, the January mean PM2.5 over Beijing is generated by emissions of OC (27.3%), anthropogenic fine dust (27.2%), SO2 (14.2%), NH3 (13.2%), BC (9.6%), and NOx (8.5%). Zhang et al (2013) also showed largest fractions of OC (28.6%) and dust (28.9%) in wintertime PM2.5 measurements in Beijing. Previous studies suggested that secondary inorganic aerosols (sulfate, ammonium, and nitrate) over North China are most sensitive to NH3 emissions and least to NOx emissions in winter (Kharol et al 2013, Wang et al 2013). Our results also show weakest sensitivity for NOx emissions, but higher sensitivity for SO2 than NH3 due to the enhanced aqueous-phase sulfate production.
By emission sector, residential (49.8%) and industrial sources (26.5%) show the largest sensitivities, followed by agriculture (11.8%), transportation (5.9%), and power plants (6%). The estimated contributions heavily rely on the bottom-up sectorial emissions with uncertainties in both the emission magnitude and sectorial contribution. The contribution from transportation can be largely underestimated because secondary organic aerosols (SOA) are not included. Recent laboratory studies show emissions from gasoline vehicles cause significant formation of SOA that can be 6–10 times higher than their primary OC emissions (Nordin et al 2013, Gordon et al 2014). In a sensitivity simulation with OC emissions from transportation increased by a factor of 10, we find that the resulting contribution of transportation can reach 12%.
Comparison with previous studies using the PMF method (Zhang et al 2013, Huang et al 2014) is complicated by the different source categories identified. Huang et al (2014) found dominant contributions from coal burning and secondary aerosols for 5–25 January 2013. Zhang et al (2013) estimated major source contributions from coal burning (57%), soil dust (16%), industrial pollution (12%), and secondary inorganic aerosol (6%) for PM2.5 over Beijing in winter 2010. Our adjoint results are qualitatively consistent with the PMF results; both show the largest contribution from coal burning, which dominates the residential and industrial emissions. The PMF results also indicated the importance of secondary aerosols but the adjoint method is able to attribute them to precursor emissions. Future research is needed to reconcile the source category definitions among different source attribution methods.
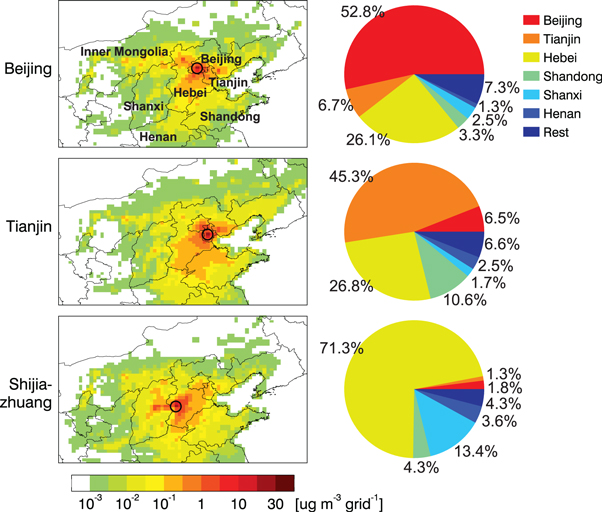
Lastly, when we consider the source influences summed by region, the geographical distribution of adjoint sensitivity indicates strong pollution transport from the southern Hebei Province and from the west (Shanxi Province and Inner Mongolia; see the top left panel of figure 4 for the regions) to Beijing. The transport pathways are consistent with results from back-trajectory models (Wang et al 2004, Zhang et al 2013). Summing sensitivities over the municipality of Beijing accounts for 52.8% of the total sensitivity. Sources over Hebei Province account for 26.1% of the total sensitivity, 6.7% from Tianjin, and the rest 14% transported from sources further away.
Figure 4. Sensitivity of mean surface PM2.5 concentrations at Beijing (top), Tianjin (middle), and Shijiazhuang (bottom) to the spatial distribution of aerosol emissions averaged for January 2013–2015: (left) integrals of all chemical species and emission sectors in figure 3; (right) percentage contributions summing geographically over municipalities of Beijing, Tianjin, Hebei and other provinces as labeled in the top-left panel. The open circles denote locations of the three cities.
Download figure:
Standard image High-resolution image
We further apply the adjoint to Tianjin (39.13°N, 117.20°E) and Shijiazhuang (38.05°N, 114.48°E; capital city of Heibei Province) over North China. The left panels of figure 4 show the sensitivities of mean surface PM2.5 concentrations at Beijing, Tianjin, and Shijiazhuang to the spatial distribution of aerosol emissions for January 2013–2015. The right panels of figure 4 summarize the percent contributions integrating geographically over municipalities of Beijing, Tianjin, Hebei and other regions. All three cities show strong regional pollution transport influences spreading over North China. Beijing and Tianjin show local PM2.5 source contributions of 45–53%, and large contributions of ∼26% from sources over Hebei. PM2.5 over Shijiazhuang is less impacted by sources in Beijing (less than 2%), but show considerable influences from Shanxi Province (13%) owing to the prevailing southwest winds (Wang et al 2014a).
The Action Plan on Air Pollution Prevention and Control released by the Chinese State Council in September 2013 set a strict target for the Beijing–Tianjin–Hebei region with the PM2.5 concentrations to be reduced by 25% by 2017 relative to 2012 (Chinese State Council 2013). We can see for Beijing in January, it would require at least 46% reduction of all emissions in Beijing if only a local control policy is applied, or on average 29% reduction of emissions in the Beijing–Tianjin–Hebei region with a joint regional pollution control policy.
4. Conclusions
In summary, we have applied the adjoint method to quantify the sources contributing to surface PM2.5 pollution over North China from January 2013 to 2015 using the GEOS-Chem chemical transport model at 1/4° × 5/16° horizontal resolution. We show that wintertime surface PM2.5 over Beijing is largely contributed by emissions of organic carbon, anthropogenic fine dust, and SO2 mainly from residential and industrial sources, and by emissions of NH3 primarily from agricultural activities. By identifying the most influential source origins at fine geographical resolution, the adjoint sensitivity map can provide valuable information to design effective air quality strategies to mitigate the PM2.5 air pollution. The results presented here do not address uncertainties in the model emission inventory; this can be improved by assimilating observations to optimize aerosol emissions using the adjoint when more observations become available.
Acknowledgments
This work was funded by China's National Basic Research Program (2014CB441303), and by the National Natural Science Foundation of China (41205103 and 41475112).