

Abstract
By applying the concept of the coupled natural and human system (CNH), we compared spatiotemporal changes in livestock (LSK), land cover, and ecosystem production to understand the relative roles that natural and social driving forces have on CNH dynamics on the Mongolia plateau. We used socioeconomic and physical data at prefecture level for Inner Mongolia and Mongolia from 1981 through 2010 to represent changes in net primary productivity (NPP), enhanced vegetation index (EVI), precipitation, annual average temperature, LSK, livestock density (LSKD), land cover change (LCC), gross domestic production (GDP), and population (POP). The ratios such as LSK:NPP, LSKD: EVI, LSKD:albedo, LSK:POP, and LSK:GDP were examined and compared between Inner Mongolia and Mongolia, and structural equation modeling (SEM) was applied to quantify the complex interactions. Substantial differences in LSK, POP, and economic development were found among the biomes and between Inner Mongolia and Mongolia. When various indicators for policy shifts—such as the World Trade Organization (WTO) for China, the Third Campaign to Reclaim Abandoned Agriculture Lands (ATAR-3), and the Grain for Green Program for China (GFG)—were added into our SEM, the results showed significant change in the strength of the above relationships. After China joined the WTO, the relationships in Inner Mongolia between LSKD:LCC and LSKD:NPP were immensely strengthened, whereas relationships in NPP:LCC were weakened. In Mongolia, the ATAR-3 program first appeared to be an insignificant policy, but the Collapse of the Soviet Union enhanced the correlation between LSKD:LCC, weakened the connection of LCC:NPP, and did not affect LSKD:NPP. We conclude that human influences on the Mongolian CNH system exceeded those of the biophysical changes, but that the significance varies in time and per biome, as well as between Inner Mongolia and Mongolia.
Export citation and abstract BibTeX RIS
Nomenclature
| Aimag | Administrative Divisions of Mongolia |
| AVHRR | advanced very high resolution radiometer |
| CNH | coupled natural and human system |
| ET | evapotranspiration |
| EVI | enhanced vegetation index |
| GDP | gross domestic production |
| GDPP | GDP per capita |
| GloPEM | AVHRR-based global production efficiency model |
| GPP | gross primary productivity |
| HS | human system |
| IM | Inner Mongolia |
| IPCC | Intergovernmental Panel on Climate Change |
| LCC | land cover change |
| LSK | livestock |
| LSKD | LSK density |
| Meng | Administrative Divisions of Inner Mongolia |
| MERRA | modern-era retrospective analysis for research and applications |
| MG | Mongolia |
| MODIS | moderate resolution imaging spectroradiometer |
| NPP | net primary productivity |
| NS | natural system |
| NTSG | numerical terradynamic simulation group |
| P | annual total precipitation |
| POP | population |
| POPD | POP density |
| PPP | purchasing power parity |
| PRECTOT | monthly means of total precipitation |
| QA/QC | quality assurance/quality control |
| SEM | structural equation modeling |
| T | temperature |
| USD | United States Dollar |
| VIP | vegetation index and phenology |
| Main policy shift events | |||
| Abbreviation | Year | Event | Reference |
| ATAR-3 | 2005 | Third Campaign to Reclaim Abandoned Agriculture Lands | (Pederson et al 2013) |
| CSU | 1991 | Collapse of Soviet Union | (Qi et al 2012) |
| GFG | 1999 | Grain for Green Program of China | (Wang et al 2013a) |
| WTO | 2000 | World Trade Organization | (WTO 2004) |
1. Introduction
Mounting evidences strongly indicate that biophysical and socioeconomic systems are interdependent, with their interactions often nonlinear across spatial, temporal, and organizational scales and emergent behaviors at the system level (Liu et al 2007, Chen and Liu 2014). Based on these evidences, the understanding of environmental processes requires an examination of the complex interactions among the elements of the natural system (NS) and human system (HS), including both the direct and indirect causal relationships among the elements (Groisman et al 2009, Chen et al 2015). These causal relationships include driving forces from both the socioeconomic and climatic perspectives (e.g., population (POP) increase, institutional and/or policy shifts, economic development, climate change, education, etc), which have been shown to regulate ecosystems simultaneously; human disturbances have also been producing much stronger impacts than climate change in recent history (Chen et al 2013, Tian et al 2014).
The unfolding of civilization has demonstrated that ecosystem services have been strongly influenced by human actions, such as national economic policies, formations of governance structures, urbanization, wars, and agricultural expansions and developmental policies (Lafortezza et al 2015). The coupled natural and human (CNH) concept investigates the interactions between the NSs and HSs and their respective processes at different scales in effort to better understand and predict environmental change, human action, and the relationship between them. Additionally, escalating rates of global climate change and human activities are adding complexity to CNH processes and functions (Turner et al 2004, Liu et al 2007, Chen et al 2015).
By applying the CNH concept, our study objective is to compare the spatiotemporal changes in livestock (LSK), land cover, and ecosystem production in order to understand the relative roles of both natural and social driving forces in these dynamics. To do this, we use data at prefecture level for Inner Mongolia and Mongolia over a 30-year period (1981–2010). We expect that human influences on the CNH system exceed those of the biophysical changes and that their relative significances vary in space, time, and biophysical settings (e.g., biome). Specifically, we hypothesize that increased grazing intensity, measured in livestock density (LSKD), will increase surface albedo and reduce vegetation cover and productivity. The magnitude of the grazing effects on land cover change (LCC) varies among biomes and is regulated by a combination of land use, and social, economic, and physical conditions (Wang et al 2013c). More so, major policy shifts may also play a critical role in determining the strength and direction of the above interactions, potentially heightening human influences.
2. Methods
2.1. Study area
We focused our study on the Mongolian plateau, which lies within the jurisdictions of two governments (Inner Mongolia and Mongolia) and three broad biomes (desert, grassland, and forest). A particularly technical challenge is to understand the impact of coupled socioeconomic and biophysical dynamics caused by the misalignment of the boundary delineation in the NSs and HSs. These disparities require that coupled dynamics, including their influence and feedback from land use, be examined through intersecting spatial data of the NSs and HSs. Here, we treated Level-1 administrative divisions (i.e., Meng in Inner Mongolia and Aimag in Mongolia) as the sampling unit to generate the values of biophysical and socioeconomic variables.
With a POP of ∼2.78 million in 2010, Mongolia is the 19th largest country by land area (1.56 million km2) and the most sparsely populated country in the world, with a population density (POPD) of 2.78 per km−2. It is also the world's second-largest landlocked country after Kazakhstan. The country is characterized by a very limited amount of arable land. Much of its area is covered by arid, unproductive steppes, with mountains to the north and west and the Gobi Desert to the south. Approximately 30% of the POP is nomadic or semi-nomadic (Fernández-Giménez 2000). The gross domestic production (GDP) of Mongolia in 2010 was $9.76 billion (standardized with the international value in USD in 2005, a.k.a. purchasing power parity or PPP). Inner Mongolia is the third-largest province in China (1.18 million km2; 12% of China's land area), with a POPD of 24.72 per km2 (i.e., 9 times that of Mongolia). The GDP of Inner Mongolia reached $265.18 billion in 2010.
In Inner Mongolia, desert, grassland, and forest biomes account for 32.58% of three, 47.77% of six, and 19.65% of three land areas out of the 12 Mengs, respectively, whereas in Mongolia they account for 45.03% of seven, 44.11% of eleven, and 10.86% of four land areas out of the 22 Aimags, respectively (John et al 2013a). Historically, Mongolians on the plateau have engaged in nomadic pastoral practices (Reid et al 2014, Chen et al 2015). However, the majority of the pastoral households in both Mongolia and Inner Mongolia in recent decades have begun settling around permanent towns or migrating to large urban centers because of the changing economic and policy conditions (Angerer et al 2008, Ojima and Chuluun 2008, Chen et al 2015). The Collapse of Soviet Union (CSU) and China's economic liberalization led to the end of government subsidies in Mongolia and to the increased privatization of LSK herding in Inner Mongolia. By 2007, the number of LSK in Inner Mongolia and Mongolia reached 110 million and 45 million, respectively, resulting in >60% of pastureland being overgrazed (Qi et al 2012).
The political systems of Inner Mongolia and Mongolia have diverged greatly since 1979 when China opened its doors to the international community. Policy shifts have produced a situation in which land use, livelihood, and LCC are taking place more rapidly in Inner Mongolia than in Mongolia (John et al 2009, Sankey et al 2009, Wang et al 2013a, Liu et al 2014b, Chen et al 2015). In particular, the sedentarization of pastoralists and agricultural expansion has resulted from infrastructure investment and policy actions. As a consequence of LCCs, the severity and frequency of ecosystem disturbances (e.g., dust storms) have drastically increased in Inner Mongolia. Meanwhile, a more recent, political transition in Mongolia and a disinvestment in infrastructure to support traditional livelihoods have reduced grazing pressure. This has produced disproportionate patterns of grassland use, with overgrazing in some places and reduced grazing pressure in other areas. The divergent trajectories of land use changes in Mongolia and Inner Mongolia are expected to escalate over the next two decades. In addition, global warming trends observed since the 1950s resulted in a significant increase in air temperature and shifts in precipitation (Chen et al 2013, Yuan et al 2014), with increased spatial variability rates across the landscapes. With respect to future temperature and precipitation, the Intergovernmental Panel on Climate Change (IPCC 2014) reported that this water-limited region will experience: (1) a warming trend above the global warming mean (3.3 °C by 2100); (2) longer, more intense, and more frequent summer heat waves; (3) altered summer and winter precipitation patterns; and (4) more extreme precipitation events, likely due to the combination of high latitude and altitude (i.e., mostly >800 m a.s.l.).
2.2. Data sources
We used socioeconomic and physical data at the prefecture level to represent changes in net primary productivity (NPP), enhanced vegetation index (EVI), precipitation (P), annual average temperature (T), LSK, GDP, and POP over the 1981–2010 period.
LSK, POP, and GDP of each Meng in Inner Mongolia were taken from the Inner Mongolia Statistical Yearbooks, which was compiled by the Inner Mongolia Statistical Bureau of China. The GDP per capita (GDPP) was converted from local currency to the constant 2005 international value by using conversion rates reported by the World Bank in order to reflect purchasing power over the time in a way that is internationally comparable. For Mongolia, we obtained the LSK and POP of each Aimag from the National Statistical Office of Mongolia for 1981–1990. The Aimag POP for 1991–2010 was directly downloaded from the National Statistical Office Yearbooks in Mongolia (www.1212.mn). The real GDP at Aimag level was not available for Mongolia. Using the GDP at constant 2005 national prices or the 1981–2010 time series from the Penn World table (www.rug.nl/research/ggdc/data/penn-world-table) and the population data series, GDPP was estimated for each year. Then we multiplied the GDPP by each Aimag's population for the real GDP time series at Aimag level. For example, if 12% of the total POP is found in Orkhon, Aimag, then the GDP was estimated as 12% of the national GDP for the year.
We obtained a 1 km resolution shortwave white sky albedo (MCD 43B3, Collection 5) from the moderate resolution imaging spectroradiometer (MODIS) using the Reverb ECHO data portal (http://reverb.echo.nasa.gov/reverb/). We also downloaded the vegetation index and phenology (VIP) version 3 dataset from the NASA MEaSUREs long-term data record program (http://vip.arizona.edu/viplab_data_explorer.php#) in order to obtain the enhanced vegetation index (EVI2, Jiang et al 2008). This dataset consists of three decades (1981–2010) of vegetation indices derived from the advanced very high resolution radiometer (AVHRR) and MODIS at a resolution of 5.6 km. The pixel reliability layer in VIP EVI2 was used to exclude QA/QC flagged pixels in order to account for the possibility of false positives from clouds or snow and to exclude the pixels that were gap filled with either an estimated EVI2 or with pixels that were obtained from a long-term average.
The NPP data were obtained from the global maps at an 8 km resolution with 10-day time steps from 1981 through 2000, which were derived from the AVHRR-based global production efficiency model (GloPEM; http://glcf.umd.edu/data/glopem/index.shtml). In addition, we obtained the MODIS-derived annual NPP from MOD17A3 at a 1 km resolution from the Numerical Terradynamic Simulation Group (NTSG, www.ntsg.umt.edu/data, Mu et al 2011). We extended the GloPEM NPP time series to 2010 by scaling the MODIS NPP values to match based on a common year. The annual mean value for each prefecture was calculated from the pixels within each administrative unit by year.
We acquired the monthly mean T at 2 m height over the canopy (T2M) from the modern-era retrospective analysis for research and applications (MERRA) reanalysis dataset. The T2M (IAU 2D atmospheric single-level diagnostics) data were downloaded from the Goddard Space Flight Center simple subset portal (http://disc.sci.gsfc.nasa.gov/SSW/). We also obtained monthly mean precipitation (PRECTOT) from the MERRA Diagnostic Data portal (MERRA tavg1_2d_flx_Nx), with its original units (kg m−2 s−1) converted to millimeter per month in order to tally annual precipitation (P). All remote sensing layers and gridded climate data were converted from their native projections into an Albers equal area projection to allow for accurate estimates of area.
2.3. Data Analysis and modeling
Following a descriptive comparison of the changes in the NS and HS variables for each of the three biomes in Inner Mongolia and Mongolia, we performed two types of analysis by focusing on the inter-relationships among LSKD, NPP, and LCC, as well as the potential drivers at the prefecture and Inner Mongolian/Mongolian levels. First, we test the hypothesis that grazing intensity (i.e., LSKD) directly affects vegetation characteristics, such as EVI and albedo, and that the relationships vary by biome; also, we test if the direct effect over time and between Inner Mongolia and Mongolia is largely due to the land use pressure placed on the vegetation. Because LSK is mostly determined by herders responding to national policy, economic development, and demand-supply relations, the ratios such as LSK:NPP, LSKD:EVI, LSKD:albedo, LSK:POP, and LSK:GDP are used to reflect the states and changes of the CNH systems (Chen et al 2015).
As a framework for developing and evaluating complex systems, structural equation modeling (SEM) uses two or more structural equations to model multivariate causal relationships. Causal models can involve either measured variables, latent variables, or both, which are typically developed based on theoretical knowledge and designed to represent competing hypotheses about the processes responsible for the dynamics in the data. SEM focuses on covariance instead of correlations among variables, and is highly flexible in dealing with non-normal data, categorical responses, latent variables, hierarchical structure, multi-group comparisons, nonlinearities, and other complicating factors (Grace and Kelley 2006, Grace et al 2012). The result of an SEM is normally expressed as a path diagram. In addition to SEM, we conducted a linear regression based on the least square estimation, a factor analysis based on the principal component method in our models, and also used R for exploratory purposes. In this paper, we hypothesize that GDP and POP are the two primary drivers in LSK, and that EVI, albedo, P, and T primarily regulate NPP.
We first applied the SEM to create an integrated assessment of the complex interactions and feedback between the social, economic, and environmental variables from the plateau, treating them as one macrosystem; and again between Inner Mongolia and Mongolia, treating them as two independent systems. Our SEM was constructed using three latent variables—LSKD, LCC, and NPP—as well as the indirect regulations from policy and physical changes in Inner Mongolia and Mongolia. Here, LSKD is hypothesized to be directly influenced by economic development from GDPP, population density from POPD, and NPP by changes in EVI. EVI is biophysically regulated by a combination of albedo, P, and land surface temperature.
Herein, we hypothesize that major policy shifts will have significant influences on the above relationships and their strengths. 'Policy shifts' in this paper is defined as social events that have direct or indirect implications to the local communities such as herders and farmers. We first researched the various policy changes, such as those identified by Qi et al (2012), during the study period for both Inner Mongolia and Mongolia and selected the two most important policies so that there would be satisfactory replications in our SEM exercise. After preliminary comparisons of the LSKD prior and post policy, we concluded that becoming a member of the WTO in 2000 and the initiatives of GFG policy in 1999 were the two primary policy shifts for Inner Mongolia, while the CSU in 1991 and ATAR-3 from 2005 through 2009 were the two major policy shifts for Mongolia (Qi et al 2012, Pederson et al 2013). The data prior/post to the policy shifts were re-modeled independently before and after each policy was implemented.
3. Results
3.1. Spatiotemporal variations
All eight NS and HS variables exhibited change across biome and country boundaries and over the 30-year study period, particularly in the first decade of the 21st century (table 1). These changes were more pronounced for human system variables than for NS variables. EVI and albedo particularly showed insignificant changes within any biome between 2000 and 2010 and between Inner Mongolia and Mongolia (table 1). NPP decreased slightly in the desert biome from 2000 to 2010 by 5.0 and 8.8 gC m−2 y−1 for Inner Mongolia and Mongolia, respectively. In the grassland and forest biomes, however, NPP increased in Inner Mongolia by 82.5 and 66.5 gC m−2 y−1, respectively, while it decreased in Mongolia by 8.4 and 55.1 gC m−2 y−1, respectively.
Table 1. The mean, standard deviation (std), minimum (min), and maximum (max) of the variables analyzed at prefecture level by biome for Inner Mongolia (IM) and Mongolia (MG) in 2000 and 2010. Variables include livestock (LSK), livestock density (LSKD), population (POP), population density (POPD), gross domestic product in purchasing power parity (GDP in PPP), net primary productivity (NPP), enhanced vegetation index (EVI), and albedo.
| Variable | Forest | Grassland | Desert | ||||||||||
|---|---|---|---|---|---|---|---|---|---|---|---|---|---|
| 2000 | 2010 | 2000 | 2010 | 2000 | 2010 | ||||||||
| IM | MG | IM | MG | IM | MG | IM | MG | IM | MG | IM | MG | ||
| LSK | Mean | 350.40 | 110.72 | 771.23 | 143.59 | 163.64 | 128.76 | 469.46 | 157.00 | 252.52 | 166.22 | 343.56 | 138.79 |
| 104 | Std. | 63.04 | 90.01 | 42.84 | 119.79 | 347.96 | 81.75 | 293.09 | 98.48 | 187.74 | 45.65 | 292.04 | 36.08 |
| Min | 289.60 | 19.45 | 727.06 | 24.98 | 5.65 | 11.25 | 9.26 | 15.32 | 120.69 | 103.66 | 132.57 | 101.03 | |
| Max | 415.47 | 226.96 | 812.61 | 310.13 | 1016.10 | 221.61 | 780.16 | 271.07 | 467.47 | 237.57 | 676.87 | 196.30 | |
| LSKD | Mean | 37.32 | 30.56 | 83.24 | 39.36 | 43.26 | 43.03 | 88.45 | 48.61 | 45.29 | 16.71 | 62.24 | 14.49 |
| N km−2 | Std. | 20.39 | 16.96 | 49.81 | 21.03 | 16.54 | 52.61 | 37.84 | 51.63 | 35.63 | 6.12 | 51.27 | 6.65 |
| Min | 13.78 | 16.27 | 32.35 | 24.29 | 36.18 | 6.69 | 31.62 | 9.02 | 5.02 | 8.92 | 5.51 | 6.05 | |
| Max | 49.34 | 54.91 | 131.88 | 70.51 | 80.82 | 196.47 | 133.43 | 197.28 | 72.70 | 23.89 | 105.27 | 23.53 | |
| POP | Mean | 336.69 | 9.78 | 334.26 | 9.90 | 173.40 | 13.22 | 161.91 | 17.51 | 131.05 | 8.03 | 151.91 | 6.27 |
| 104 | Std. | 91.78 | 1.81 | 91.16 | 1.14 | 81.43 | 21.85 | 82.23 | 35.55 | 99.73 | 1.98 | 121.91 | 1.39 |
| Min | 262.42 | 7.60 | 254.92 | 8.82 | 43.43 | 1.23 | 53.45 | 1.33 | 17.47 | 5.13 | 23.19 | 3.87 | |
| Max | 439.30 | 11.98 | 433.84 | 11.49 | 269.68 | 78.65 | 287.40 | 124.44 | 204.31 | 11.30 | 265.61 | 7.68 | |
| POPD | Mean | 38.21 | 6.80 | 38.22 | 8.07 | 137.54 | 27.63 | 100.48 | 38.61 | 32.51 | 0.80 | 39.37 | 0.64 |
| N km−2 | Std. | 24.05 | 9.78 | 24.34 | 12.49 | 104.16 | 62.70 | 132.38 | 94.77 | 35.07 | 0.29 | 46.58 | 0.28 |
| Min | 10.45 | 1.20 | 10.15 | 1.16 | 4.54 | 0.41 | 5.13 | 0.56 | 0.73 | 0.45 | 0.96 | 0.37 | |
| Max | 52.54 | 21.45 | 53.50 | 26.79 | 278.10 | 194.74 | 342.26 | 308.13 | 70.14 | 1.26 | 91.18 | 1.06 | |
| GDP | Mean | 637.22 | 259.85 | 4454.98 | 424.08 | 1266.56 | 367.25 | 9260.71 | 750.20 | 1328.00 | 176.33 | 11 723.15 | 268.70 |
| In PPP | Std. | 174.64 | 38.64 | 934.97 | 48.79 | 459.35 | 574.87 | 7552.19 | 1523.01 | 417.42 | 47.54 | 6494.14 | 59.77 |
| 2005 $ | Min | 457.80 | 223.42 | 3377.69 | 377.82 | 455.11 | 32.22 | 2185.76 | 57.08 | 847.94 | 125.72 | 4876.12 | 165.93 |
| Max | 806.65 | 312.49 | 5054.99 | 492.46 | 1566.07 | 2087.91 | 23 401.03 | 5331.89 | 1605.34 | 226.99 | 17 794.77 | 329.15 | |
| NPP | Mean | 632.27 | 588.59 | 698.76 | 533.49 | 410.41 | 519.97 | 492.90 | 511.61 | 249.05 | 250.92 | 244.07 | 242.14 |
| g Cm−2 y−1 | Std. | 50.74 | 130.78 | 148.19 | 122.94 | 166.06 | 90.52 | 160.81 | 91.57 | 161.97 | 99.10 | 144.93 | 92.91 |
| Min | 575.61 | 434.93 | 533.43 | 381.93 | 227.99 | 386.03 | 242.79 | 388.30 | 72.89 | 141.34 | 79.65 | 131.21 | |
| Max | 673.53 | 747.54 | 819.61 | 681.73 | 671.77 | 638.78 | 699.91 | 620.59 | 391.54 | 437.02 | 353.27 | 410.53 | |
| EVI | Mean | 0.37 | 0.34 | 0.37 | 0.30 | 0.23 | 0.29 | 0.24 | 0.25 | 0.13 | 0.12 | 0.14 | 0.13 |
| (0–1) | Std. | 0.09 | 0.09 | 0.06 | 0.12 | 0.10 | 0.07 | 0.09 | 0.05 | 0.06 | 0.04 | 0.06 | 0.04 |
| Min | 0.29 | 0.22 | 0.31 | 0.16 | 0.10 | 0.18 | 0.13 | 0.17 | 0.06 | 0.07 | 0.07 | 0.08 | |
| Max | 0.47 | 0.41 | 0.43 | 0.40 | 0.40 | 0.40 | 0.40 | 0.34 | 0.18 | 0.19 | 0.17 | 0.18 | |
| Albedo | Mean | 0.16 | 0.16 | 0.17 | 0.17 | 0.16 | 0.18 | 0.19 | 0.19 | 0.22 | 0.20 | 0.23 | 0.20 |
| (0–1) | Std. | 0.03 | 0.02 | 0.02 | 0.03 | 0.02 | 0.03 | 0.02 | 0.03 | 0.01 | 0.02 | 0.02 | 0.02 |
| Min | 0.13 | 0.13 | 0.15 | 0.15 | 0.15 | 0.13 | 0.17 | 0.15 | 0.21 | 0.18 | 0.21 | 0.18 | |
| Max | 0.18 | 0.19 | 0.18 | 0.21 | 0.22 | 0.23 | 0.22 | 0.23 | 0.23 | 0.24 | 0.24 | 0.24 | |
In contrast, substantial differences in LSK, POP, and economic development were found among the biomes and between Inner Mongolia and Mongolia. The GDPP (equivalent to PPP) in Inner Mongolia was 2.4–7.5 times more than that in Mongolia in 2000. Additionally, PPP was the highest in the desert prefectures that were less populated and the lowest in the forest prefectures in Inner Mongolia. In Mongolia, PPP was the highest for the prefectures in the grassland biome. Differences in PPP and POPD between Inner Mongolia and Mongolia were proportional, with Inner Mongolia's density of grassland and forest biomes at 2.6–5.6 times and desert biomes at 40.6–61.5 times greater than Mongolia's during the study period.
The differences in temporal changes in LSKD between Inner Mongolia and Mongolia are complicated (table 1). In general, the LSK in Inner Mongolia (37–45 head km−2 in 2000 and 62–88 head km−2 in 2010) was much higher than that of Mongolia (17–43 head km−2 in 2000 and 14.5–48.6 head km−2 in 2010), with Inner Mongolia having 1.5, 1.2, and 3.2 times more than Mongolia in 2000. However, LSK of Inner Mongolia increased to 1.7, 2.9, and 5.3 times more desert, grassland, and forest biome, respectively, in 2010. Two surprising distribution patterns were found for LSKD in 2000, including a decrease in LSKD in the desert biome of Mongolia (figure 1) and a similar LSKD in the grassland biome in both Inner Mongolia and Mongolia (∼43 head km−2).

Figure 1. Spatial distribution of livestock density (LSKD, head. km−2), enhanced vegetation index (EVI), and Albedo in 2000 and 2010 on the Mongolia plateau. EVI and albedo are the mean values of June, July, and August.
Download figure:
Standard image High-resolution image3.2. Changes in LSK with CNH variables
Our hypothesis that the changes in EVI and albedo depend significantly on LSKD was not always true for the plateau (figure 2). While albedo increased with LSKD—as hypothesized in the forest biome—it decreased in the grassland of Inner Mongolia and Mongolia and in the desert biome in Mongolia. No significant relationship (P > 0.05) between LSKD and EVI was detected for the desert biome in Inner Mongolia. We found a significantly positive relationship between LSKD and EVI for the forest biome in Mongolia and for the grassland and desert biomes in both Inner Mongolia and Mongolia, a negative relationship for the forest biome in Inner Mongolia, and no significant relationship for the desert biome in Inner Mongolia. These significant relationships were accompanied with low correlations (i.e., R2 values), suggesting higher variations in time and space.
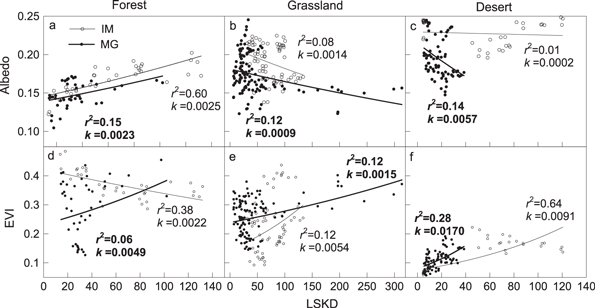
Figure 2. Changes in albedo and EVI with grazing intensity measured by livestock density (LSKD, N km−2) at three biomes in Inner Mongolia (IM) and Mongolia (MG).
Download figure:
Standard image High-resolution imageThe complex relationships between LSKD and albedo/EVI can be explained by examining the changes in LSKD:Albedo and LSKD:EVI over time, especially with the long time series of EVI since 1980 (figure 3). For LSKD:Albedo, there seemed to be a shift increasing all three biomes from 2003 and beyond in Inner Mongolia and Mongolia. There were drops in 2010, coincidently at the same time as the extreme drought in Mongolia in 2009. For LSKD: EVI, the relationship had been mostly stable (except in Mongolia's grassland) prior to 2003, but had increased from 2003 through 2010 in all three biomes—except in 2010 for Mongolia. There was also a relationship increase between LSKD:EVI in the grassland in Mongolia after 1991 when the former Soviet Union withdrew from Mongolia.

Figure 3. Changes in LSKD:Albedo and LSKD:EVI in three biomes from 1981 through 2010 in Inner Mongolia (IM) and Mongolia (MG) before and after policy shifts like the Collapse of the Soviet Union (CSU), Grain to Green, (GFG), food security (ATAR-3) and signatory to World Trade Organization (WTO). Note that MODIS albedo data is not available prior to 2000.
Download figure:
Standard image High-resolution imageThe relationship change in LSK:NPP reflects the amount of LSK by vegetation productivity (figure 4). Among the three biomes in Inner Mongolia, this ratio was the highest in the desert and the lowest in the forest, with a high variation in the desert. In Mongolia, the overall ratio was lower than that in Inner Mongolia, but was the highest in the grassland. Over time, the ratio increased after 2003, with a drop in 2010 in Mongolia.
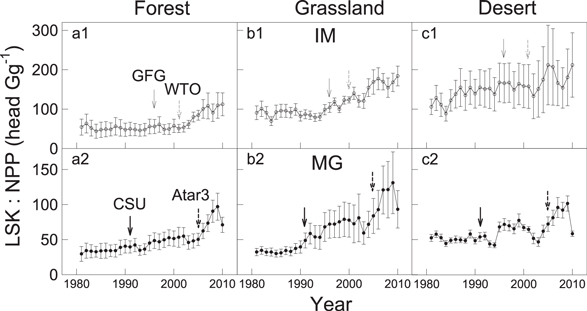
Figure 4. Changes in LSK: NPP in three biomes from 1981 through 2010 in Inner Mongolia (IM) and Mongolia (MG) before and after policy shifts like the Collapse of the Soviet Union (CSU), Grain to Green, (GFG), food security (ATAR-3) and signatory to the World Trade Organization (WTO).
Download figure:
Standard image High-resolution imageThe changes in LSK with human system variables, expressed as LSK:POP and LSK:GDP, also varied in time and space (figure 5). In the forest biome of Inner Mongolia, people owned ∼1.5 head of LSK per person prior to 2013, but this increased to 2.1 head per person afterward; whereas in Mongolia, people owned ∼10 head per person prior to 2006 and ∼15 head per person afterward. Figure 5 demonstrates how the grassland and desert biome in Inner Mongolia was ∼2.3–2.8 in Inner Mongolia and >20 in Mongolia. The higher ratio in Mongolia is mostly due to the low POPD in Mongolia. From an economic perspective, LSK:GDP was lower in Inner Mongolia (2.5–0.1 head per $1 k) than in Mongolia (3.5–12 head per $1 k). There were gradual, decreasing trends in LSK:GDP at all three biomes in Inner Mongolia, but there were also stable, increasing, and varying trends for the forest, grassland, and desert biome in Mongolia.

Figure 5. Changes of the ratio between livestock (LSK), population (POP), and gross domestic production (GDP) in three biomes from 1981 through 2010 in Inner Mongolia (IN) and Mongolia (MG) before and after policy shifts like the Collapse of the Soviet Union (CSU), Grain to Green, (GFG), food security (ATAR-3) and signatory to World Trade Organization (WTO).
Download figure:
Standard image High-resolution image3.3. Region-wide assessment and policy influences
Treating the Mongolian plateau as a whole, we found through our SEM that LSKD, POPD, and NPP were all positively related by using a correlation coefficient (i.e., r value) of 0.75 for LCC:NPP, 0.50 for LSKD:LCC, and 0.31 for LSKD:NPP (figure 6(a)). The independent SEM indicated that the correlation between LSKD and LCC in Inner Mongolia was higher (0.78) than that in Mongolia (0.52) and that the correlation between NPP and LCC (0.88) was lower in Inner Mongolia than that in Mongolia (0.98). No difference (r = 0.39 and 0.30, respectively) was detected for the correlation of LSKD with NPP between Inner Mongolia and Mongolia (figures 6(b) and (c)).
Table 2. Statistics of the structural equation modeling (SEM) for the Mongolian plateau (a), Inner Mongolia (b), and Mongolia (c). Net primary production (NPP); enhanced vegetation index (EVI), livestock density (LSKD), gross domestic product per capita (GDPP), population density (POPD), land cover change (LCC), temperature (T), and precipitation (P).
| (a) Mongolian plateau | β | P | R2 | Residual standard error |
|---|---|---|---|---|
| NPP ← EVI | 0.88 | <2e–16 | 0.78 | 0.47 |
| NPP ← Albedo | −0.18 | 2.34e–14 | ||
| NPP ← T | −0.07 | 3.79e–3 | 0.54 | 0.68 |
| NPP ← P | 0.64 | <2e–16 | ||
| EVI ← Albedo | −0.23 | <2e–16 | ||
| EVI ← T | −0.19 | 4.83e–14 | 0.54 | 0.68 |
| EVI ← P | 0.52 | <2e–16 | ||
| LSKD ← GDPP | 0.13 | 4.65e–6 | ||
| LSKD ← POPD | 0.41 | <2e–16 | 0.22 | 0.88 |
| LSKD ⇔ NPP | 0.33 | <2.2e–16 | ||
| LSKD ⇔ LCC | 0.75 | <2.2e–16 | df = 1018 | |
| LCC ⇔ NPP | 0.80 | <2.2e–16 | ||
| (b) Inner Mongolia | β | P | R2 | Residual standard error |
| NPP ← EVI | 0.85 | <2e–16 | 0.72 | 0.53 |
| NPP ← EVI_GFG(0) | 0.88 | <2e–16 | 0.72 | 0.53 |
| NPP ← EVI_GFG(1) | 0.80 | <2e–16 | ||
| NPP ← Albedo | −0.16 | 3.26e–5 | ||
| NPP ← T | −0.19 | 5.07e–5 | 0.58 | 0.65 |
| NPP ← P | 0.57 | <2e–16 | ||
| EVI ← Albedo | −0.18 | 9.85e–12 | ||
| EVI ← T | −0.58 | <2e–16 | 0.80 | 0.45 |
| EVI ← P | 0.31 | <2e–16 | ||
| LSKD ← GDPP_WTO(0) | 1.44 | 6.91e–8 | ||
| LSKD ← GDPP_WTO(1) | 0.05 | 1.42e–6 | 0.12 | 0.94 |
| LSKD ← POPD | 0.12 | 0.015 | ||
| LSKD ⇔ NPP WTO(0) | 0.39 | 1.45e–9 | ||
| LSKD ⇔ LCC WTO(0) | 0.78 | <2.2e–16 | ||
| LCC ⇔ NPP WTO(0) | 0.88 | <2.2e–16 | ||
| LSKD ⇔ NPP WTO(1) | 0.43 | 2.03e–7 | df = 358 | |
| LSKD ⇔ LCC WTO(1) | 0.88 | <2.2e–16 | df_WTO(0) = 226 | |
| LCC ⇔ NPP WTO(1) | 0.77 | <2.2e–16 | df_WTO(1) = 130 | |
| (c) Mongolia | β | P | R2 | Residual standard error |
| NPP ← EVI | 0.93 | <2e–16 | 0.86 | 0.38 |
| NPP ← EVI_Atar(0) | 0.93 | <2e–16 | 0.86 | 0.38 |
| NPP ← EVI_Atar(1) | 0.88 | <2e–16 | ||
| NPP ← Albedo | −0.21 | 5.11e–14 | ||
| NPP ← T | −0.24 | 4.98e–10 | 0.55 | 0.67 |
| NPP ← P | 0.47 | <2e–16 | ||
| EVI ← Albedo | −0.26 | <2e–16 | ||
| EVI ← T | −0.13 | 1.29e–3 | ||
| EVI ← P | 0.46 | <2e–16 | 0.46 | 0.74 |
| LSKD ← GDPP_CSU(0) | −1.13 | <2e–16 | ||
| LSKD ← GDPP_CSU(1) | 0.87 | 1.42e–6 | ||
| LSKD ← POPD | 1.32 | <2e–16 | 0.12 | 0.94 |
| LSKD ⇔ NPP CSU(0) | 0.30 | 8.70e–6 | ||
| LSKD ⇔ LCC CSU(0) | 0.52 | <2.2e–16 | ||
| LCC ⇔ NPP CSU(0) | 0.98 | <2.2e–16 | ||
| LSKD ⇔ NPP CSU(0) | 0.30 | 5.77e–11 | df = 656 | |
| LSKD ⇔ LCC CSU(0) | 0.84 | <2.2e–16 | df_WTO(0) = 218 | |
| LCC ⇔ NPP CSU(0) | 0.77 | <2.2e–16 | df_WTO(1) = 438 |
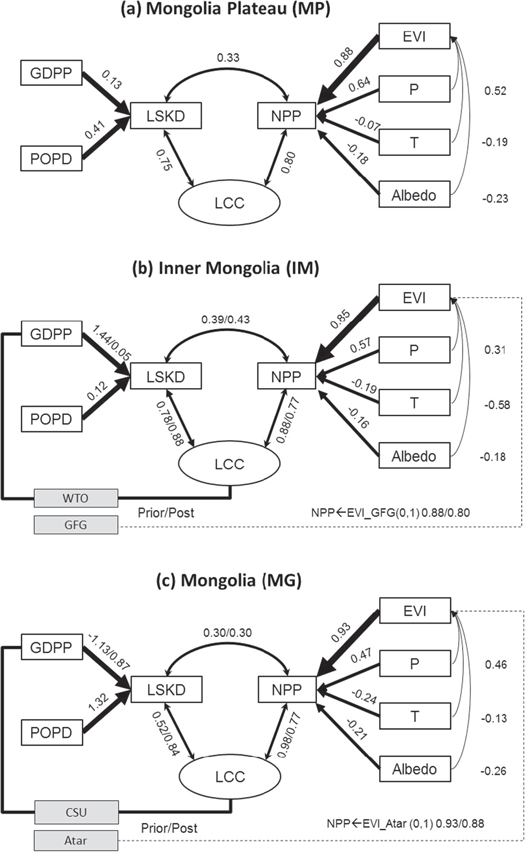
Figure 6. The structure, hypotheses, and results of structural equation modeling (SEM) for: (a) the Mongolia plateau (MP), (b) Inner Mongolia (IN), and (c) Mongolia (MG). Land cover change (LCC) is treated as a latent variable. One-way arrows indicate direct effects (from) while two-way arrows indicate the feedback. The annual means of each prefecture are used as replicates over the 30-year study period.
Download figure:
Standard image High-resolution imageLSKD showed a significant positive change within POPD and GDPP across the plateau, explaining only 22% of the variation in LSKD (table 3). The directions and strengths of the above relationships were not consistent for Inner Mongolia and Mongolia (figures 6(b) and (c)). For Inner Mongolia, GDPP had a very positive role in LSKD while POPD resulted in a weak change (figure 6(b)); whereas for Mongolia, LSKD changed negatively with GDPP and positively with POPD (figure 6(c)).
Table 3. Statistics of correlation between livestock density (LSKD) and gross domestic production per capita (GDPP), population density (POPD) shifted by two kinds of main policies (Collapse of the Soviet Union and WTO) in 12 Mengs of Inner Mongolia (IM) and 22 Aimags of Mongolia (MG). All the variables were normalized with (xi-xmean)/SD.
| Mongolia | GDPP → LSKD | POPD → LSKD | |||||
|---|---|---|---|---|---|---|---|
| Aimag | Slop | R2 | P | Slop | R2 | P | |
| Arkhangai | Prior collapse | ns | ns | ns | ns | ns | ns |
| Post collapse | 3.27 | 0.80 | *** | ns | ns | ns | |
| Bayankhongor | Prior collapse | −0.96 | 0.67 | ** | ns | ns | ns |
| Post Collapse | 0.39 | 0.06 | 0.29 | ns | ns | ns | |
| Bayan-Olgii | Prior collapse | 0.52 | 0.80 | *** | 9.54 | 0.92 | *** |
| Post collapse | ns | ns | ns | 10.12 | 0.25 | * | |
| Bulgan | Prior collapse | ns | ns | ns | ns | ns | ns |
| Post collapse | 4.74 | 0.81 | *** | ns | ns | ns | |
| Darkhan-Uul | Prior collapse | 1.36 | 0.63 | ** | ns | ns | ns |
| Post collapse | 3.36 | 0.60 | *** | 6.05 | 0.4 | ** | |
| Dornod | Prior collapse | −0.22 | 0.54 | * | −15.61 | 0.42 | * |
| Post collapse | 0.82 | 0.86 | *** | 43.32 | 0.51 | *** | |
| Dornogovi | Prior collapse | ns | ns | ns | 2.09 | 0.73 | ** |
| Post Collapse | ns | ns | ns | ns | ns | ns | |
| Dundgovi | Prior collapse | ns | ns | ns | ns | ns | ns |
| Post collapse | ns | ns | ns | ns | ns | ns | |
| Erdenet | Prior collapse | 5.32 | 0.92 | *** | 0.63 | 0.88 | *** |
| Post collapse | 9.25 | 0.61 | *** | 13.91 | 0.41 | ** | |
| Govi-Altai | Prior collapse | ns | ns | ns | ns | ns | ns |
| Post collapse | ns | ns | ns | ns | ns | ns | |
| Khentii | Prior collapse | ns | ns | ns | ns | ns | ns |
| Post collapse | 1.91 | 0.94 | *** | 152.21 | 0.26 | * | |
| Khovd | Prior collapse | ns | ns | ns | ns | ns | ns |
| Post collapse | 0.77 | 0.29 | * | 51.17 | 0.17 | 0.07 | |
| Khovsgol | Prior collapse | ns | ns | ns | 7.06 | 0.51 | * |
| Post collapse | 1.36 | 0.86 | *** | 146.95 | 0.42 | ** | |
| Omnogovi | Prior collapse | ns | ns | ns | ns | ns | ns |
| Post collapse | ns | ns | ns | ns | ns | ns | |
| Ovorkhangai | Prior collapse | ns | ns | ns | −6.21 | 0.42 | * |
| Post collapse | 1.08 | 0.24 | * | ns | ns | ns | |
| Selenge | Prior collapse | 0.25 | 0.49 | * | 4.37 | 0.82 | *** |
| Post collapse | 1.81 | 0.82 | *** | 58.23 | 0.28 | * | |
| Sukhbaatar | Prior collapse | ns | ns | ns | ns | ns | ns |
| Post collapse | 1.69 | 0.66 | *** | −175.75 | 0.23 | * | |
| Tov | Prior collapse | ns | ns | ns | 13.9 | 0.66 | ** |
| Post collapse | 2.55 | 0.69 | *** | −53.71 | 0.31 | * | |
| UB | Prior collapse | 0.38 | 0.87 | *** | 0.47 | 0.92 | *** |
| Post collapse | 0.09 | 0.28 | * | 0.14 | 0.14 | . | |
| Uvs | Prior collapse | 0.46 | 0.45 | * | 19.95 | 0.87 | *** |
| Post collapse | 1.83 | 0.57 | *** | −23.48 | 0.08 | 0.13 | |
| Zavkhan | Prior collapse | ns | ns | ns | 33.9 | 0.61 | ** |
| Post collapse | 2.55 | 0.40 | ** | ns | ns | ns | |
| Inner Mongolia | GDPP → LSKD | POPD → LSKD | |||||
| Meng | Slop | R2 | P | Slop | R2 | P | |
| AlXa Meng | Prior WTO | ns | ns | ns | 11.24 | 0.22 | * |
| Post WTO | ns | ns | ns | ns | ns | ns | |
| Baotou Shi | Prior WTO | ns | ns | ns | 2.89 | 0.29 | * |
| Post WTO | 0.20 | 0.66 | ** | 2.50 | 0.47 | * | |
| BaYanNur Shi | Prior WTO | ns | ns | ns | 12.07 | 0.94 | *** |
| Post WTO | ns | ns | ns | ns | ns | ns | |
| ChiFeng Shi | Prior WTO | ns | ns | ns | −1.80 | 0.34 | ** |
| Post WTO | 0.91 | 0.46 | * | ns | ns | ns | |
| HingGan Meng | Prior WTO | 9.456 | 0.51 | *** | 10.08 | 0.53 | *** |
| Post WTO | 1.56 | 0.32 | . | ns | ns | ns | |
| Hohhot Shi | Prior WTO | 3.68 | 0.69 | *** | 2.51 | 0.75 | *** |
| Post WTO | 0.85 | 0.85 | *** | 2.99 | 0.82 | *** | |
| HuLun Buir Shi | Prior WTO | ns | ns | ns | 6.64 | 0.64 | *** |
| Post WTO | ns | ns | ns | −62.26 | 0.48 | * | |
| OrDos Shi | Prior WTO | ns | ns | ns | ns | ns | ns |
| Post WTO | 0.15 | 0.39 | * | 47.189 | 0.88 | *** | |
| TongLiao Shi | Prior WTO | ns | ns | ns | 1.60 | 0.33 | ** |
| Post WTO | 1.8 | 0.65 | ** | ns | ns | ns | |
| Ulanqab Shi | Prior WTO | 4.5 | 0.31 | * | ns | ns | ns |
| Post WTO | 1.02 | 0.46 | * | −7.52 | 0.96 | *** | |
| WuHai Shi | Prior WTO | 2.00 | 0.46 | ** | 0.25 | 0.41 | ** |
| Post WTO | ns | ns | ns | 0.61 | 0.56 | ** | |
| XiLin Gol Meng | Prior WTO | 4.24 | 0.76 | *** | 64.78 | 0.48 | ** |
| Post WTO | −0.23 | 0.88 | *** | −50.44 | 0.83 | *** | |
Note: Significance <0.05, codes: 0 '***' 0.001 '**' 0.01 '*' 0.05 '.', non-significance 'ns', Govi–Sumber doesn't have data.
NPP could be confidently predicted by EVI, with an R2 of 0.78, 0.72, and 0.86 for the plateau, Inner Mongolia, and Mongolia, respectively (table 2). Alternatively, it can be predicted by a combination of T, P and albedo with an R2 of 0.65–0.68, where the EVI was also highly correlated with this combination (R2 ranged 0.45–0.74). Interestingly, we found that T and albedo had negative correlations with NPP, but that P always had a positive relationship with NPP. These contrasting relationships were consistent when we examined the correlations of EVI independently with P, T, and albedo (figure 6).
Most importantly, the addition of indicators for policy shifts into our SEM significantly changed the strengths of the above relationships for Inner Mongolia and Mongolia (i.e., dashed lines and grey boxes, figures 6(b) and (c)). GFG did not show a significant (P < 0.05) influence in Inner Mongolia, but WTO significantly strengthened the relationship of LSKD:LCC and LSKD:NPP, and weakened the correlation between NPP:LCC (table 2). In Mongolia, the ATAR-3 program appeared to be an insignificant policy, but the CSU enhanced the correlation of LSKD:LCC, weakened the connection of LCC:NPP, and did not affect LSKD:NPP (table 3).
4. Discussion and conclusions
With technological advances and accelerating POP growth, the interactions between humans and the environment have intensified since the industrial revolution. Today, one cannot find an ecosystem that is free of human influence. In Inner Mongolia, estimates put the contributions of land use to variations in gross primary productivity (GPP) and evapotranspiration (ET) at 64 and 84%, respectively (Liu et al 2007) and those of climatic change at 27 and 14%, respectively (Chen et al 2013). Therefore, the land use impact on GPP and ET dynamics were found to be 2.4 and 5.8 times more, respectively, than the impact from climate change. While a quantitative understanding of the CHN driving forces on ecosystem functions remains a great challenge for the scientific community, an even more pressing issue is to understand their dynamics and influence on socioeconomic outcomes (e.g., Wang et al 2013c, Tian et al 2014). Recent scientific efforts have focused on these interactions and the feedback between the HSs and NSs in order to address such needs (e.g., MEA 2005, Pickett et al 2005, Liu et al 2007, Wu 2013, Chen and Liu 2014, Chen et al 2015).
A logical approach for exploring the connections between the elements of the HS and NS is to quantify the spatial and temporal changes among the seemingly related variables. By analyzing the triangular relations among NPP, GDP, and POP, as practiced first by Chen et al (2015), we expanded our endeavors in this study by including biophysical drivers (T, P, and albedo), socioeconomic drivers (GDP and POP), land use (i.e., LSKD) at prefecture and biome levels, and policies at the national level, over a 30-year time span.
From an ecosystem perspective, one would expect that grazing would alter vegetation properties, such as elevating land surface albedo (Lenton and Vaughan 2009, John et al 2013a, Lee et al 2013) and reducing the leaf area (Shao et al 2013, Han et al 2014). However, the positive relationship between albedo and LSKD was found only for the forest biome (figure 2(a)). EVI increased with LSKD except in the forest biome region of Mongolia (figure 2(d)), suggesting that grazing stimulated vegetation in other regions. These results may further suggest that grazing, a major disturbance agent, remained at an intermediate level according to the intermediate disturbance hypothesis, which suggests that ecosystem productivity peaks at intermediate levels of disturbance (Connell 1978). However, the relationship between EVI and LSKD was based on 23 data points prior to 2003, during which the changes were stable; whereas the albedo:LSKD relationship was quantified only for the most recent decade. Therefore, we are unable to differentiate between the causal mechanisms and the time periods investigated, due to possible non-stationarity in the relationships. Future efforts are needed to investigate the grazing intensity and vegetation properties at specific times and locations. Nevertheless, these relationships have obvious effects on ecosystem productivity (figure 4) where similar amounts of NPP have been supporting more LSK in the recent decade. One possible explanation is that the changes in the LSKD:NPP ratio over time were more volatile in Mongolia than in Inner Mongolia, likely reflecting a more advanced LSK management infrastructure in Inner Mongolia than in Mongolia (Zhen et al 2010). For example, two sharp drops in 1994 and 2003 related to extreme winters or dzuds on the plateau (Tachiiri et al 2008, Fernández-Giménez et al 2012) had much smaller effects in Inner Mongolia (John et al 2013b), possibly due to the greater use of confined animal feeding there (Brown et al 2013, Wang et al 2013b).
Socioeconomic influences are the potential causes of the above-mentioned, contrasting changes between Inner Mongolia and Mongolia, as well as among the three biomes. As shown in figure 5, the relationship between LSK and POPD had been stable for both Inner Mongolia and Mongolia until the most recent decade. This suggests that the average LSKD per person increased only in recent years while human POPs in Inner Mongolia and Mongolia have been steadily increasing over the entire study period, suggesting that population density may not be a cue for the change. Again, the sharp drop in the desert biome of Mongolia in 2003 was likely due to the extreme dzuds that killed 8.5 million (30%) LSK in Mongolia (Fernández-Giménez et al 2012). Meanwhile, economic development seems to play a more important role. The steady decrease in the LSK:GDP ratio in Inner Mongolia suggests that the contribution of LSKD to the Inner Mongolian economy has been decreasing, whereas in Mongolia it has retained a strong role. These conclusions are also supported by our SEM analysis (table 2).
The complex relationships discussed above are integrated through several SEMs (figure 6). For the first time, we demonstrated that LCCs are highly correlated with LSKD and NPP. Interestingly, we found that policy (or institutional) shifts played a profound role in LCC for both Inner Mongolia and Mongolia. Specifically, the admission of China into the WTO and the CSU in Mongolia significantly changed GDP and LCC, their relationships with NPP, and Mongolia's biophysical/socioeconomic regulations. For example, the effect of GDP on LSKD due to the policy shift in Inner Mongolia decreased value from 1.44 to 0.05 head per dollar (figure 6(b)), whereas in Mongolia the policy change resulted in a shift from a negative to a positive relationship (figure 6(c)). The correlation between LCC and NPP was also reduced. Surprisingly, we did not find that GFG and ATAR-3 had significant influences on these relationships, which is contrary to many previous reports (Liu et al 2014a). One of the possible reasons may be that GFG was only implemented two years before China became a WTO member in 2001, and ATAR-3 was reconsidered again in 2008 (i.e., only three years data available).
In sum, the data and models support our hypothesis that human influences on the CNH system exceeded those of the biophysical changes, but that the significance varies by time and biome, as well as between Inner Mongolia and Mongolia. Surprisingly, the data did not support the hypothesis that grazing increases albedo and reduces vegetation; yet, there are closely coupled connections among grazing, LCC, and ecosystem production. Economic development seemed to play a more important role in affecting LSK POP than residential POP. Between Inner Mongolia and Mongolia, the CNH system appeared less resistant in Mongolia as demonstrated by the temporal variation in all eight variables in Inner Mongolia, which were higher than those in Mongolia. Most importantly, the policy shifts played a critical role in determining the strength and direction of the relationships between the elements of HSs and NSs (figure 7). However, one should be heedful that this study involved only two policies that were implemented in Inner Mongolia and Mongolia. We recognize that there have been many more policies during the study period. A technical challenge (i.e., assuring sufficient replications for the statistical analysis) prevents us from including too many policy events.

Figure 7. Changes in the correlation between livestock density (LSKD) and gross domestic production per capita (GDPP), population density (POPD) and net primary productivity (NPP) prior/post to the major policies including Collapse of the Soviet Union (CSU) in Inner Mongolia (IM) and in Mongolia (MG). All the variables were normalized with (xi–xmean)/SD.
Download figure:
Standard image High-resolution image
Acknowledgments
This study was partially supported by the 'Dynamics of Coupled Natural and Human Systems (CNH)' Program of the NSF (#1313761), the LCLUC program of NASA (NNX14AD85G), and the Natural Science Foundation of China (31229001). We would like to thank Gabriela Shirkey for editing the language of the manuscript.