

Abstract
Northern Eurasia is one of the largest terrestrial carbon reservoirs on the Earth's surface. However, since the coverage of surface CO2 observations is still limited, the response to the climate variability remains uncertain. We estimated monthly CO2 fluxes for three sub-regions in Northern Eurasia (north of ∼60°N), Northeastern Europe, Western Siberia and Eastern Siberia, using CO2 retrievals from the Japanese Greenhouse Gases Observing SATellite (GOSAT). The variations of estimated CO2 fluxes were examined in terms of the regional climate variability, for the three consecutive growing seasons of 2009–2011. The CO2 fluxes estimated using GOSAT data are highly correlated with the surface temperature anomalies in July and August (r > 0.8) while no correlation is found in the CO2 fluxes estimated only using surface observations. The estimated fluxes from GOSAT data exhibit high negative correlations with one-month lagged positive precipitation anomalies in late summer (r > −0.7) through surface temperature and the Normalized Difference Vegetation Index (NDVI). The results indicate that GOSAT data reflects the changes in terrestrial biospheric processes responding to climate anomalies. In 2010, a large part of Eurasia experienced an extremely hot and dry summer, while cold and wet weather conditions were recorded in Western Siberia. The CO2 fluxes estimated from GOSAT data showed a reduction of net CO2 uptake in Northeastern Europe and Eastern Siberia, but the enhancement of net CO2 uptake in Western Siberia. These opposite sub-regional flux anomalies can be explained by the different climate anomalies on a sub-regional scale in Northern Eurasia. Thus, this study demonstrates that space-based observations by GOSAT compensate for the lack of ground-based observational coverage so as to better capture the inter-annually varying atmosphere-terrestrial biosphere CO2 exchange on a regional scale.
Export citation and abstract BibTeX RIS

Original content from this work may be used under the terms of the Creative Commons Attribution 3.0 licence. Any further distribution of this work must maintain attribution to the author(s) and the title of the work, journal citation and DOI.
1. Introduction
Northern Eurasia is one of the largest terrestrial carbon reservoirs on the Earth's surface. Its response to climate change is of concern, especially in light of the vulnerability of permafrost under the ongoing global warming (Zimov et al 2006, McGuire et al 2009). Despite the importance of Northern Eurasia for the climate system and the global carbon cycle, the ground-based measurements are still limited. The top-down CO2 flux estimates in Northern Eurasia are poorly resolved (e.g. Chevallier et al 2010). To compensate the spatial limitation of the current surface greenhouse gases observation network, satellite measurement projects have been initiated. As a first greenhouse gases-dedicated satellite, the Greenhouse Gases Observing SATellite (GOSAT) was launched in January 2009 by the National Institute for Environmental Studies (NIES), the Japan Aerospace Exploration Agency (JAXA) and the Ministry of the Environment (MOE) (Kuze et al 2009). The column-averaged dry-air mole fractions of CO2 (XCO2) are retrieved from the Short-Wavelength InfraRed (SWIR) spectra obtained by onboard Thermal And Near infrared Sensor for carbon Observation-Fourier Transform Spectrometer (TANSO-FTS) (Yoshida et al 2011). GOSAT observes globally, but the coverage of GOSAT XCO2 varies seasonally mainly with solar zenith angle. In northern high latitudes, GOSAT XCO2 is available in the non-winter seasons, from late spring to early autumn. Even for the limited period, GOSAT XCO2 retrievals have a potential to improve understanding of the regional CO2 fluxes in far north regions.
Atmospheric CO2 inversion is the approach to optimize surface fluxes through minimizing the differences in atmospheric CO2 concentration between the measurements and model simulation (e.g. Enting and Newsam 1990, Enting 2002, Peylin et al 2013). It is expected in principle that the increase in atmospheric CO2 measurements (observational constraints) can help improve the CO2 flux estimates. In particular, satellite-based measurements, such as GOSAT data, hold potential because of much more availability in spatial coverage than ground-based measurements (Rayner and O'Brien 2001, Chevallier et al 2009). On the other hand, it is still necessary and challenging to evaluate how the increase of measurement coverage improves CO2 flux estimates (e.g. Gloor et al 2000, Bruhwiler et al 2011, Mabuchi et al 2016). GOSAT data have been used to estimate CO2 sources and sinks in several studies (e.g. Basu et al 2013, Maksyutov et al 2013, Saeki et al 2013, Chevallier et al 2014, Deng et al 2014). Most of these GOSAT inversion studies examined the CO2 flux distribution on a global scale and demonstrated considerable uncertainty reduction in estimated fluxes compared to the inversions with traditional ground-based measurements only. The objectives of this study are to utilise GOSAT data focusing on the regional flux estimates in Northern Eurasia, and evaluated how variations of the GOSAT-estimated fluxes are consistent with possible underlying processes. The question we investigated is how the GOSAT XCO2 can detect sub-regional CO2 flux anomalies. For this, we examined the inter-annual variations of GOSAT-estimated summertime CO2 fluxes for 2009–2011 in terms of the response of the terrestrial biosphere in Northern Eurasia to the climate anomalies on a regional scale. Guerlet et al (2013) reported lower summertime drawdown of GOSAT XCO2 in 2010 than 2009 over North America and Eurasia, and estimated 0.89 ± 0.20 GtC reduction of CO2 uptake in Eurasia possibly due to the heat wave. Compared to Guerlet et al (2013) that studied on a continental scale, this study focuses on the sub-regional scale monthly CO2 fluxes in Northern Eurasia for the three years of growing season, 2009–2011, including the year 2010 when an extremely hot summer was experienced in Northern Europe. Our study is the first attempt to evaluate the GOSAT inverted fluxes for Northern Eurasia with the environmental drivers (surface temperature and precipitation) and the independent index of terrestrial biospheric productivity, NDVI. We discuss how GOSAT XCO2 data can improve the detectability of CO2 flux signal on the response of the land–atmosphere CO2 exchange to the climate variability on a regional scale.
2. Methods
To estimate the regional CO2 fluxes for 2009–2011, we conducted the following two global inversions, using an inverse modeling system based on the Global Eulerian-Lagrangian Coupled Atmospheric Model (GELCA). The first is the joint inversion, in which GOSAT XCO2 was used from June 2009 in addition to ground-based CO2 observations. The second is the surface inversion with ground-based CO2 observations only. Both inversion calculations were started from 2001 with ground-based observational data only until the GOSAT XCO2 became available in June 2009. By starting the inversion much earlier than the period of our period of interest, we can avoid the initialization problem of the model atmospheric CO2 concentration field that may cause artifact emissions or sources. The details of GELCA inversion modeling system can be found in Shirai et al (2016) and Ishizawa et al (2016). In the following sections, we briefly describe the framework of GELCA inverse modeling, the prior CO2 fluxes, and observational data.
2.1. GELCA inverse modeling
GELCA is a coupled atmospheric model of National Institute for Environmental Studies-Transport Model (NIES-TM) version 8.1i, and FLEXPART version 8.0 (Ganshin et al 2012). FLEXPART (Stohl et al 2005) is a Lagrangian particle dispersion model, which provides the finer footprint information near the observational sites. FLEXPART releases 10 000 particles from the observation points and simulates them backward in time for 2 days. At the end points, the time-varying background CO2 concentration levels are given by NIES-TM (Belikov et al 2013) which is a Global Eulerian model with a horizontal resolution of 2.5° × 2.5°. Both FLEXPART and NIES-TM are driven by the meteorological fields from the Climate Data Assimilation System of the Japan Meteorological Agency (JCDAS) (Onogi et al 2007) with a spatial resolution of 1.25° × 1.25° and a temporal resolution of 6 h. Kalman Smoother optimization technique was employed with a fixed lag of 3 months (Bruhwiler et al 2005) to estimate monthly CO2 fluxes over 42 land and 22 ocean regions on the globe. The region mask used in this study is identical to the one for NIES-GOSAT Level 4 CO2 products (Maksyutov et al 2013). Figure 1 shows the three Northern Eurasian sub-regions of interest in this study.
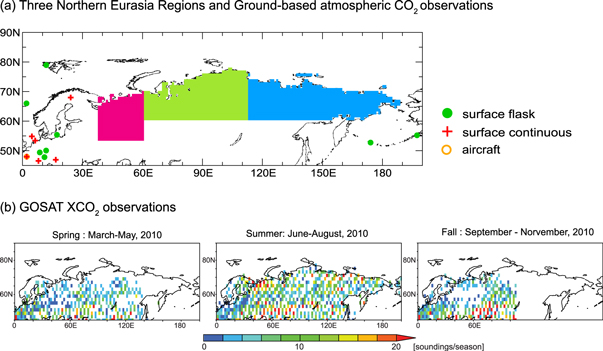
Figure 1. Three northern Eurasia regions considered in this study and locations of CO2 and XCO2 observations in our inversion. (a) three regions: Northeastern Europe (red), Western Siberia (yellow-green) and Eastern Siberia (light blue). The ground-based atmospheric CO2 observation sites are shown in different markers by sampling type or platform. All the sites are located outside of the three northern Eurasia regions. (b) Locations of XCO2 observed by GOSAT are shown here by the number of sounding over 2° × 2° grid in spring, summer and fall in 2010. In winter, no GOSAT data cover the above three Northern Eurasia regions.
Download figure:
Standard image High-resolution image2.2. Prior fluxes
The prior CO2 fluxes used to predict CO2 concentrations consist of four components: 1) fossil fuel emission inventory of the Open source Data Inventory of Anthropogenic CO2 (ODIAC) (Oda and Maksyutov 2011), 2) net ecosystem CO2 exchange from a process-based terrestrial biosphere model, the Vegetation Integrative Simulator for Trace gases (VISIT) (Ito 2010, Saito et al 2014), 3) the ocean-atmosphere CO2 exchange from the Offline ocean Tracer Transport Model (OTTM) (Valsala and Maksyutov 2010), and 4) the biomass burning CO2 emission of Global Fire Emission Database (GFED) version 3.1 (van der Werf et al 2010). VISIT terrestrial biospheric fluxes are at a daily time step; other fluxes are in monthly temporal resolution. All of them are on 1.0° × 1.0° grid.
2.3. Observations
2.3.1. GOSAT XCO2
We used NIES GOSAT SWIR Level 2 XCO2 (version 02.11). NIES GOSAT project team has been retrieving the XCO2 with 'full physics approach', by which the optical path length modification due to aerosol scattering is connected with several aerosol parameters in the forward model. XCO2 retrievals are subject to aerosol parameter and other settings in the retrieval algorithm, and suffer from systematic biases. Comparisons of GOSAT XCO2 with the ground-based XCO2 at 13 sites of Total Carbon Column Observing Network (TCCON) revealed that the NIES GOSAT XCO2 has a negative bias of 1.48 ppm with a standard deviation of 2.09 ppm (Yoshida et al 2013). To minimize the systematic error in GOSAT XCO2, we corrected possible biases of GOSAT XCO2, using a multiple linear regression to the same version of GOSAT XCO2 (v02.11) and simultaneously retrieved auxiliary parameters (aerosol optical depth, surface pressure, surface albedo, airmass) against TCCON XCO2 retrievals (Inoue et al 2016). The GOSAT soundings over lands are observed in high and medium modes. Over oceans, sun-glint mode is used due to the low reflectance of ocean surface except for sun-glint direction. These three modes exhibit different characteristics of their retrieval biases. Since land XCO2 in the medium gain (which is used over bright desert surfaces) have not been enough validated by TCCON XCO2, we used high gain XCO2 for lands and ocean sun-glint XCO2 after being bias-corrected. In the inverse modelling, the data uncertainty of 2.31 ppm is assigned uniformly based on the global mean standard deviation (SD) of the difference between TCCON XCO2 and its co-located single shot GOSAT-XCO2, and the mean SD of XCO2 at TCCON stations (station bias) (Yoshida et al 2013). The temporal coverage of GOSAT measurements are shown in figure 1. Summer is the season most covered by GOSAT, while there is no GOSAT observation available in winter.
2.3.2. Ground-based CO2 observations
We used the Observation Package (ObsPack) data product v.1.0.3 (available at www.esrl.noaa.gov/gmd/ccgg/obspack) (Masarie et al 2014) provided by the National Oceanic and Atmospheric Administration (NOAA) the Earth System Research Laboratory (ESRL), as ground-based atmospheric CO2 concentrations. The ObsPack product consists of surface data obtained by a number of institutes and agencies as well as NOAA/ESRL global network. Figure 1 shows the locations of ground-based CO2 measurement sites around Northern Eurasia that we used in this study. It is noted that there is no measurement site within the regions of interest in this study. The data uncertainties for the inverse modelling are assigned individually to the measurement sites based on the mean residual standard deviations from smooth curves, provided by GLOBALVIEW-CO2 (2011). The minimum uncertainty is set to 0.25 ppm followed by Gurney et al (2004).
3. Meteorological parameters and NDVI
In this study, we examine the correlations of estimated CO2 fluxes with three meteorological parameters (surface temperature, shortwave radiation, precipitation) and the Normalized Difference Vegetation Index (NDVI). These meteorological parameters are important factors in controlling the terrestrial biosphere processes, and then to impact the CO2 exchange between the land and atmosphere (e.g. Mabuchi 2013)). NDVI is calculated from the visible and near-infrared lights reflected by vegetation. NDVI is closely linked with green cover, vegetation primary production, and phenology (Tucker 1979, Myneni et al 1995). A high value of NDVI indicates healthy or dense vegetation with high photosynthetic activity while a low value of NDVI indicates unhealthy or sparse vegetation with low photosynthetic activity. Since NDVI provides a measure of the condition and dynamics of vegetation in the lands, it could help evaluate the estimated CO2 fluxes.
Surface temperature data used in this study are obtained from the JCDAS data set that is also used as a driving parameter for GELCA. We used daytime mean shortwave radiation and NDVI which are processed by JAXA from the spectral radiances obtained by the MODerate resolution Imaging Spectroradiometer (MODIS) on the NASA Earth Observing System satellites, Terra and Aqua (Saigusa et al 2010) (data available at http://kuroshio.eorc.jaxa.jp/JASMES/). The precipitation data are from the Climate Prediction Center Merged Analysis of Precipitation (CMAP) (Xie and Arkin 1997). The CMAP is global monthly analyses of precipitation which is produced by merging the ground-based observations from rain gauges and several satellite-based estimates. To highlight the relationship between inter-annual variations of estimated monthly surface CO2 fluxes and climate anomalies, we obtained the monthly anomalies of above parameters, subtracting the respective means for 2009–2011 that is the period of the interest in this study.
4. Results and discussion
4.1. Temporal variations of estimated CO2 fluxes
The time-series of estimated CO2 fluxes in the three regions of Northern Eurasia are shown in figure 2. Differences of estimated CO2 fluxes between the surface inversion and the joint inversion are seen in the summer months, showing the GOSAT XCO2 data mainly impact in summer months in the northern high latitudes.
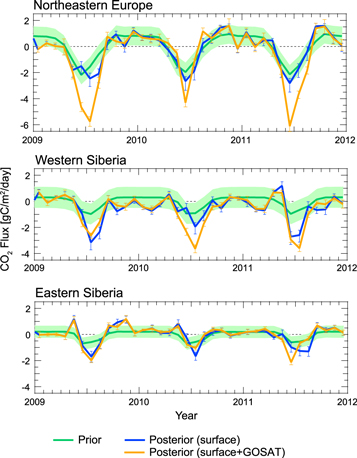
Figure 2. Monthly CO2 flux estimates in the three regions of figure 1. Surface and joint inversion results are in blue and orange lines, respectively. Prior fluxes are shown in green curves with uncertainty of green-shaded. A negative flux is a flux from the atmosphere to the terrestrial biosphere.
Download figure:
Standard image High-resolution imageBesides larger summertime CO2 uptake by joint inversion rather than surface inversion, in Northeastern Europe, it is noticeable that the summer 2010 uptake by joint inversion was quite reduced compared with 2009 and 2011. Similar reduction of summer 2010 uptake is also seen in Eastern Siberia, but not in Western Siberia. In Western Siberia, on the contrary, the joint inversion infers larger CO2 uptake in 2010 than 2009. Furthermore, the joint inversion in 2010 infers much larger CO2 uptake than the surface inversion though both inversion results are comparable in 2009 and 2011. This year-to-year change in the estimated CO2 flux for Western Siberia is opposite to the results for Northeastern Europe and Eastern Siberia.
In this study, we focus on the anomalies of estimated CO2 fluxes. Since the systematic retrieval biases of XCO2 significantly affect the flux estimates, it is challenging to estimate the absolute value of the regional-scale CO2 fluxes. The satellite-based inversion tends to infer larger summertime net CO2 uptake in Northeastern Europe than surface inversion (e.g., (Chevallier et al 2014, Reuter et al 2014, Houweling et al 2015)). Though the magnitude of CO2 fluxes has not been solved fully yet, the relative variations of CO2 fluxes in time and space appear to be robust.
4.2. Correlations of estimated CO2 fluxes with climate and NDVI anomalies
Before examining the correlation between estimated CO2 fluxes and climate, and NDVI, we look at the spatial patterns of the inter-annual and intra-annual variations in the climate and NDVI anomalies in the summer seasons for 2009 to 2011.
Figure 3 shows the summertime mean (June–August) anomalies of surface temperature as a deviation of the mean temperature of 2009–2011. In 2010, it is noticeable that the temperature anomalies are positive in East Northeastern Europe and Siberia while negative in West Western Siberia. The anomaly patterns of 2009 and 2010 are overall opposite to each other. The 2011 anomaly varies spatially but appears to be relatively moderate as a whole, compared to the preceding two years.

Figure 3. Summertime (June–August) averaged surface air temperature anomaly from the JCDAS dataset. The anomalies are calculated as the deviation from three-year monthly mean for 2009–2011. The boundaries for the three Northern Eurasia regions are indicated in dotted lines.
Download figure:
Standard image High-resolution imageMonthly anomalies of surface temperature, shortwave radiation, precipitation and NDVI in the summer of 2010 are shown in figure 4. In July, Northeastern Europe and Eastern Siberia show highly positive surface temperature anomalies. This anomaly pattern is persistent in August and appears in the summertime mean pattern as seen in figure 3. In Western Siberia, the temperature anomaly remains negative in the entire summer of 2010. The spatial patterns of shortwave radiation are relatively similar to temperature as they are highly correlated by (r = 0.83). Precipitation anomaly patterns are fundamentally opposite to temperature (r = −0.45) and shortwave radiation (r = −0.76) due to the effects of cloud and soil moisture. The climate anomaly impacts on terrestrial vegetation activities, resulting in an NDVI anomaly. NDVI does not necessarily change spontaneously with climate as there is a time lag for the vegetation to respond to the climate change. It is thus important to see the temporal evolution of NDVI with climate change. The NDVI anomaly in Western Siberia is negative in June and becomes gradually positive from July to August. On the other hand, the NDVI anomaly in Northeastern Europe remains negative in the whole summer and its magnitude gradually increases from June through to August. The NDVI anomaly in Eastern Siberia is positive in June and becomes gradually negative from July to August. It indicates that the hot and dry conditions in the summer of 2010 suppress the vegetation activities in Northeastern Europe and Eastern Siberia. On the contrary, the cool and wet conditions in Western Siberia keep the vegetation green and photosynthetically active in August.
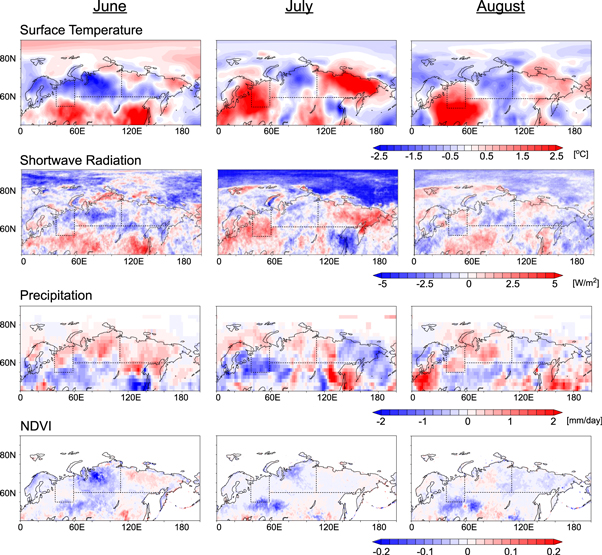
Figure 4. Monthly anomalies of surface temperature, shortwave radiation, precipitation and NDVI over Northern Eurasia for the year of 2010. The respective anomalies are calculated as their deviations from the 2009–2011 averaged monthly means. The boundaries for the three Northern Eurasia regions are indicated in dotted lines.
Download figure:
Standard image High-resolution imageFigure 5 shows the correlations of CO2 flux anomalies of both joint and surface inversions with the anomalies of surface temperature, shortwave radiation, and NDVI. The net CO2 flux is a balance between the downward flux (negative) by photosynthetic activity and upward fluxes (positive) through ecosystem respiration. The positive net CO2 flux means the respiration exceeds the photosynthesis. During the summer months, June to August, the estimated CO2 fluxes are negative in all the three Northern Eurasian regions (as seen in figure 2), that is, these land regions exert net CO2 uptake. Then the negative CO2 flux anomalies indicate the increase of net CO2 uptake by land ecosystems. In contrast, the positive CO2 flux anomalies indicate the reduction of net CO2 uptake. Overall, the CO2 flux anomalies of both inversions are reasonably correlated with the anomalies of surface temperature, shortwave radiation, and NDVI. In the following sections, we examine the details.
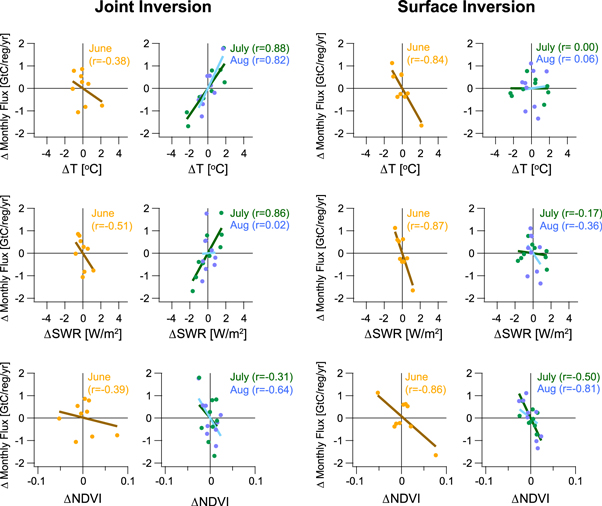
Figure 5. Monthly correlations between estimated CO2 flux anomalies and the anomalies of surface temperature (top), shortwave radiation (middle) and NDVI (bottom), for June–August, 2009–2011. The anomalies of estimated CO2 fluxes are from joint inversion (left) and surface inversion (right). Solid lines refer to the linear regression lines for June (orange), July (green), August (light blue), and the respective correlation coefficients (r) are shown in the plots. Individual regional anomalies are deviations from the respective regional monthly means for the same three years of 2009–2011. Correlations between anomalies were calculated over all three northern Eurasia regions together.
Download figure:
Standard image High-resolution image4.2.1. Surface temperature
In June, both surface and joint inversion show a negative correlation. In July and August, joint inversion shows that strong positive correlations between temperature and CO2 flux anomalies of 0.88 and 0.82, respectively, although no correlation is found in the surface inversion. In general, for the terrestrial ecosystems in the northern high latitudes, warmer weather in spring and early summer stimulates photosynthetic activities and the growth of vegetation, resulting in an increase of net CO2 uptake by the terrestrial biosphere. In the middle and late summer, hotter weather conditions increase soil respiration, leading to an increase in CO2 release from the land surface to the atmosphere. As a result, the net CO2 uptake is reduced. This mechanism accounts for the change of the correlation between CO2 flux anomalies of joint inversion and temperature anomalies, from negative correlation in June to positive correlation in July and August. Furthermore, the better correlations of CO2 flux anomalies of joint inversion indicate that GOSAT XCO2 reflects well the land–atmosphere CO2 exchange varying with surface temperature.
In the summer of 2010, a large part of Eurasia experienced an extremely hot and dry summer, though in Western Siberia the temperature anomalies were negative (cold) and the precipitation anomalies were positive (wet) over the summer months (see figures 3 and 4). The joint inversion shows reduced net CO2 uptake in Northeastern Europe and Eastern Siberia (shown in figure 2), but enhanced net CO2 uptake in Western Siberia. This regional difference in flux anomalies is consistent with the temperature dependency of net CO2 flux anomaly discussed above, given the spatial variations of temperature anomalies in the summer of 2010. Cooler weather conditions in Western Siberia caused the negative CO2 flux anomalies while Northeastern Europe and Eastern Siberia, which experienced the extreme hotter summer, yielded positive CO2 flux anomalies.
From the difference of GOSAT XCO2 data between 2009 and 2010, Guerlet et al (2013) estimated the 2010 summertime reduction of CO2 uptake over Eurasia as a whole and attributed the CO2 uptake reduction to the extremely hot weather conditions around Northern Europe. However, the extreme climate anomaly in July and August 2010 did not happen uniformaly over the entire Eurasia continent; the climate anomalies are spatially different on a sub-regional scale as seen in figure 4. Our GOSAT-inferred fluxes corresponded to such sub-regional scale differences in temperature anomalies (figure 2). The correlation analysis endorses the relationship between the surface temperature and net CO2 fluxes in the joint inversion.
4.2.2. Shortwave radiation
As for the joint inversion, the correlations of CO2 flux anomalies with shortwave radiation anomalies in June and July are similar to the correlations with temperature anomalies, though there is no correlation in August. On the other hand, the surface inversion shows small but negative correlation in August, indicating the increase of net CO2 uptake with shortwave radiation.
Shortwave radiation has effects to the terrestrial biosphere directly and indirectly. As a control factor of photosynthesis, shortwave radiation enhances the photosynthetic activity and then increases carbon CO2 uptake. In addition, as the major driver to increase the surface temperature, shortwave radiation impacts on biospheric processes through the surface temperature. Moreover, shortwave radiation increases transpiration which reduces soil moisture, but also moderates surface temperature increase.
The negative correlations for June in both joint and surface inversions might be results of both direct and indirect effects of shortwave radiation on the terrestrial processes, that is, the enhancement of photosynthetic activity by shortwave radiation, and also the favorably warm weather conditions for plant growth through the increase of surface temperature as seen in section 4.2.1.
The joint inversion shows a positive correlation with shortwave radiation in July. This positive correlation can be explained by the indirect effect of shortwave radiation. The shortwave radiation increases surface temperature, and results in the increase of ecosystem respiration as seen in section 4.2.1. On the other hand, no correlation is seen for August in the joint inversion. The relationship between CO2 flux and shortwave radiation through the indirect effect (change in surface temperature) is influenced by soil moisture. Surface temperature is not always proportional to shortwave radiation. Plenty of soil moisture would hamper the rise of surface temperature as shortwave radiation energy is more partitioned into latent heat to evaporate soil water than sensible heat. Thus, the interaction with shortwave radiation and soil moisture may complicate the correlation between shortwave radiation anomalies and CO2 flux anomalies for joint inversion in August. The soil moisture is considered to be mainly controlled by precipitation with a time-lag. We examine the impact of precipitation anomalies on CO2 fluxes later in section 4.2.4.
4.2.3. NDVI
During the summer months, the CO2 flux anomalies of both joint and surface inversion show negative correlations with NDVI anomalies. These results are consistent with the fact that positive NDVI anomalies indicate healthier vegetation, which is capable of taking up more CO2 from the atmosphere through photosynthesis, potentially leading to negative net CO2 flux anomalies. The CO2 fluxes from surface inversion appear to be correlated more strongly with NDVI anomalies than those from joint inversion. This stronger negative correlation of surface inversion is consistent with the negative correlation with shortwave radiation for the entire summer as discussed in the previous section. A positive shortwave anomaly could increase the photosynthesis response, and result in a positive NDVI anomaly. From two decadal NDVIs and climate data analysis, Nemani et al (2003) indicated that solar radiation is limiting factor of carbon net anomaly in the northern vegetation. On the other hand, the weaker negative correlation between NDVI and joint inversion might indicate the complex response of terrestrial biosphere to climate anomalies. NDVI is a proxy of biospheric productivity but is not necessary to increase linearly net CO2 uptake. In the next section, we examine further the relationship between CO2 flux and NDVI anomaly regarding the relationship with precipitation and the biospheric processes.
4.2.4. Precipitation
The same month anomalies between precipitation and CO2 fluxes show no clear correlation (not shown), except the negative correlation between joint inversion and precipitation anomalies for July (r = −0.78). Among the same month anomalies of meteorological parameters and NDVI, precipitation appears not to be correlated with NDVI, while precipitation has weak negative correlations with shortwave radiation and surface temperature, except high correlation with surface temperature in July (r = −0.71).
It is considered that the precipitation controls the soil water. Through the soil water/soil moisture, the precipitation anomaly impacts on biospheric processes, and then on land–atmosphere CO2 exchanges. This interaction is not necessarily spontaneous, but relativity slow. Therefore, we examined the precipitation anomalies with a time delay. The positive correlations were found between the precipitation anomalies in early spring and the NDVI anomalies for the early growing season with one to three-month lag (not shown). Among them, the precipitation anomalies in July show high correlations with the anomalies of surface temperature and NDVI in August. Figure 6 shows the precipitation anomalies in July correlated negatively with surface temperature anomalies in August (r = −0.76) and positively with the NDVI anomalies in August (r = 0.56). The negative correlation between the one-month delayed precipitation anomaly and temperature anomaly are consistent with the temperature rise by shortwave radiation being suppressed by soil moisture.
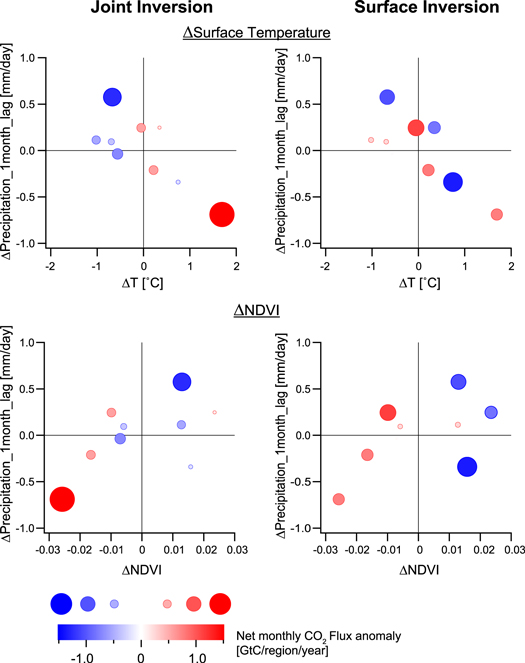
Figure 6. Correlations between surface temperature anomaly in August and precipitation anomaly in July (top), and between NDVI anomaly in August and precipitation anomaly in July (bottom), for 2009–2011. The color and size of the closed circles denote the corresponding monthly CO2 flux anomalies in August.
Download figure:
Standard image High-resolution imageIn figure 6, the CO2 flux anomalies in August are plotted on the top of the correlation plots between the precipitation anomalies in July and the surface temperature anomalies/NDVI anomalies in August. As seen in figure 6, one-month lagged precipitation anomalies are highly correlated with surface temperature negatively (r = −0.76) and NDVI positively (r = 0.56), though those same month correlations are relatively weak for surface temperature (r = −0.45) and no correlation is found with NDVI as mentioned earlier. The CO2 anomaly values are drawn by color and size of the closed circles. The results indicate that the CO2 flux anomalies from joint inversion are more clearly related to one-month delayed precipitation anomalies and same month anomalies of surface temperature and NDVI. These relationships can be summarised as follows:
- Negative CO2 flux anomalies with lower temperature and more previous-month precipitation (a cooler condition with wet soil).
- Positive CO2 flux anomalies with higher temperature and less previous-month precipitation (a hotter condition with dry soil).
- Negative CO2 flux anomalies with higher NDVI and more previous-month precipitation (healthy vegetation with wet soil condition).
- Positive CO2 flux anomalies with lower NDVI and less previous-month precipitation (unhealthy vegetation with dry soil condition).
The above relationships indicate that the precipitation in July is key for the land–atmosphere CO2 exchange in August; the precipitation of July supplies soil moisture and then support the photosynthetic process also affects the soil respiration by controlling the surface temperature (surface condition) through energy exchange between land and atmosphere. This combined effect of climate and NDVI on the net CO2 uptake is consistent with previous studies on the warming effect of northern vegetation (e.g. Barber et al 2000, Angert et al 2005, Ma et al 2012).
Recent studies on the terrestrial biosphere response in the northern hemisphere to climate change conclude the vegetation greening and increasing carbon uptake in the spring in northern latitudes. These studies range from field flux measurements, ecosystem models to satellite measurement analysis. However, the summertime response of the northern vegetation to the summer temperature increase remains uncertain (Angert et al 2005, Buermann et al 2013, Yi et al 2014). Several studies reported the declining trend of summer productivity over boreal ecosystems (Barber et al 2000, Angert et al 2005, Ma et al 2012) and over arctic ecosystems (Sharp et al 2013).
Buermann et al (2013) reported that earlier spring increases the productivity in North American boreal forests, but also associates drying in the midst of the growing season which decreases summer productivity. Our study is on inter-annual variability for the three summer seasons of 2009–2011, while Buermann et al (2013) studied the longer-term climate change impact on boreal forests for nearly three decades (1982–2008). For a long-term period, early spring onset due to global warming trend could result in summer soil moisture and then forest productivity in growing seasons (e.g. Barnett et al 2005). On the other hand, this study examined the recent three years, indicating that precipitation in July, immediate past month, impacts the net carbon flux in August. Even the different time span, our finding is consistent with Buermann et al (2013) that soil moisture is the key to summertime productivity in boreal forests. On an inter-annual scale, earlier spring onset might not necessarily follow drying of soil moisture. If precipitation in early summer is normal or more than normal, sufficient soil moisture will keep the terrestrial vegetation from drying during the mid-summer so that vegetation productivity could remain or increase. This is the mechanism suggested from joint inversion.
It is interesting to note that the relationship between one-month lagged precipitation anomalies and NDVI reveals a better correlation with the CO2 flux anomalies from joint inversion than surface inversion, though NDVI alone has a stronger negative correlation with CO2 fluxes in surface inversion than joint inversion (figure 5). Although NDVI is an indicator of photosynthetic productivity, it is not necessary to be proportional to the net CO2 flux which is a photosynthetic CO2 uptake minus respiratory CO2 release. Positive precipitation anomalies alleviate the water stress of stomata and enhance the photosynthesis (positive NDVI anomaly), leading to the increase of net CO2 uptake (negative CO2 flux anomaly). Vice versa is for negative precipitation anomalies. It is interesting that the multiple climate anomalies relationship tells a more comprehensive view on the atmosphere–biosphere CO2 exchange than with single climate variables.
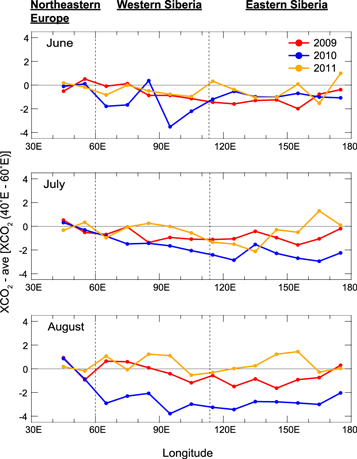
4.3. Longitudinal distribution of XCO2 over northern hemisphere
Figure 7 shows the longitudinal distribution of monthly mean XCO2 north of 60°N with respect to averaged XCO2 over 40°E–60°E longitude band. The longitude band of 40°E–60°E corresponds to the East Northeastern Europe, and the 60°E–113°E band is to Western Siberia, and the band east of 113°E is to Eastern Siberia, in the present study.
Figure 7. Monthly GOSAT XCO2 longitudinal distributions with respect to monthly mean XCO2 over 40°E–60°E over Northeastern Europe region in this study, for June to August 2009–2011. GOSAT XCO2 are averaged monthly by a 10° longitude band.
Download figure:
Standard image High-resolution image
Given the fact that the mean wind is westerly, the relative distribution of XCO2 reflects the evolution of XCO2 through CO2 exchange between the atmosphere and surface along the longitudes. Except 2010, the XCO2 longitudinal distributions appear to be gradually declining westward or steady as a whole. Such a longitudinal profile is accounted for by weak net CO2 uptake or almost balanced CO2 exchange along the longitude. In the summer of 2010, the strong declining trend of XCO2 from 60°E to 110°E is seen, but XCO2 is almost steady east of 110°E. This regionally limited declining of XCO2 trend indicates stronger CO2 uptake around Western Siberia. Therefore, by constraining the GOSAT XCO2, joint inversion infers the enhanced net CO2 uptake in Western Siberia compared in Northeastern Europe and Eastern Siberia. This analysis demonstrates that GOSAT XCO2 reflects the varying atmosphere-terrestrial biosphere CO2 exchange on a regional scale.
5. Conclusions
In this study, we examined the inter-annual variability of CO2 fluxes inferd from GOSAT for three consecutive growing seasons from 2009–2011 in Northern Eurasia (north of ∼60°N). The results show the anomalies of CO2 fluxes from joint inversion with GOSAT XCO2 and surface CO2 observations are overall better correlated than surface inversion, with the anomalies of surface temperature, and shortwave radiation. In particular, the estimated CO2 fluxes by joint inversion show strong correlations with surface temperature in July and August, while no correlation is found with estimated CO2 fluxes by surface inversion. In 2010, a large part of Eurasia experienced an extremely hot and dry summer though Western Siberia was in cool and wet weather conditions. The estimated CO2 fluxes with GOSAT XCO2 show reduced net CO2 uptake in Northeastern Europe and Eastern Siberia but enhanced net CO2 uptake in Western Siberia. The opposite weather anomalies among Northern Eurasia can explain these opposite anomalies of estimated regional CO2 fluxes. Thus, we conclude that GOSAT XCO2 compensates for the lack of observational coverage by ground-based measurements so as to better capture the varying atmosphere-terrestrial biosphere CO2 exchange on a regional scale.
The fluxes inferred from GOSAT XCO2 exhibit a reasonable relationship with precipitation through surface temperature and NDVI anomalies when the one-month time lag of precipitation anomalies to CO2 flux anomalies is considered. The time lag is accounted for by the processes that the precipitation impacts on surface temperature and NDVI through soil moisture. These results indicate that GOSAT XCO2 reflects the combined changes in terrestrial biospheric processes responding to the climate anomalies. In contrast, the anomaly of NDVI alone apparently shows stronger correlation with the fluxes from surface inversion than those from joint inversion. The joint inversion results are more consistent with previous studies claiming the important role of soil moisture under warming climate change on summer productivity over boreal forests. (e.g. Barber et al 2000, Angert et al 2005, Ma et al 2012). The analysis in this study suggests that the inversion performance needs to be evaluated from multiple aspects of climate anomalies, given the complexity in the terrestrial biosphere in time-lagged processes.
Acknowledgments
We would like to thank all colleagues involved the GOSAT project, but in particular, the following people who contributed the developments of atmospheric models and prior flux models: R Zhuravlev, A Ganshin, D Belikov, M Saito, T Oda, and V Valsala. We greatly acknowledge the atmospheric CO2 data providers of the ObsPack product (obspack_ co2_PROTOTYPE_v1.0.3_2013_01-29) that used for the inversion: P Steele, P Krummel, M van der Schoot, L Gatti, A Martinewski, D Worthy, J Hatakka, T Aalto, M Ramonet, M Delmotte, M Schmidt, P Ciais J A Morgui, N Mihalopoulos, F Gheusi, G Bentz, I Levin. S Hammer, L Haszpra, A Takizawa, T Machida, H Matsueda, Y Sawa, S Morimoto, T Nakazawa, S Aoki, H Meijer, E Brunke, E Scheel and C Labushagne, R Ramos, M Leuenberger, S Wofsy, S Biraud. M Torn, K Masarie, A Andrews, E Dlugokencky, C Sweeney, P Tan, K Thoning, B Stephens, R Keeling, A J Gomez-Paleaz, and R Langenfelds. The JCDAS is provided from the Japanese 25-year Reanalysis (JRA-25), a cooperative research project carried out by the Japan Meteorological Agency (JMA) and the Central Research Institute of Electric Power Industry (CRIEPI). The Japanese NDVI and shortwave radiation products are developed by JAXA, using the MODIS and SeaWiFS Level-1 data are provided by NASA GSFC. The authors thank four anonymous reviewers for interesting feedback and helpful comments to improve the manuscript.