

Abstract
We present a model comparison study that combines multiple integrated assessment models with a reduced-form global air quality model to assess the potential co-benefits of global climate mitigation policies in relation to the World Health Organization (WHO) goals on air quality and health. We include in our assessment, a range of alternative assumptions on the implementation of current and planned pollution control policies. The resulting air pollution emission ranges significantly extend those in the Representative Concentration Pathways. Climate mitigation policies complement current efforts on air pollution control through technology and fuel transformations in the energy system. A combination of stringent policies on air pollution control and climate change mitigation results in 40% of the global population exposed to PM levels below the WHO air quality guideline; with the largest improvements estimated for India, China, and Middle East. Our results stress the importance of integrated multisector policy approaches to achieve the Sustainable Development Goals.
Export citation and abstract BibTeX RIS

Original content from this work may be used under the terms of the Creative Commons Attribution 3.0 licence. Any further distribution of this work must maintain attribution to the author(s) and the title of the work, journal citation and DOI.
Introduction
The recent Sustainable Development Goals (SDGs) provide a possible policy platform for linking action on air pollution and climate change. Effective action on the SDGs will require that the connections between the goals and targets be better understood and the local vs global scale synergies and trade-offs evaluated [1]. Here, we present the first multi-model study on the co-benefits of climate policies for regional air quality. Our goal is to provide critical information to the ongoing policy debate on aligning global and national actions to achieve key SDGs related to air pollution and climate change.
Integrated assessment models (IAMs) project economic growth, population, energy consumption, land-use and agriculture along with associated GHG and pollutant emissions. Scenarios developed using IAMs reflect plausible future pollutant emissions based on socioeconomic, environmental, and technological trends. The Representative Concentration Pathways (RCPs) [2], were the first set of long-term global air pollution scenarios developed across multiple IAMs. These scenarios were primarily developed for use by climate modelers and are based on a set of long-term radiative forcing targets. They reflect assumptions on the successful implementation of emissions controls in the next few decades and as a result show significant declines in particulate matter (PM) and ozone precursor emissions over the 21st century [3, 4]. Recent studies have pointed to the importance of a systematic assessment of future air quality across a wide range of uncertainties related to the enforcement of pollution control and alternative policies and developments in the underlying energy systems [5, 6].
Standard model inter-comparison projects (MIPs) in which, IAMs implement a common study protocol, and highlight conclusions that are robust to different models' specifications, have been used to gain a better understanding of future structural transformations related to long-term climate change . Here, we use a set of global climate policy scenarios from a recently concluded MIP [7] to assess the co-benefits of climate policies across a set of IAMs for varying levels of implementation of air pollution control. We present results in terms of emissions of a number of air pollutants for key sectors across 10 global regions. We also calculate regional concentrations of fine particulate matter (PM2.5) using a reduced-form global air quality source-receptor model (AQ-SRM) and assess them in relation to the World Health Organization (WHO) air quality guidelines [8].
Through this effort, we respond to the need for comprehensive modeling that accounts for multiple uncertainties to increase the policy relevance of the co-benefits of climate policies [9] and extend a number of studies [10, 11] in this regard. The methods and insights developed here, are expected to inform scenario development processes in the Shared Socio Economic Pathways (SSPs), which are part of a new framework that the climate change research community has adopted to facilitate the integrated analysis of future climate impacts, vulnerabilities, adaptation, and mitigation [12].
Data and methods
Six IAMs participated in this study. The models differ in their economic, technological and sectoral representation and in the way they are solved, with some models maximizing an intertemporal objective function (such as economic activity) and others simulating a set of equilibria. Moreover, the models differ in their representation of GHG emissions and their sources, energy demand and supply sectors, population and GDP baselines, and assumptions about techno-economic parameters.
All models implemented a common set of scenarios. These include:
- REF: counterfactual baseline development without climate policy against which climate policy scenarios are evaluated. This includes assumptions on median GDP and population projections and does not explicitly include any climate policies.
- MIT: climate policy scenario that includes emissions reduction targets for the year 2020 as laid down in the Copenhagen pledges with inclusion of some plausibility considerations of the pledges; and a long-term 450 ppm carbon-di-oxide equivalent (CO2e) concentration target.
For this study, all models represented a number of air pollutants over the 2000–2100 period. Emissions for the base year (2000) were based on a common historical emissions inventory [13]. For the 2000–2030 period, we sourced data on pollution control across multiple regions and sources from the Greenhouse Gas and Air Pollution Interactions and Synergies (GAINS) model [14–16]. Pollution abatement as defined here specifically included end-of-pipe controls removing pollutants without affecting the emission-producing activity itself. We aggregated data by source from the GAINS model for all energy-related combustion (supply and demand), conversion, and transformation sectors, and applied them in the respective IAMs using emission factors (emissions per unit energy). This approach allows for a relatively simplistic method to represent quantitatively, concepts related to the speed and degree of implementation of pollution control [17].
In order to reflect uncertainty related to future pollution control, we developed three air pollution policy variants across the REF and MIT scenarios:
- FLE: 'fixed legislation'; no further emission controls beyond those in place in 2010.
- CLE: 'current legislation'; full and timely implementation of all existing and planned air pollution legislation until 2030; full implementation of the best available emission control technologies as exists today by 2100 (independent of their costs but considering economic lifetime of technologies and selected other constraints that could limit applicability of certain measures in specific regions).
- SLE: 'stringent legislation'; rapid pollution control with 75% full implementation of the best available emission control technologies by 2030 and full implementation by 2050.
The emission outcomes from all IAMs were further linked to the TM5-FASST model, a global AQ-SRM [18, 19]. The TM5-FASST model calculates 1° × 1° resolution grid maps of PM2.5 surface concentrations taking as input annual emission rates of pollutants for 56 regions. For population exposure calculations, the resulting PM.5 grid maps were interpolated to 7.5' × 7.5' to match high resolution population grid maps [20].
Figure 1 shows the systems and scenario framework for this study. Further information on model types, scenario descriptions, sector definitions, and air quality modeling is available in the supplementary information (SI).

Figure 1. Description of modeling and scenario framework.
Download figure:
Standard image High-resolution imageResults
A complete description of the energy and GHG transitions underlying the scenarios used in this study are available in [7, 21]. Key results with regards to the achievement of stringent climate targets that have been highlighted include the importance of fossil fuel combustion for achieving stringent climate mitigation targets; and the need for the phase out of global greenhouse gas (GHG) emissions by 2100. SI figure 1 further summarizes the development of primary energy in the REF and MIT scenarios.
In figure 2, we now review emissions of sulfur dioxide (SO2), nitrogen oxide (NOX) and black carbon (BC) in the REF and MIT scenarios for the CLE, SLE and FLE pollution policy variants. We focus here on the implications of changes in energy supply and demand sectors. See SI figure 7-2 for similar results on remaining pollutants.
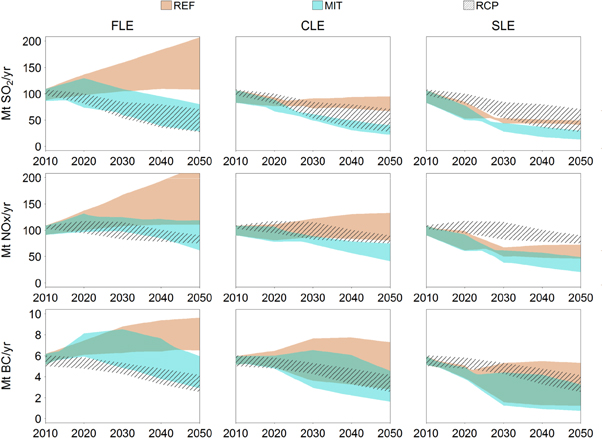
Figure 2. Global emission ranges for REF and MIT scenarios across IAMs for selected air pollutants (SO2, NOX and BC) from energy supply and demand activities until 2050 in FLE, CLE and SLE air pollution control variants respectively. Shaded area shows the range of emission outcomes from similar sectors in the RCP scenario set.
Download figure:
Standard image High-resolution imageThe first important robust conclusion we make is regarding the comparison to the RCP scenarios in terms of air pollutant emisison ranges. While the scenarios used in this study span a similar range of long-term radiative forcing as the RCP set, assumptions on alternate developments in the energy system and the enforcement of pollution control; result in a wider range of emission outcomes as compared to RCP. These results are important in qualifying the uncertainty related to future air pollution development, particularly in a long-term scenario context.
Climate policies lead to significant reductions in near-term emissions of air pollutants, while simultaneously resulting in large declines in GHG emissions (see SI figure 7-3 for a comparison of reductions in pollutants and GHG emissions in the MIT scenario). The technological transitions entailed by climate policies are effective in controlling for the increases in pollutant emissions in the REF scenario, even with full implementation of current and planned air pollution controls (CLE). With lax implementation of direct pollution control (FLE), climate policies are seen to lead to larger reductions in air pollutants while with more stringent implementation of direct controls (SLE), reductions are more limited. The largest reductions in air pollutant emissions in 2030 occur in the MIT SLE scenario. Thus, comprehensive policies that include multiple approaches to air pollution control could be most effective in delivering maximum reductions in air pollution in the near-term.
We note that assumptions on the technological limits of direct emission controls are an important factor in terms of the ability of climate policies to afford further reductions in air pollutants. Thus, we may possibly over-estimate co-benefits for the pathways and regions with high penetration of advanced pollution control technologies. On the other hand, given the current low rates of application of these technologies, technological progress in the scenarios can be expected to mature their use over the longer-term.
Even with similar assumptions on the levels of direct pollution control, there is a wide spread across scenario realizations, in terms of the extent of the co-benefits from climate policies. The differences reflect choices of modelers on the technological development and alternative policies in the reference scenarios; as well as the timing and extent of mitigation technologies in the MIT scenarios. A more extensive analysis of these differences is important for the appropriate placing of the co-benefits argument in a policy context.
A closer look at the distribution of reductions in air pollutants across sectors is indicated in figure 3. It is important to note that that though we use consistent definitions of sectors in this study, the aggregate nature of the IAMs means that the results also depend on the assumed level of technological detail in a particular model. While we focus here on the energy supply and demand sectors, SI figure 7.4 indicates clearly that assumptions on land-use and other sectors could imply additional differences across the range of model realizations of the respective scenarios.
We find that current and planned air pollution controls have uneven impacts across different sectors and pollutants in the REF CLE scenario. For SO2 emissions, adequate pollution controls in the electricity generation sector and the penetration of advanced coal facilities implies that emissions decline significantly in most models in this sector. However, relatively poor controls in other sectors like industry and a growing use of fossil fuels could result in an increase in emissions. For NOX emissions, the differences across models in the medium term are larger due to a number of factors including, a lag in controls in the industrial sector in many countries; the high pollutant intensity in processes such as steel and cement; and the increasing use of liquid fuels in the transportation sector. Fossil based liquids comprise on average 92% of total transportation final energy in 2050 in all scenarios here, with assumptions on the relative costs of fuel substitution and infrastructure development being a common constraint. For BC emissions, assumptions on biomass use in developing countries is seen to have a major impact on the reductions from current air quality controls. With the continued use of solid fuels for cooking and in small industries, BC emissions are seen to increase significantly in the short-term in these sectors.
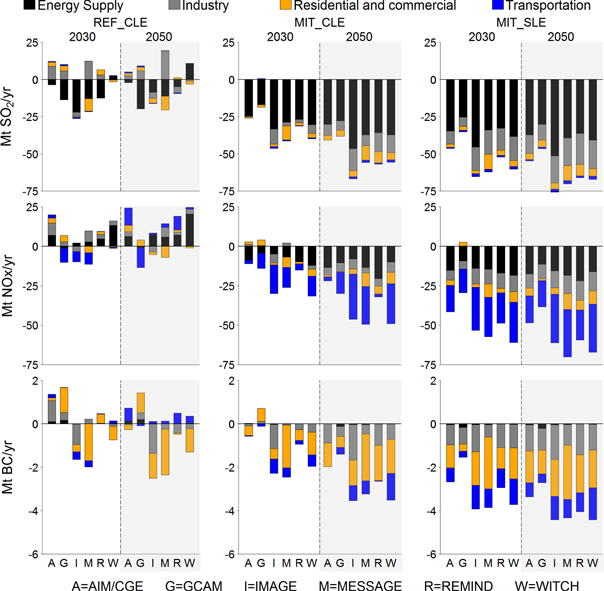
Figure 3. Sector disaggregation of emissions reductions across IAMs in 2030 and 2050 compared to 2010 in REF CLE, MIT CLE and MIT SLE respectively.
Download figure:
Standard image High-resolution imageWith climate policies, we see a convergence in the distribution of the reductions in air pollutant emissions across the different scenario realizations. Air pollutants decline due to increased non-fossil electricity production; penetration of advanced fossil electricity technologies; switch in process heating from coal to gas; a shift to natural gas and electricity based transport; accelerated energy efficiency improvements: and the replacement of coal use for cooking. The co-benefits from climate policies clearly depend on the extent to which such energy related transformations are already part of the respective reference scenarios. In cases, where favorable socio-economic and technological conditions imply low pollutant emissions in the underlying reference scenarios, the co-benefits from specific climate mitigation policies are correspondingly lower. An important finding is that potential tradeoffs from climate policies could occur from an increase in the use of traditional biomass in the residential sector in the near-term due to high fossil fuel prices and the relatively high costs of more advanced cooking technologies. Thus, effective ambient air pollution control in developing countries will require additional policies on access to clean energy for cooking.
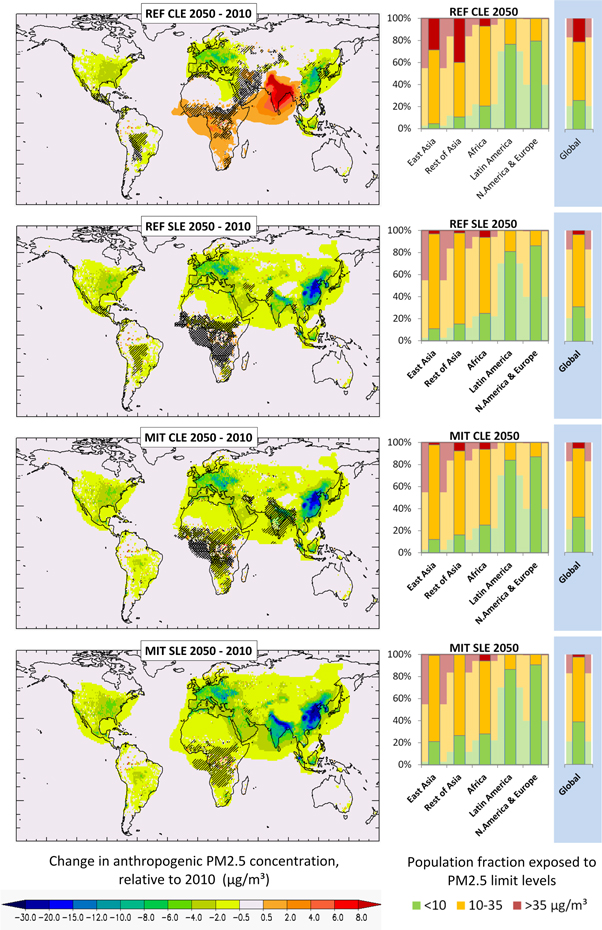
Given the different atmospheric and chemical nature of the pollutants, they can be expected to have varying impacts on regional air quality. In figure 4, we show how the change in man-made fine particulate matter (PM2.5) from 2010 to 2050 is spatially distributed for the different scenarios. By 2050, the REF-CLE results in lower annual ambient PM2.5 concentrations compared to 2010 levels in regions where legislation is already stringent, e.g., North America (average over all models: −2.4 ± 0.8 μg m−3) and Europe (−4.2 ± 1.0 μg m−3). For other regions, concentrations increase compared to 2010 (for example, India: +12 ± 4.7 μg m−3). Alternative developments in the reference scenarios across the emission models lead to a wide variation in PM2.5 trends in some regions, in some cases even with opposite trends, marked as hatched areas on the map. Differences in land-use emissions across scenarios are another important factor, especially in regions like Africa with large scale forest burning. The regional averages and standard deviation for ten world regions are available in the SI.
Figure 4. Left column; average difference in annual PM2.5 concentrations (includes primary PM components [BC, OC] and PM precursors [SO2, NOX, NMVOCs, CO, NH3) from all sources) between selected scenarios across the six models in 2050 and year 2010. Hatched areas indicate grid cells where at least one model has a different sign than the other models and where the standard deviation for the six models is larger than 0.5 μg m−3. Right column: regional and global fraction of population exposed to anthropogenic PM2.5 levels below 10, between 10 and 35 and above 35 μg m−3 for the scenario couples compared in the maps. Foreground: 2050 scenario; background: year 2010.
Download figure:
Standard image High-resolution image
By 2050, the REF-CLE scenario leaves 21% of global population (17% in 2010) above the WHO highest recommended Tier 1 values for long-term average PM2.5 concentrations of 35 μgm−3. Between 2010 and 2050, the whole Asian region experiences the most significant further deterioration, increasing from 28% to 36% the population fraction exposed to air pollution levels above Tier 1 levels. Stringent air quality policies (REF-SLE) reduce the fraction of global population exposed to anthropogenic PM2.5 levels above WHO Tier 1 value to 4% (Asia: 3% of population). The combination of climate policies with CLE controls results in a comparable reduction of pollutant levels (global exposure above Tier 1 level: 5%, Asia: 6%), although models show more diverging results over India and Africa than for the SLE scenario. The largest improvements in air quality, with most converging results of all models, result from a combination of air pollution and climate policies (MIT-SLE). By 2050, MIT-SLE results in less than 3% of global population (less than 0.5% in Asia) above Tier 1 values and 39% of the global population (25% in Asia) below the WHO AQG level of 10 μg m−3. The potential health impacts of such combined policies, although not calculated here are expected to be significant in Asia where the large increase in populations in the next few decades and the established nonlinearity in dose-response functions [22] implies that the types of relative shifts highlighted above could lead to significant declines in air pollution related mortality.
Discussion
Our findings support the notion that the co-benefits of climate mitigation policies can be useful in structuring action on the achievment of key SDGs related to air pollution and climate change.
The results emphasize the critical role of climate policies in complementing direct efforts on air pollution control. The use of multiple instruments that include technology-advancement policies in addition to direct emission controls could potentially offset uncertainty related to potential market failures [23]. However, with current policies, we find that many regions may only be partially capitalizing on the potential to achieve appreciable improvements in air quality and health. Traditional 'end-of pipe' pollution control may have less of a role in reducing emissions than the effects of socio-economic growth and related fuel and technological shifts, especially over longer time frames [24]. Thus 'pollution control' itself should be carefully designed to include a wide range of multi-sector efforts targeted at appreciable improvements in air quality and health [25, 26]. In developing countries, this will imply a need for additional policies on access to clean energy for cooking. This could potentially reduce household air pollution and afford additional improvements in health [27, 28].
In spite of the favorable environment that the SDGs may create, policy integration will not happen automatically. Integration of strategies across sectors and policy advice represents a challenge to the way development work is usually conducted, and will require a paradigm shift [29]. By increasing the robustness of climate policy to uncertain damages, abatement costs, and discount rates, the co-benefits of climate mitigation could potentially support more aggressive near term climate action even in the face of large uncertainty. In practice damages are, either implicitly or explicitly, balanced against the economic costs of pollution control, for which technology characteristics, particularly costs of pollution control or lower emission alternatives are a key driver [30, 31]. Other studies that have looked at the climate benefits of air pollution control have highlighted that their assessment could also be important in policy formulation [32–34].
This study has used a standard model inter-comparison under a common set of assumptions on policies with a goal to determine robust conclusions on the co-benefits of climate mitigation for air pollution. This approach allows us to capture the complex interactions between policy outcomes; and assess both model and scenario related uncertainty in qualifying the impacts of climate policies [35, 36]. We have dealt with the inherent uncertainties related to short-term trends in the drivers of emissions and the relatively large time steps underlying the models, through a specific focus on longer-term (multi-decade) scale trends. We acknowledge that innovative risk management approaches that explicitly account for structural uncertainties can be further useful in deriving robust policy conclusions, but these have not been implemented in IAMs so far [37].
The methods and findings from this study have important implications for the development of long-term scenarios of air pollution. Future efforts on modeling and scenario development will benefit from integrated narratives that are multi-dimensional and encompass social, economic and environmental factors, thus allowing for informed and relevant policy choice.
Acknowledgments
The research leading to these results has received funding from the European Union Seventh Framework Programme FP7/2007-2013 under grant agreement n° 282846 (LIMITS).