

Abstract
The 2003 drought event in Europe had major implications on many societal sectors, including energy production, health, forestry and agriculture. The reduced availability of water accompanied by high temperatures led to substantial economic losses on the order of 1.5 Billion Euros, in agriculture alone. Furthermore, soil droughts have considerable impacts on ecosystems, forest fires and water management. Monitoring soil water availability in near real-time and at high-resolution, i.e., 4 × 4 km2, enables water managers to mitigate the impact of these extreme events. The German drought monitor was established in 2014 as an online platform. It uses an operational modeling system that consists of four steps: (1) a daily update of observed meteorological data by the German Weather Service, with consistency checks and interpolation; (2) an estimation of current soil moisture using the mesoscale hydrological model; (3) calculation of a quantile-based soil moisture index (SMI) based on a 60 year data record; and (4) classification of the SMI into five drought classes ranging from abnormally dry to exceptional drought. Finally, an easy to understand map is produced and published on a daily basis on www.ufz.de/droughtmonitor. Analysis of the ongoing 2015 drought event, which garnered broad media attention, shows that 75% of the German territory underwent drought conditions in July 2015. Regions such as Northern Bavaria and Eastern Saxony, however, have been particularly prone to drought conditions since autumn 2014. Comparisons with historical droughts show that the 2015 event is amongst the ten most severe drought events observed in Germany since 1954 in terms of its spatial extent, magnitude and duration.
Export citation and abstract BibTeX RIS

Original content from this work may be used under the terms of the Creative Commons Attribution 3.0 licence. Any further distribution of this work must maintain attribution to the author(s) and the title of the work, journal citation and DOI.
1. Introduction
Drought is a natural phenomenon that results from deficiencies in precipitation compared to the expected or normal amount (Wilhite 2005). It may translate to water scarcity, a discrepancy between the actual demand and the corresponding availability of water for environmental and societal needs. Compared to other natural disasters, droughts have the largest spatial extent and longest duration (Sheffield and Wood 2011). These slowly developing events easily persist over several years and can reach national to continental spatial coverage (Sheffield and Wood 2011, Samaniego et al 2013). According to the EM-DAT database (Guha-Sapir et al 2015), droughts affected 2.2 billion people worldwide between 1950 and 2014, thus making droughts the second most important natural disaster after floods (3.6 billion people affected). In Europe, for example, the costs per event during this period are estimated to be 621 Mio. EUR, the costliest amongst all natural disasters that occurred in this region (Guha-Sapir et al 2015). Droughts have impacts on many societal sectors, including forestry, water resources management, energy generation, and health. Their impacts can be divided into direct and indirect impacts (Wilhite et al 2007). Examples of direct impacts are reduced crop yield and forest productivity, increased forest fire hazard, reduced water levels, and increased mortality rates for livestock, wildlife and fish. They can usually be quantified, though the assessment of indirect impacts is often challenging. An example of indirect drought impact is variable food prices due to market effects in the agricultural sector. As a result, it is difficult to estimate the total costs and losses at the regional and national levels. Indirect losses of droughts often exceed those of the direct ones (Wilhite et al 2007).
According to the European Commission, the frequency of droughts has increased since 1980 and will, very likely, further increase (EEA 2012). To date, 11% of the European population and 17% of the area of the EU have been affected by water scarcity (European Commission 2007, 2010). For example, the 2003 drought event, which covered major parts of Europe, caused 7000 fatalities in Germany alone (European Commission 2012) and had an agro-economical impact of 1.5 billion EUR. On the European level, the death toll was estimated to exceed 70 000 (Robine et al 2008), and the agro-economical impact was estimated to be 15 billion EUR (COPA-COGECA 2003). This severe drought impacted many components of societal life. It disrupted irrigation, inland navigation, and power plant cooling (Fink et al 2004, Parry et al 2007).
A precise and generally accepted definition of drought does not exist (Wilhite 2005) because drought impacts are specific to the region of its occurrence and to the field of interest. According to the WMO (2006) and Mishra and Singh (2010), four different types of drought exist: meteorological, hydrological, agricultural and socioeconomic droughts. Meteorological droughts relate to a deficiency of precipitation. Agricultural droughts arise as a consequence of this deficiency. They are characterized by low soil water availability for plants. Potential consequences of agricultural droughts are reduced biomass and yield or crop failure. Long-term soil water deficiencies diminish to surface and subsurface water availability, resulting in hydrological drought. It is denoted by reduced streamflow and low water levels of reservoirs and lakes. Hydrological droughts mainly affect water resources management, power plant cooling, irrigation and inland navigation. Groundwater droughts are a special case of hydrological droughts (van Lanen and Peters 2000, Kumar et al 2016). They occur when water deficiencies reach deep subsurface storages resulting in exceptionally low groundwater levels, groundwater recharge and baseflow. They reduce the supply of fresh water, where groundwater is the major source for drinking water supply. Socio-economic drought can emerge from all of the aforementioned drought types. It is characterized by a shortfall of water supply (water scarcity) leading to monetary losses. In terms of duration, precipitation drought has the shortest occurrence, followed by agricultural drought and finally hydrological and groundwater droughts.
The German drought monitor (GDM) presented herein focuses on agricultural droughts, which are highly relevant for Germany because they may induce substantial agro-economic losses as shown by the 2003 drought event. Within this study we review existing drought monitoring systems and the advantages of the newly developed monitor for Germany. Furthermore, we present the technical implementation of the GDM and an analysis of the drought event 2015 for which the GDM received broad attention from several media and the public. Finally, we provide an outlook on future developments of the GDM.
2. Drought monitoring
Drought monitoring and early warning systems are designed to identify water deficiencies in climatic or hydrologic variables. They aim to detect emergence, probability of occurrence and the potential severity of drought events (WMO 2006). A drought monitoring system that delivers timely information about the onset, extent, and intensity of drought events could help to mitigate drought related impacts such as economic losses (Wilhite 1993).
2.1. Existing drought monitoring systems
Several drought monitors for large parts of the world are currently available to the public. On the continental scale, drought monitoring or forecasting systems exist for North America (Lawrimore et al 2002), Europe (Horion et al 2012), and Africa (Sheffield et al 2014). On a national scale, online platforms are available for India (Shah and Mishra 2015), the Czech Republic (Trnka et al 2014), and the United States of America (Svoboda et al 2002, Luo and Wood 2007, Wood 2008). Efforts to monitor drought evolution on the global scale have been made by Pozzi et al (2013) and Hao et al (2014).
A variety of input data, spatial and temporal resolutions and estimated drought indices can be found among these monitoring systems. The longest established system is the US drought monitor launched in 1999. The weekly published map is a composite of different indices based on meteorological observations, i.e., standardized precipitation index (SPI), the Palmer drought severity index, soil moisture percentiles derived from hydrologic model simulations, and expert knowledge from more than 130 people (Svoboda et al 2002). Thus, local experts like agricultural and water resources managers can add information and help verify the drought map. The North American drought monitor was implemented in 2002 based on experience with the US drought monitor (Lawrimore et al 2002). It enlarges the investigated domain to Canada and Mexico and delivers monthly drought maps. The drought monitors of the University of Washington (Wood 2008) and Princeton University (Luo and Wood 2007) cover the continental United States, showing simulations and forecasts of soil moisture, snow and runoff at 1/8° spatial resolution derived using the variable infiltration capacity (VIC) macroscale hydrologic model (Liang et al 1994).
Systems established for India (Shah and Mishra 2015) and Africa (Sheffield et al 2014) are based on bias-corrected satellite precipitation with the latter including a seasonal forecasting capability. These systems are running on 1/4° resolution using the VIC model and provide drought indices based on precipitation, soil moisture, and streamflow. The Czech drought monitor (Trnka et al 2014) is based on modeled root zone soil moisture, which is derived from local meteorological observations. Maps are published on a weekly basis and have a spatial resolution of 500 m.
The European drought observatory (EDO) publishes the current drought status for Europe at a 10 d interval based on a combined drought indicator composed of the SPI as well as soil moisture and vegetation conditions (Horion et al 2012). The soil water and vegetation status are assessed by its anomalies. EDO uses local observations to derive the SPI and the hydrologic model LISFLOOD (De Roo et al 2000) to estimate soil moisture. The status of the vegetation is estimated based on the fraction of absorbed photosynthetically active radiation (fAPAR) retrieved from ENVISAT. The spatial resolutions of precipitation, soil moisture and fAPAR are 25 km, 5 km and 1 km, respectively, whereas their reference periods are 1981–2010, 1990–2010, and 1997–2010, respectively (Horion et al 2012).
2.2. Aims of the GDM
The implementation of a national drought monitoring system goes beyond the capabilities of the existing systems. In our work with regional stakeholders from agriculture and forestry, the need for a high-resolution, near real-time, regional monitoring system was expressed. Therefore, the drought monitoring system presented herein is based on data provided by the German Meteorological Service (Deutscher Wetterdienst (DWD), 2015), which are the most dense and reliable meteorological data available for this region. Furthermore, due to the long-term availability of these data, we are able to use a 60 year reference period for the estimation of drought indices for every grid cell and day of the year. This is substantially longer than those in other existing systems for this region.
The GDM addresses the need for daily up-to-date agricultural drought information. This broadens the decision base for local authorities complementing other available drought information based on e.g. precipitation or streamflow. Finally, the implementation of a national drought monitor encourages local experts, stakeholders and decision makers to take part in the future development. At the same time, it helps to validate the GDM.
3. Operational drought monitoring framework
Ground-based monitoring of nation-wide soil moisture is to-date hardly possible. Hence, this study presents a drought identification and classification framework based on near real-time observed meteorological data and distributed hydrologic modeling. The GDM estimates soil drought conditions on a high spatial resolution and allows for the evaluation of recent drought events with respect to historical events. A similar framework to that used in the GDM is applied to rank historic drought events in Germany (Samaniego et al 2013) and for seasonal drought predictions in Europe (Thober et al 2015).
The operational system consists of four processing steps (figure 1). In the first step , local observations from the German Meteorological Service are retrieved every morning (Deutscher Wetterdienst (DWD), 2015). These data are initially quality checked by the DWD. Nevertheless, the GDM checks the downloaded data for consistency and detects outliers as a supplementary quality control. Currently, approximately 1700 precipitation and 500 climate stations, which observe the minimum, maximum, and average daily temperatures, are used to derive daily fields of meteorological input data for the hydrologic model. The daily data are interpolated by external drift kriging using terrain elevation as external drift. The spatial resolution of the resulting meteorological fields is a compromise between the demands for highly resolved hydrological predictions, which are required by stakeholders and practitioners, and the lowest reasonable resolution supported by the input data. The average minimal distance between two neighboring precipitation stations is approximately 6 km in Germany. Thus, a target of 4 × 4 km2 resolution was implemented, which would provide high-resolution information without facing the risk of over-interpreting of the meteorological observations. These data are available with a time lag of 4 d. Due to the high persistency of soil moisture, this near real-time estimation is considered sufficient for agricultural or water management purposes.
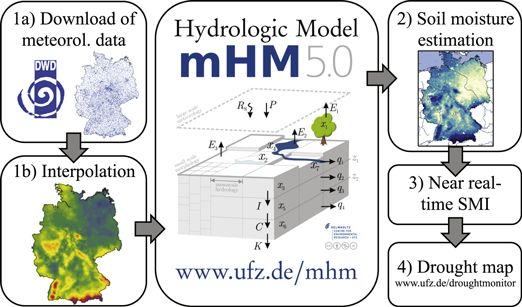
Figure 1. Framework of the German drought monitor. After (1) downloading and interpolating of the meteorological data from the National Weather Service (DWD) the data are fed to the hydrologic model mHM. (2) mHM estimates the soil moisture for the entire root zone on a daily basis which is used to (3) calculate the soil moisture index (SMI). The SMI is (4) classified and visualized in a drought map published online.
Download figure:
Standard image High-resolution imageIn the second step, these interpolated fields are used to force the mesoscale hydrological model (mHM), a process-based model that treats grid cells as unique hydrological units. It comprises hydrological processes such as interception, snow accumulation and melting, infiltration, soil water dynamics, groundwater recharge and storage. The generated discharge of a model cell consists of direct runoff, baseflow, slow and fast interflow, which, after aggregating its components, is routed through the model domain using the Muskingum-Cunge flood routing algorithm (Chow et al 1988, Todini 2007). By using the multiscale parameter regionalization technique (Samaniego et al 2010, Kumar Samaniego and Attinger 2013), mHM directly accounts for the sub-grid variability of physiographic characteristics. The model parameters are estimated in a preliminary step on the lowest possible input resolution of the physiographic variables, i.e., 100 × 100 m2. In a second step, effective parameters at the hydrological modeling resolution of 4 × 4 km2 are estimated by applying particular upscaling operators. This technique makes mHM scale- and location-independent because it connects effective parameters to physiographical inputs (Kumar Samaniego and Attinger 2013). In several studies, the model has shown to perform satisfactorily in a wide range of catchments with drainage areas ranging from 4 to 530 000 km2 and with contrasting climatic regimes (Germany, India, USA, Europe; e.g., Samaniego et al (2011, 2013), Kumar et al (2013), Rakovec et al (2016)).
A soil moisture field, updated daily, is estimated by running the model with an internal time step of one hour. The soil water availability is estimated in three different layers. The thicknesses of the upper two layers are 5 and 20 cm. A third layer is spatially variable in depth, depending on the soil horizon properties specified in the input data. This variable depth, is on average, 1.8 m in Germany. The estimated soil moisture of each single layer is used to estimate the total root zone soil moisture. The hydrological model stores specified state variables at the end of a model run. To calculate the soil moisture statistical reference, we performed a 60 year simulation from 1954 to 2013. Within the operational framework, we are currently performing hydrological simulations initialized with the model states of December 31, 2013. Thus computational time is minimized as the daily model simulation runs from January 1, 2014, onwards. An evaluation of the hydrologic model on the domain of Germany is provided by Samaniego et al (2013).
The third step within the GDM is to transform the daily updated soil moisture into the soil moisture index (SMI) by estimating the percentile of the updated soil moisture value with respect to its climatology. The daily updated soil moisture is estimated as the average of the soil conditions of the preceding 30 d. Therefore, it represents values that correspond to a time period of 1 month. The SMI is estimated using a non-parametric kernel-based cumulative distribution function based on a 60 year historic soil moisture reconstruction (1954–2013), as described by Samaniego et al (2013). The SMI is bounded between 0 and 1 and can be easily transformed to the unbounded range of the standard normal distribution e.g. used for the SPI (McKee et al 1993). It is estimated on every grid cell and for the particular time of the year (i.e., the average of the 30 days preceding the estimation day). The 1 month running mean of soil moisture data for SMI derivation was chosen because it is well established in scientific literature (Andreadis and Lettenmaier 2006, Sheffield and Wood 2007, Vidal et al 2010, Samaniego et al 2013).
Finally, the fourth step consists of categorizing the estimated SMI into several drought classes and visualizing the results. A main requirement for the appearance of the publicly available drought map is intelligibility. For the visualization of drought events, we adapted the appearance of the GDM to that of the US Drought Monitor (Svoboda et al 2002), using five classes. Four classes define drought conditions, and the fifth class describes the pre-warning state of abnormally dry (table 1). The four drought classes scale from moderate, (vegetation prone to water stress) to exceptional (high probability of losses of crops and increased forest fire risk).
Table 1. The classification of droughts for the German drought monitor based on the soil moisture index (SMI) (adapted with permission from Svoboda et al (2002) © American Meteorological Society).
| SMI class | Condition of the soil | Description of potential impacts |
|---|---|---|
| 0.3 ≤ SMI < 0.2 | Abnormally dry | Conditions before or after a preceding drought |
| 0.2 ≤ SMI < 0.1 | Moderate drought | Damages to crops and pastures possible |
| 0.1 ≤ SMI < 0.05 | Severe drought | Losses in crops and pastures are likely |
| 0.05 ≤ SMI < 0.02 | Extreme drought | High probability of major losses in crops and pastures |
| SMI ≤ 0.02 | Exceptional drought | High probability of exceptional losses in crops and pastures |
The classes are derived using the thresholds of the SMI (table 1). These thresholds reflect the occurrence of similar conditions in the past and thus indicate the potential impacts of these conditions. For example, the class of exceptional drought is defined by an upper threshold of 0.02. This implies that this soil moisture conditions were observed in less than 2% of the time within the 60 year reference period at this grid cell and time of the year. Thus, this drought condition only occurred in less than 1.2 cases over the last 60 years, which is equal to a return period of 50 years.
Because the SMI describes the status of the soil but not necessarily the impact on the vegetation, this classification scheme still requires further research. Crops cope with drought conditions better or worse at different stages of plant development and may not be influenced by heavy drought conditions. Revisiting this argument would mean that an effect of the SMI on vegetation at different stages of plant development has to be investigated.
The resulting maps are visualized and published online in the GDM. Currently, an up-to-date drought map is published every morning at 3 am CET on www.ufz.de/droughtmonitor. This information is accompanied by historical, monthly drought maps starting in 2014. We provide detailed maps available since 1954, of particular regions as well as the underlying soil moisture and SMI data on request.
4. Benchmark for the recent 2015 drought event
Germany has experienced two drought events since the implementation of the GDM. The first took place in spring 2014, and the second occurred in summer/autumn 2015. These events are used to assess the performance of the GDM. The 2014 event (see figure 2, upper row) had its largest spatial coverage in April 2014. In Germany, 70% of the area was under drought conditions (SMI  0.2), with 25% of the total area being under exceptional drought (SMI
  0.02). The situation improved significantly in May 2014 due to above average rainfall, and the total drought area (moderate to exceptional drought) decreased to almost half of the area affected in April. Furthermore, the area under exceptional drought reduced to only 1%. As a consequence, the vegetation and, in particular, agricultural crops received sufficient amounts of water, especially during the crucial growing phase after seeding in April/May. In consequence, even the deterioration of drought conditions in June did not have a negative impact on yield in 2014. On the contrary, the Federal Ministry of Food and Agriculture (BMEL 2014) reported that productivity of agriculture was superior to the preceding 6 years.
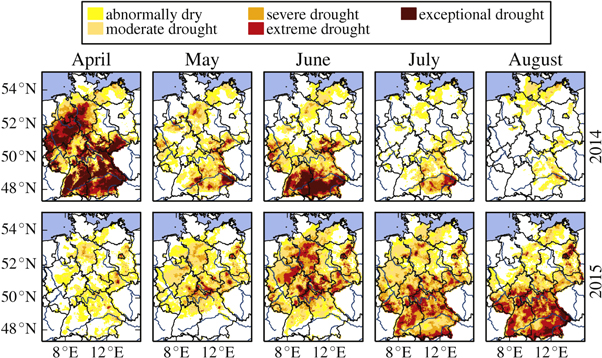
Figure 2. Soil water conditions from April to August in 2014 (upper row) and 2015 (lower row).
Download figure:
Standard image High-resolution imageIn 2015, the drought situation was different (figure 2, lower row). In contrast to the situation in 2014, soils were not experiencing extreme to exceptional dry conditions in spring. The drought primarily evolved during spring and summer. Nevertheless, the growing phase of some crops was already delayed by water shortage in May (BMEL 2015). In some regions of Northern Bavaria and Eastern Saxony, soils were under drought conditions since autumn 2014. These regions were especially prone to losses in crop yield and to increased forest-fire risk. According to (BMEL 2015), corn yield was 22% below the average yield between 2009 and 2014 in Germany. Additionally, some regions of Germany were prone to losses in animal food production, so they faced the decision of either buying additional food or reducing livestock (BMEL 2015). Due to the low water levels, inland navigation was stopped on the Elbe River. A hotspot for very dry conditions was Berlin (figure 2, lower row), where trees had already started shedding their leaves in the middle of August. Reports on economic consequences have not been published yet, but there were extensive fire watch activities due to very high forest fire risk and losses in crops such as corn, which led to increased expenses. Almost 75% of the area of Germany was under at least moderate drought in July 2015. During August 2015, the total area under drought decreased, but the areas of extreme and exceptional drought conditions increased to 22% and 5%, respectively.
The recognition of the GDM increased significantly during the 2105 event. The information provided by the GDM were used for public information and drought assessment in local authorities. We could identify users due to individual requests of several federal state agencies including the Saxon State Office for the Environment, Agriculture and Geology, the Thuringian State Office for Environment and Geology, the Bavarian State Office for Agriculture, and the North Rhine Westphalia Chamber of Agriculture. They used the GDM to inform agriculture and forest managers about the current soil moisture status. The drought monitor got attention in the public due to reports in several media ranging from regional to national newspapers as well as television broadcasters. The number of page views of the GDM website followed the estimated area under drought (figure 3). This highlights that extreme events gather more public attention during periods when they do actually occur. Attention rose in April 2015 when newspapers in Saxony started reporting drought conditions due to negative impacts on forestry and agriculture, e.g., seeding of maize and dying tree seedlings. The highest interest was reached when several national media started republishing the maps of the GDM in August 2015. In the private sector, we got feedback from insurance and seed production companies.
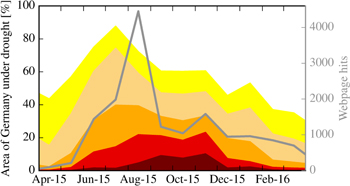
Figure 3. Percentage of area affected in Germany during the drought event in five drought classes (legend is show in figure 2) and total hits on our drought monitor webpage.
Download figure:
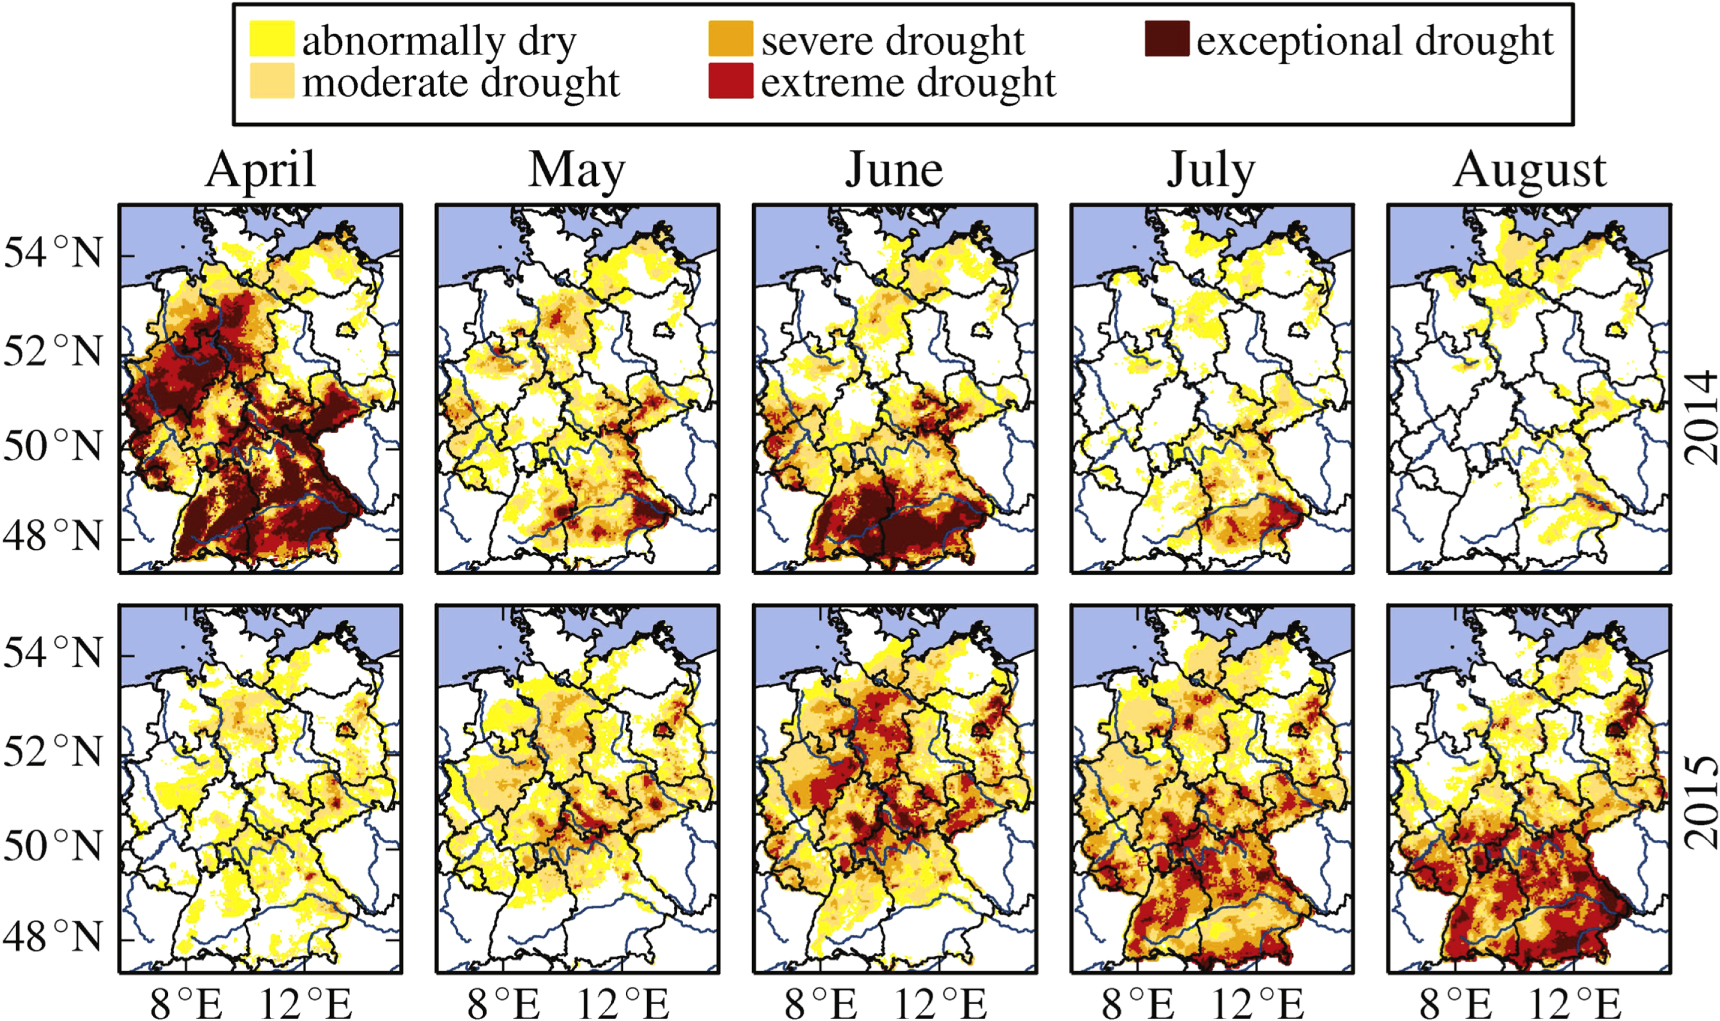
Standard image High-resolution imageThe benchmark of the 2015 event with respect to historical drought events is shown in figure 4. The left graph of this figure is created by applying the cluster identification algorithm proposed by Samaniego et al (2013). This three-step algorithm uses the duration, spatial extent and drought intensity to calculate a dimensionless drought magnitude. The drought intensity is calculated as the negative deviation from the SMI value 0.2, whereas the magnitude is the integral of drought intensity over time and space. The results show that the ongoing 2014–2015 event ranks among the 10 largest events observed in Germany since 1954.

Figure 4. Ranking of the recently ongoing drought event in 2015. The panel on the left shows the relationship between the area, duration and magnitude of drought events since 1954 (updated from Samaniego et al 2013). The 4 panels on the right show the ranking of drought area at specific months over the last 62 years. The magnitudes are represented by the size of the bubble and the color code. The reference period for this figure is 1954/01/01–2015/10/31.
Download figure:
Standard image High-resolution image
A more detailed insight can be obtained from the four panels on the right in figure 4. In these graphs, drought events are evaluated for calendar months. The integral of drought intensity is based on monthly values. The probability is calculated from the empirical cumulative density function of the area under drought. The numbers next to the bubbles denote the respective year of the drought event. The drought conditions in June and July 2015, rank within the four largest events with respect to spatial extent. The magnitude is highly correlated to the area under drought; hence, between June and September, the 2015 event ranks among the 7 largest events for the respective months. The displayed 2003 event is well remembered in Germany due to its large socio-economic impacts. In 2003, the drought event evolved more slowly than the 2015 one did, but the former peaked in August, with a magnitude M = 2067, which is greater than the maximum magnitude reached by the 2015 event in July (M = 1770).
5. Conclusion and outlook
The GDM provides an easily accessible agricultural drought information system on both the regional and national level. It provides an added value through the daily, high-resolution availability of formerly unaccessible information. Stakeholder feedback indicates that the main user groups are from regional agencies and the agriculture and forestry sector. During the 2015 drought, the GDM was widely used by the media and stakeholders when drought consequences became visible (e.g., in tree leaf coloring in summer).
The GDM is driven by an observational dataset, which enables drought estimates on a higher spatial resolution (4 × 4 km2) compared to other available products. A soil drought map for Germany is released to the public on a daily basis, with a latency of 4 d. This map is intended to be comprehensible and easy to access via a web browser. Additional information, e.g., the underlying SMI data, are available on request. The GDM information aims to support practitioners to optimize their actions.
A comparison of an ongoing event with historical drought events helps to understand their severity and to assess potential impacts. The sensitivity of plant growth to soil water availability depends of the timing within the year. This could be shown in the comparison of consequences of the drought situation in 2014 and 2015. Currently, the SMI data is used in our research to investigate the relationship between soil moisture and crop yield for different times of the year to gain more knowledge about the consequences of agricultural droughts.
Feedback from stakeholders has already been integrated in the GDM, e.g. in the publication of drought information for the uppermost soil layer with a depth of 25 cm. The future development of the GDM will reflect the needs of stakeholders and decision makers. We use the Climate Office for Central Germany, a regional climate service center, to inform agencies, agricultural engineers, water resources managers, hydrologists and policy makers about the potential of the GDM. In this dialog-based knowledge transfer, we identify (1) how to improve the visualization of drought information (e.g., readability and information content of the maps); (2) how to implement local expert knowledge into the daily published product, and (3) which additional information or combination of drought indices may be beneficial (e.g., SPI).
Currently, the drought maps are based on a 30 days soil moisture average, which is a well established procedure found in the literature. Shorter time aggregations may provide new information for particular crops. Thus, further research has to be attributed to determine the sensitivity of temporal aggregation on the SMI and how this relates to agricultural crop development.
An additional field of work remains in handling predictive uncertainties. These uncertainties stem from the input data, the model structure and the model parameters (e.g., Wagener et al 2003). Samaniego et al (2013) showed that parametric uncertainty alone can lead to significant classification errors in drought characteristics. A major challenge is to investigate how to communicate such uncertainties to the public and decision makers without counteracting the GDM's simplicity and intelligibility.
Providing forecasts may help to better mitigate drought consequences. Studies like Thober et al 2015, however, showed that soil moisture drought forecasts underlie significant uncertainties at seasonal lead times. Nevertheless, we aspire to assess the potential of short and medium range forecasts.
The GDM presented herein provides free, high-resolution, near real-time drought information for Germany and a contribution to mitigate negative effects of agricultural droughts.
Acknowledgments
We kindly acknowledge the German Meteorological Service (DWD), the Joint Research Center of the European Commission, the European Environmental Agency, the Federal Institute for Geosciences and Natural Resources (BGR), the Federal Agency for Cartography and Geodesy (BKG), the European Water Archive and the Global Runoff Data Centre at the German Federal Institute of Hydrology (BfG) for the provision of data. We especially thank Sven Petruschke and Ben Langenberg (UFZ) for their web and Linux cluster support. This work was supported by the 'Helmholtz Alliance Remote Sensing and Earth System Dynamics' and is part of the Helmholtz Alliance Climate Initiative REKLIM. We would like to thank two anonymous reviewers for their valuable comments.