
Abstract
The human alteration of the nitrogen cycle has evolved from minimal in the mid-19th century to extensive in the present time. The consequences to human and environmental health are significant. While much attention has been given to the extent and impacts of the alteration, little attention has been given to those entities (i.e., consumers, institutions) that use the resources that result in extensive reactive nitrogen (Nr) creation. One strategy for assessment is the use of nitrogen footprint tools. A nitrogen footprint is generally defined as the total amount of Nr released to the environment as a result of an entity's consumption patterns. This paper reviews a number of nitrogen footprint tools (N-Calculator, N-Institution, N-Label, N-Neutrality, N-Indicator) that are designed to provide that attention. It reviews N-footprint tools for consumers as a function of the country that they live in (N-Calculator, N-Indicator) and the products they buy (N-Label), for the institutions that people work in and are educated in (N-Institution), and for events and decision-making regarding offsets (N-Neutrality). N footprint tools provide a framework for people to make decisions about their resource use and show them how offsets can be coupled with behavior change to decrease consumer/institution contributions to N-related problems.
Export citation and abstract BibTeX RIS

Content from this work may be used under the terms of the Creative Commons Attribution 3.0 licence. Any further distribution of this work must maintain attribution to the author(s) and the title of the work, journal citation and DOI.
1. Introduction
For millennia the formation of reactive nitrogen (Nr; defined as all N species except N2) from unreactive nitrogen (N2), by lighting and biological N fixation (BNF) was balanced by deep sedimentation and the conversion of Nr back to N2 by denitrification, anammox and other processes (Galloway et al 2004, 2013), leading to little accumulation of Nr in environmental reservoirs.
Nr was mainly used by organisms in terrestrial and aquatic ecosystems to sustain life and efficiently recycled through the food web system. Often N was the limiting factor to increase production for both terrestrial and aquatic ecosystems. As a consequence, Nr concentrations remained low in most environmental compartments. The limited availability of Nr resulted in natural processes being effective at using Nr as a resource and created interactions among animals, plants and soil life with a wealth of biodiversity. Nevertheless, there were pockets where Nr was more concentrated, such as animal excreta or nitrate salts. Humans learned to take advantage of these resources for agriculture: first animal and human manure, then also the non-renewable guano and saltpeter resources, e.g. in South America. Up to about a century ago, humans relied on these naturally occurring N-rich sources to sustain food production.
The only significant anthropogenic process used to create new Nr to grow crops was the cultivation of legumes, and that was on the small scale—in 1850 only ∼20% of Nr creation on land was due to cultivation-induced BNF (Galloway et al 2013). However, as the global population grew, the demand for food outstripped traditional sources (e.g., biomass and manure) and new sources were developed (i.e., Haber–Bosch process) (Erisman et al 2008). In addition, the increased demand for energy to run the Industrial Revolution was met by increased fossil fuel combustion, which also contributed to anthropogenic Nr creation. The increase was so large that by 2010, 75% of the Nr created on land was by human action. Saying it another way, in 2010, human Nr creation was more than three-fold greater than natural terrestrial Nr creation (Fowler et al 2013, Vitousek et al 2013).
This paper has two primary objectives: (1) describe the three eras of anthropogenic Nr creation, and (2) summarize and compare five different N footprint tools developed to help manage excess Nr in the environment. The first objective is focused on how the Nr creation rate on a total and per-capita basis has grown over the period, 1850–2005. This forms the input for scenarios of future Nr production and use. The second objective then examines several nitrogen footprint tools that have been developed to tie how resource use by consumers, institutions, nations and other entities results in Nr losses to the environment and reviews how the tools can be used to decrease those losses.
2. The four eras of Nr creation
Once upon a time, relative to nature, humans were an unimportant influence on the creation of Nr; now they are dominant. This section examines how that transition occurred using the metric of anthropogenic Nr creation on a per-capita basis, which is a component of a N footprint. The N footprint is defined as the total amount of Nr released to the environment as a result of an entity's consumption patterns. From a global perspective, the average N footprint per person can be approximated from the quantity of new Nr creation, divided by the global population.
Historically, we may distinguish three eras of Nr creation. The first era ended in 1950. Over the period 1850–1950, Nr creation increased roughly proportional to the population; per-capita Nr creation was constant at ∼12 kg N yr−1 (figure 1).

Figure 1. Temporal trends in global anthropogenic Nr creation on a total (left y-axis) and per-capita (right y-axis) basis. The historical three eras of per-capita Nr creation shown are <1950 (Era I), 1950 to ∼1980 (Era II) and ∼1980–2005 (Era III). The fourth era represents the time period 2005–2050, using the scenarios in figure 2 (see next section).
Download figure:
Standard image High-resolution imageThe second era (1950 to ∼1980) was a period of a rapid increase in per-capita Nr creation. It rose from ∼12 kg N yr−1 in 1950 to ∼30 kg N yr−1 in 1980; at the same time, the global population continued to increase, pointing towards an even greater increase in total Nr creation. Reasons were the increasing use of fossil fuel energy and increased use of Haber–Bosch fertilizer with a decreasing use efficiency in support of the consumption of higher quality food, especially animal protein, while ignoring the N use efficiency.
The third era (approximately 1980 to current) of the global per capita Nr creation reached a new equilibrium between population growth and Nr creation where the per-capita Nr creation remained at ∼30 kg N yr−1 over this ∼20 yr period and again, just like in the first period, Nr creation kept pace with population growth. Since the population growth now is much faster than in the first period so is Nr production. Total Nr creation continues to rise with an increasing global population (Erisman et al 2011).
The stability in the overall per-capita Nr creation, relative to the previous ∼20 yr, is remarkable, as it is a result of many individual underlying processes. The emissions from fossil fuel combustion decreased over the last few decades, due to efficient NOx controls in many developed countries. In part due to increase in the nitrogen use efficiency of agricultural production as a result of environmental considerations, but also due to the cost of fertilizer activities, e.g., in OECD countries. The economic turnover in Eastern Europe also meant a strong decrease in fertilizer use and associated wastage in that part of the world. On the other hand, production of corn for biofuel, the strong increase in meat production and especially change in diets in large parts of the developing world caused significant increases in fertilizer use.
To set the range for expected future changes in both total and per-capita Nr creation during the period 2005–2050, Era IV uses the 'Bouwman baseline' and 'Bouwman low' scenarios from figure 2 (see below), and the population projections from UN (2007) to estimate the per capita Nr of 2050. The message is clear: the next and fourth era in both scenarios shows an increase in Nr efficiency on a per capita basis, despite the increase in Nr and population. This is a movement in the correct direction, but still not sufficient to avoid further increase of Nr, calling for further analyses of future scenarios.

Figure 2. Creation of reactive nitrogen for different purposes, current and in 2050. Note that the 2050 scenarios consist of a baseline (without specific Nr mitigation) and a low estimate, but no high estimate is presented.
Download figure:
Standard image High-resolution image3. Scenarios of creation of Nr
Trajectories for future N creation/fertilizer production have been presented by Erisman et al (2008) who estimated the development of N-fixation in agriculture starting from the SRES scenarios used in previous assessment reports of IPCC. Winiwarter et al (2013) applied the same concept to the representative concentration pathway (RCP) scenarios, which have been developed to consider the impact of dedicated 'low carbon' policies (Van Vuuren et al 2011) for use in the most recent, fifth assessment of IPCC (Stocker et al 2013). Scenarios refer to the radiative forcing exerted in the year 2100, e.g. RCP2.6 and RCP6.0 are 2.6 and 6.0 W m−2, achieved through such low carbon policies. These policies would affect Nr in different ways, so Winiwarter et al conclude for the time period until 2100 that drivers of Nr (population increase, efficiency improvements, diet changes, biofuel production) lead to trends partially compensating each other, with an effect of total industrial N-fixation for agriculture creation in 2100 between 79 and 172 Tg N yr−1, which is slightly less or almost twice the value of 89 Tg N yr−1 in 2000. Bouwman et al (2013) end up with comparable results, which also would indicate the possibility of a slight decrease. With a more detailed approach and their baseline scenario extending to 2050, these authors investigate variants optimizing towards reduced nitrogen impact. Their lowest variant is here used as the 'low' case. They also provide for differentiation of cultivation BNF by leguminous crops. A dedicated and very ambitious global mitigation policy of Nr has been described by Bodirsky et al (2014), comparable to the ambitious carbon mitigation policies that form the basis of the low-emission RCP scenario. Bodirsky et al use as their baseline the 'SSP2' socio-economic storyline, which according to Van Vuuren and Carter (2014) in terms of emissions resembles most closely the RCP 6.0 scenario. Figure 2 compares annual creation of Nr from a current perspective with that of a baseline case for 2050 (projection without dedicated action to reduce Nr), and an ambitious mitigation case ('low'). Note that this figure does not include a high emission scenario.
In order to allow for a full picture on anthropogenic impacts, we also estimate combustion NOx and Nr fixed by the Haber–Bosch process for use in industry. NOx combustion emission scenario data of the RCP scenarios are available for direct download (http://tntcat.iiasa.ac.at:8787/RcpDb/dsd?Action=htmlpage&page=welcome). In line with the scenario definition, we use RCP6.0 for the baseline case, but apply the somewhat smaller RCP2.6 emissions for the low N case. Both scenarios assume a large share of installations operating under stringent emission control. Such controls are technically available; their practical implementation is often impeded by cost considerations, so the estimates may be rather optimistic.
Very little information is available on Nr from industry sources, but a recent study by Gu et al (2013) may help to explain the magnitudes. These authors differentiate between non-structural Nr, which is released within a year of formation, and structural N compounds that are part of materials for long-term use. Here we will base our analysis on the non-structural N (∼75% of Nr used in industry or 19.1 Tg N in the year 2008). The fate of Nr from industrial sources is largely unknown, and we are aware that also part of structural Nr will eventually end up in the environment. Gu et al (2013) report an increase of industrial Nr between 1960 and 2008 of about 5% p.a., which we extrapolate to cover the years 2000 and 2008 in figure 2. For the 2050 baseline case, we apply Gu et al (2013)'s assumption of at least tripling the 2008 production—this is a conservative (low) estimate as it requires a strongly decreased growth of only about 2.5% over 40 yr. For the 'low N' case, considering the continuing strong development of N containing products, we estimate an annual growth rate of only 1%.
The overview of current estimates allows us to conclude that, following current trends, the need for Nr creation will increase for all sources. Climate mitigation policy may impact such trends if specifically addressing N2O (see e.g. Millar et al 2010, or Oenema et al 2013). Likely it will not affect continuing high release of Nr to the environment. This provides a collaborative challenge for all stakeholders, including agronomists, consumers and governments to reduce the Nr creation rate. Only dedicated policies towards reducing Nr footprints will allow the release of Nr to be mitigated. A number of approaches as elaborated below may support such policies.
4. N footprint approaches for raising awareness and policy support
This paper presents several approaches to use nitrogen footprints to raise awareness of the issues of excess Nr both at the public and decision-maker levels. We refer to these approaches as 'tools'. An initial N footprint tool was developed as part of N-Print, which is the umbrella project for three of the tools discussed in this paper (Leach et al 2012). The concept and development of this consumer-based nitrogen footprint tool has been applied to help consumers understand and possibly reduce their N footprint. This section of the paper gives an overview of the initial tool as well as four subsequent tools that apply the nitrogen footprint concept to other entities. As part of this presentation a comparative analysis showing how each nitrogen footprint tool can be used is presented (section 5). In addition to the initial tool (N-Calculator, Leach et al 2012), the other examples are (a) a footprint tool developed for institutions (e.g., universities) (N-Institution, Leach et al 2013), (b) a footprint tool that will estimate the amount of N in specific food products relative to the daily requirement (N-Label, Leach et al in preparation), (c) a footprint tool that allows an activity to become nitrogen neutral (N-Neutrality, Leip et al 2014a), and (d) a footprint-related approach that allows an easy comparison of the overall N use by all the world's nations (N-Indicator, Bleeker et al 2013).
4.1. N-Calculator
The first country-specific nitrogen footprints were calculated for the United States (US) and The Netherlands (NL) using the N-Calculator tool (Leach et al 2012). The web-based tool (www.n-print.org) is for individuals in different countries to estimate their contribution to nitrogen losses to the environment through their food consumption, energy use (e.g., transportation, electricity use), and the purchase of goods and use of services. Since published, N-footprint tools have been developed for Germany (Stevens et al 2014), the UK (Stevens et al 2014), Japan (Shibata et al, Austria (Pierer et al 2013), Portugal (Cordovil et al) and Tanzania (Hutton et al). The average N footprints range from 15 kg N capita−1 yr−1 (Tanzania) to 39 kg N capita−1 yr−1 (US) (table 1).
Table 1. Annual per-capita nitrogen footprints for eight countries (kg N capita−1 yr−1) calculated using the N-Calculator. 'Food consumption' refers to the nitrogen actually consumed and subsequently excreted, whereas 'food consumption, released' refers to the nitrogen released to the environment after sewage treatment.
| US | NL | Germany | UK | Japan | Austria | Portugal | Tanzania | |
|---|---|---|---|---|---|---|---|---|
| Food consumption | 5.0 | 1.1 | 1.6 | 4.9 | 3.4 | 1.1 | 6.0 | 2.0 |
| Food production | 22 | 20 | 18 | 18 | 26 | 16 | 18 | 12 |
| Housing | 3.0 | 0.8 | 1.6 | 2.0 | 0.8 | 0.8 | 0.7 | 0.2 |
| Transport | 6.0 | 1.1 | 1.8 | 1.1 | 0.7 | 1.6 | 3.5 | 0.8 |
| Goods and services | 2.5 | 0.5 | 0.7 | 1.1 | 1.0 | 0.6 | 0.5 | 0.2 |
| Total | 39 | 23 | 24 | 27 | 32 | 20 | 29 | 15 |
| Sewage, % denitrification | 5% | 78% | 67% | 2% | 33% | 79% | 0% | 0% |
| Food consumption, released | 5.3 | 5.0 | 4.9 | 5.0 | 5.1 | 5.2 | 6.0 | 2.0 |
4.1.1. Fate of N consumed in food
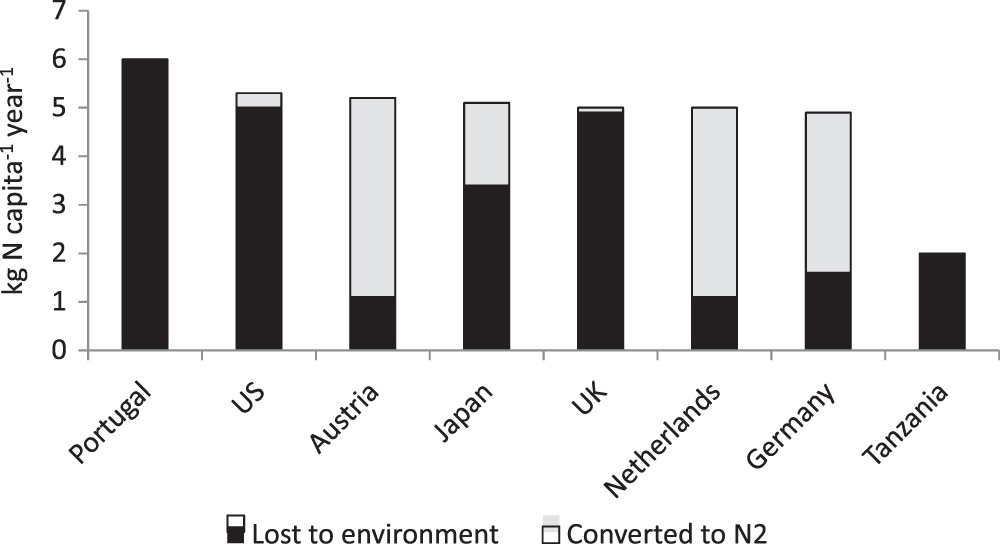
The footprint tool calculates the annual per-capita amount of N consumed in a country using Food Supply data from FAOSTAT (total height of column, figure 3), and then subtracts food waste (Gustavsson et al 2011) to determine the amount of food consumed. The food N consumed is then reduced by the percent of Nr converted to N2 in the denitrification process in the wastewater sewage treatment facility (gray portion of column, figure 3), which determines the net Nr loss to the environment (black portion of column, figure 3).

Figure 3. International variation in the short-term fate of Nr consumed by humans and the effect of wastewater treatment in converting Nr to N2 in Portugal, the US, Japan, the UK, the Netherlands, Germany, Austria, and Tanzania.
Download figure:
Standard image High-resolution imageThe notable features of figure 3 are:
- Developed countries consume about the same amount of N (5–6 kg N capita−1 yr−1), which is more than the one less-developed country (Tanzania; 2 kg N capita−1 yr−1). Despite the difference in diets in the different countries the N consumed is fairly similar. Overall the meat consumption is about the same in these countries.
- Some developed countries have substantially diminished the discharge of that N to the environment through advanced wastewater treatment that converts Nr to N2 (e.g., The Netherlands, Germany, Austria).
- Given that recommended annual N intake is 2.5–3.5 kg N capita−1 yr−1 (based on the WHO (2007) and USDA (2010) dietary recommendation of 0.8 g protein capita−1 d−1 and an average healthy body weight of 60–70 kg), on average people in all developed countries over-consume N.
Given that the level of sewage treatment is out of the consumers' direct control, the only way they have to decrease the food consumption portion of their N footprint is to decrease their consumption of protein to recommended levels. And as noted in other papers (e.g., Leach et al 2012, Leip et al 2014b, Westhoek et al 2014), another option available to consumers to decrease their overall food N footprint is to decrease the amount of animal protein consumed.
At the level of society, however, investment in efficient sewage systems is a realistic option to decrease losses of Nr to the environment, either by increasing denitrification rates, or by increasing the quality of sewage sludge produced and using this re-captured Nr for agricultural production. The last option would help decreasing both the 'consumption' and the 'production' footprint of food. It would be more effective, however, to change diets, especially to lower meat consumption since that would reduce the total amount of Nr created at the beginning of the nitrogen cascade rather than at the end.
4.1.2. Comparisons of virtual nitrogen to consumed nitrogen
Virtual nitrogen is the portion of the N that is released to the environment during the food production process and is not contained in the food that is consumed. Virtual nitrogen includes fertilizer runoff, processing wastes, manure losses, and food waste. Virtual N factors (VNFs) relate the virtual N to the food consumed:

For the countries considered in this comparative analysis, the total N associated with food production plus consumption ranges two-fold from 14 kg N capita−1 yr−1 (Tanzania) to 31 kg N capita−1 yr−1 (Japan) (figure 4). In contrast, the portion of the 'total' N that is 'virtual' has a much smaller range—from 75% (Portugal) to 83% (Japan). This relatively narrow range reflects that fact that independent of country, the efficiency of getting N into the food that is consumed is very low.

Figure 4. International variation in N consumed as food (black bars) relative to the virtual N lost to the environment to produce that food (gray bars) for Portugal, the US, Japan, the UK, the Netherlands, Germany, Austria, and Tanzania. The consumed N footprint reduction resulting from advanced sewage treatment is not shown in this figure.
Download figure:
Standard image High-resolution imageSome of the variability in virtual N is due to differences in the diet, or more specifically, in the relative amounts of plant versus animal protein consumption. Other variability is due to how the food is produced and where it comes from (transport). For example, the N consumption in the US and Netherlands is similar (5 kg N capita−1 yr−1), but the dietary composition and the associated virtual N in each country (22 kg N capita−1 yr−1 in the US and 20 kg N capita−1 yr−1 in the Netherlands) are different. The differences between the US and the Netherlands are mainly related a higher consumption of beef in the US versus more fish and dairy consumption in the NL (Leach et al 2012). The average food production footprint for the overall European Union (Leip et al 2014b) is about 32 kg N capita−1 yr−1 at the high end of this range. While consumers have control over what and how much is eaten, they have less control over how the food is produced and how the production method impacts N lost to the environment.
4.2. N-Institution
Nitrogen footprints such as N-Calculator connect entities (e.g., individuals), with the reactive nitrogen lost to the environment as a result of their activities (Leach et al 2012). This concept was extended to institutions in Leach et al (2013) which created the first institution-level tool to estimate the nitrogen footprint of the University of Virginia (UVA), both current (base year 2010) and projected to 2025. The tool is also used to test scenarios on the most effective ways to decrease the nitrogen (N) footprint of the university. This model for UVA can be extended to other universities, institutions, and even larger, more complex entities such as cities.
The UVA nitrogen footprint was calculated by tabulating all the Nr that entered the institution (e.g., food purchases), that was generated by activities at the institution (e.g., fossil fuel combustion in steam generators and buses), and that was generated due to activities at the institution (e.g., commuting, food production). The total nitrogen footprint of the university in 2010 was 492 metric tons (MT) N. Utilities usage (48%) and off-campus food production (37%) were the biggest contributors to the UVA nitrogen footprint. The remaining sectors (food consumption, fertilizer usage, transportation, and research animals) make up the final 15%. Of the food production categories, meat (22%) and dairy and eggs (10%) were the largest contributors to the footprint (figure 5).

Figure 5. Nitrogen footprint of the University of Virginia in 2010 in metric tons (MT) nitrogen (Leach et al 2013).
Download figure:
Standard image High-resolution imageIf the university were to continue with its current activities (i.e., business as usual (BAU)), by 2025 the N footprint of the university would increase by 15% to 564 MT N due to increased number of buildings and increased student population. However, scenario testing with the tool showed that by 2025, the N footprint could be decreased by 18%, relative to BAU, with the implementation of planned and feasible activities (e.g., energy conservation, advanced sewage treatment, expanded food composting), and by an additional 13% through further N-reduction strategies (e.g., sustainable food, dietary changes). Institutions like the UVA can use a nitrogen footprint tool to improve their sustainability by quantifying and reducing their nitrogen impact. Under the authority of the governing board for UVA, the tool is being used to develop strategies to decrease the institution's nitrogen footprint by 25% by the year 2025. This tool is now being applied to a number of other universities and several secondary schools (i.e., grades 9–12).
4.3. N-Label: a tool for food products
The per capita and institution level nitrogen footprints give entities an indication of their overall nitrogen sustainability by sector. However these tools do not provide consumers with information about an individual product.
A new proposed environmental food label will present the nitrogen footprint of a single food product to show that food product's contribution to nutrient pollution (Leach et al in preparation). The label is designed to be printed directly on a food product's packaging to help consumers make decisions at the grocery store. In this section, an environmental food label comparable across food types is presented. Leach et al (in preparation) will also explore an environmental food label that can compare the level of sustainability within food product categories (e.g., meat or vegetables).
The nitrogen footprint food label can be presented as a percent of the daily N footprint calculated for a sustainable diet. The percent daily value concept is based on the units for nutritional recommendations on existing USDA food labels. The percent daily value describes how much of the daily allotted food N footprint for a sustainable diet is contained in a single serving of food. For example, if a sustainable diet has an N footprint of 41 g N d−1 and a serving of food has an N footprint of 8 g N, then the percent daily value would be 19% (e.g., figure 6). In this example, the sustainable diet is defined as a healthy diet recommended by the USDA (USDA 2010). Although the healthy diet is not directly linked to environmental impacts and is therefore not a true indicator of sustainability, it was used because (a) the diet recommendation must meet minimum health requirements for humans and (b) a healthy diet does approach sustainability with its emphasis on low-impact food, such as non-meat proteins, in comparison to the current average US diet (USDA 2010, Leach et al 2012). The footprint associated with the healthy diet can then be calculated and set as the daily sustainable footprint. Consumers trying to eat a sustainable diet are encouraged to keep their consumption within the daily value guidelines.

Figure 6. Proposed environmental food label design as an add-on to the USDA nutrition label showing the percent daily value of the nitrogen footprint for a serving of (a) raw chicken and (b) wheat, as uncooked pasta. The daily nitrogen footprint was calculated based on a healthy diet recommended by the USDA.
Download figure:
Standard image High-resolution imageThree environmental food label designs using the described methodology are in preparation (Leach et al in preparation). One such design is an add-on to the USDA nutrition label (figure 6) where the percent daily value for the nitrogen footprint would be shown for a serving of food. These environmental food labels will ultimately show the carbon, nitrogen, and water footprints to describe a food product's contribution to greenhouse gases, nutrient pollution, and water consumption, respectively.
4.4. N-Neutrality
The N footprint tools discussed so far focus on informing the user about their N footprint and possibly proposing possible actions that would lead to a reduction of the N footprint. The concept of N-Neutrality proposed by Leip et al (2014a) goes one step further and describes a way to compensate the N footprint that could not be reduced by any of the mitigation measures.
N-Neutrality is achieved in two steps. First, the user needs to decrease the release of reactive nitrogen (Nr) into the environment by reducing over-consumption of food, reducing food wastes, minimizing energy consumption, and choosing sustainable sources of energy and food. Then, the user needs to contribute to a measured compensation of the remaining Nr releases. This can be done either by a measured reduction of Nr releases elsewhere to balance the remaining releases, or by an increase of the sustainability in the production of food where sustainable land management is not yet achieved (see Box 1 in Leip et al 2014a).
This concept was implemented at the 6th International Nitrogen Conference (Kampala, November 2013). Participants of this conference were asked to contribute with a compensation fee to support the UN Millennium village cluster Ruhiira South–Western Uganda, to increase soil fertility with afforestation programs. The N offset required to compensate the N footprint of the conference was quantified on the basis of surveyed total food consumption of the conference attendants. The energy N footprint was not considered for this first application of N-Neutrality.
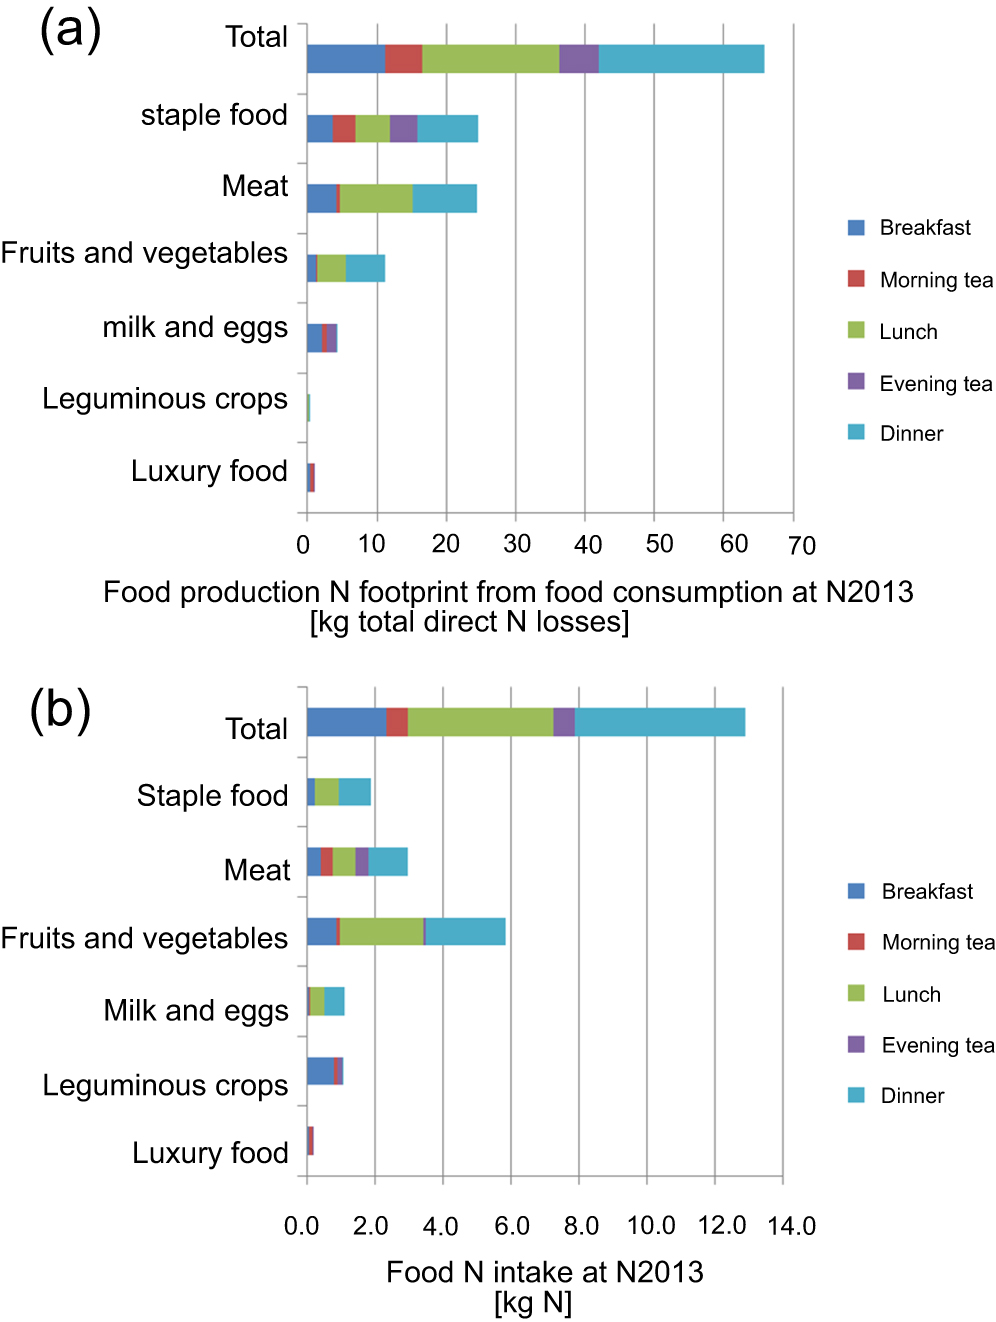
The total N footprint of the 6th International Nitrogen Conference was a total of 66 kg N lost to the environment. Total N intake by actual food consumption over the five-days conference was surveyed at 12.9 kg N, for an average of 140 persons at each meal served (see figure 7).
Leip et al (2014a) based the concept of N-Neutrality on a N footprint tool. Those decisions had been made because the N footprint was considered the adequate metric for N-Neutrality and a conference a suitable environment for the first application of the concept. However, the N footprint as a metric and a conference as target group are not inherent characteristics of the N-Neutrality concept; rather, other metrics might be equally powerful (see supplementary information in Leip et al 2014a). Most importantly, N-Neutrality has to be seen as independent from a specific entity and could be applied for example to individual products (e.g., if the producer/retailer provides for the N offset and adds the cost to the price of the product), individual persons (e.g., if N offset were possible to purchase on the internet, similar to the possibility today to purchase C offsets), companies, or countries.

Figure 7. N footprint of (a) and N intake at (b) the 6th International Nitrogen Conference (N2013, after Leip et al 2014).
Download figure:
Standard image High-resolution image4.5. N-Loss indicator
The N-Loss indicator shows the reactive nitrogen losses for different regions of the world as a result of the production and consumption of food and the use of energy (e.g., for electricity production, industry and transport) for an entire country, and is expressed as the reactive nitrogen loss per capita per year, without making a distinction between losses to air, soil and water. While the N-Calculator tool shows the loss of nitrogen due to consumption by individuals (table 1), this N-Loss indicator shows the loss due to production and consumption in a country. This calculated loss is a surrogate measure of potential reactive nitrogen pollution; the actual pollution depends on environmental factors and the extent to which the waste flows at production and consumption of food and energy are being reused. Figure 8 shows an example of the indicator for different regions in the world. These results for the different regions are averages for the underlying countries, for which separate calculations have been performed.

Figure 8. Average loss of reactive nitrogen per inhabitant in 2008.
Download figure:
Standard image High-resolution image
The graph shows that in 2008 the global production and consumption of food and energy results in an average reactive nitrogen loss of 28 kg of nitrogen per inhabitant per year. Of the total loss, 5 kg is the result of energy use, 18 kg is from food production (agriculture), 1 kg due to food processing and 4 kg is released during food consumption. The European reactive nitrogen loss per person is about 10 kg higher than the global average loss and is almost half of that in North America, but twice as high as in Africa. The energy component is relatively large in industrialized countries, while the contribution of food production and consumption is large in countries with an extensive livestock sector and high levels of meat consumption.
This N-loss indicator is also used in the context of the Convention on Biological Diversity and is included in their list indicators related to the Aichi Target 8 ('By 2020, pollution, including from excess nutrients, has been brought to levels that are not detrimental to ecosystem function and biodiversity'). In the context of the CBD Target 8 this indicator is called: loss of reactive nitrogen to the environment. Additional material on this indicator, including calculation details, is available via: http://www.bipindicators.net/nitrogenloss and Bleeker et al 2013.
5. Use of the tools to reduce N pollution
The current understanding of N issues by consumers and policy makers is poor and incomplete. People are educated with the positive aspects of N: providing food and help combatting hunger. However, through the increase in its use and the decreasing nitrogen use efficiency, major environmental impacts have been observed (e.g. Erisman et al 2013). Therefore, raising awareness is essential and tools to understand the personal or institutional pressure on the environment through nitrogen losses are needed. The variants of nitrogen footprint tools reviewed in this paper have a variety of applications. Common for all is the ability to provide an entity with information regarding how its use of food and energy resources contributes in general to N losses to the environment. The tools can be ascribed to the targeted user entity, the potential uses, the information they provide, their level of abstraction, whether they have the capability of scenario development, the potential for direct N offset calculations, and the degree to which they could contribute to the reduction of N losses to the environment (table 2).
Table 2. Five nitrogen footprint tools and their potential uses.
| Footprint tool | Potential uses | Abstraction level | Target entity | Information provided | Alternative scenario | Direct N offset | Possible actions |
|---|---|---|---|---|---|---|---|
| N-Calculator for consumers in different countries |
|
National average N footprint values | Individual person |
|
|
No | Food choices and amount, and energy saving |
| N-Institution for schools, businesses, etc |
|
Institutions | Universities, schools, businesses |
|
|
No | For schools, food choices offered to students/staff, choices of food suppliers, choices of energy suppliers, implementation of energy saving measures; development of educational material. |
| N-Neutrality |
|
Regional specific or product specific N footprint values if available | Any entity (so far implemented for events) |
|
|
Yes | Choices on food type and food supplier, waste reduction; choices on energy supplier; energy saving |
| N-Labelfor consumers |
|
Product-specific footprint values if available | Individual product |
|
|
No | Choice of food products |
| N-Indicator for countries |
|
National average N footprint values | Country or region |
|
No | No | Infrastructure such as waste water treatment; measures to increase farm & industry NUE; measures towards a circular economy; information of the citizens; |
| N-Calculator for countries | Provides countries a detailed account of N releases as a result of the production and consumption of food and the use of energy. | Per capita N footprint values | Country or region | Absolute | Yes | No | Infrastructure such as waste water treatment; measures to increase farm & industry NUE; measures towards a circular economy; information of the citizens; |
The tools are designed for entities that range from the consumer (N-Calculator, N-Label), institutions (N-Institutions), activities (N-Neutrality) and countries (N-Indicator, N-Calculator) and can be used by consumers, businesspeople or politicians. With the exception of N-Indicator, all the tools provide the user with information to (1) calculate their N footprint, (2) run scenarios as to which actions would be the most effective in decreasing the N footprint, and (3) make decisions on how to decrease the magnitude of the footprint. Only one tool, N-Neutrality, goes the next step by providing the basis for calculations on how offsets can decrease the total N lost to the environment. Most of the tools adopt a bottom-up approach beginning with the consumer/institution/activity and then estimating the N footprint associated with the use of food and energy resources. Such tools provide opportunities to engage the consumer in decision making with respect to resource use, especially if presented in the context of social-economic sciences.
6. Conclusions
Anthropogenic Nr creation on a per-capita basis has increased from ∼12 kg N capita−1 yr−1 to ∼30 kg N capita−1 yr−1 over the period 1850–2010. This increase, coupled with a growing global population, has resulted in a situation where humans now create three-fold more Nr than do natural terrestrial processes. In response to this extreme perturbation of the N-cycle a number of N footprint tools have been developed to provide information to consumers, institutions and governments about their contribution to the N cycle perturbation and resulting impacts. The data generated by the tools provide the foundation of possible actions by these entities to manage their use of resources including choices of what and how much to eat, type of energy to use, and the option for obtaining offsets for their contributions to N pollution. An important attribute of the tools is that most of them actively engage the consumer in decision making on N-related issues. This is vitally important, for without consumer involvement, the opportunities to reverse the trend of ever-increasing amounts of Nr formation will be severely limited.
Acknowledgments
We are grateful to all who have helped develop the concept of nitrogen footprints with special note to Nour Alamiri, Lia Cattaneo, Claudia Cordovil, Vitoria Gonçalves, Andrew Greene, Olivia Hutton, Richard Kohn, Ariel Majidi, Magdalena Pierer, Hideaki Shibata, and Carly Stevens. We appreciate the financial support from the Agouron Foundation, the US EPA, and The Organic Center. This is a contribution to the EU-funded project ECLAIRE, and to the International Nitrogen Initiative.