
Abstract
We use high quality climate data from ground meteorological stations in the Iberian Peninsula (IP) and robust drought indices to confirm that drought severity has increased in the past five decades, as a consequence of greater atmospheric evaporative demand resulting from temperature rise. Increased drought severity is independent of the model used to quantify the reference evapotranspiration. We have also focused on drought impacts to drought-sensitive systems, such as river discharge, by analyzing streamflow data for 287 rivers in the IP, and found that hydrological drought frequency and severity have also increased in the past five decades in natural, regulated and highly regulated basins. Recent positive trend in the atmospheric water demand has had a direct influence on the temporal evolution of streamflows, clearly identified during the warm season, in which higher evapotranspiration rates are recorded. This pattern of increase in evaporative demand and greater drought severity is probably applicable to other semiarid regions of the world, including other Mediterranean areas, the Sahel, southern Australia and South Africa, and can be expected to increasingly compromise water supplies and cause political, social and economic tensions among regions in the near future.
Export citation and abstract BibTeX RIS

Content from this work may be used under the terms of the Creative Commons Attribution 3.0 licence. Any further distribution of this work must maintain attribution to the author(s) and the title of the work, journal citation and DOI.
1. Introduction
The consequences of recent global temperature rise for drought severity are not well understood. An increase in the water pressure deficit driven by higher temperatures is expected to increase atmospheric evaporative demand (Wang et al 2012), resulting in more frequent and severe droughts (Dai 2011). However, problems in drought quantification (Redmond 2002) and data uncertainty (Trenberth et al 2014) make it difficult to determine changes in drought severity and to correlate these with climate drivers. This has promoted intense scientific debate (Sheffield et al 2012, Dai 2013, van der Schrier et al 2013), and resulted in low confidence in drought trends worldwide (Seneviratne et al 2012). The hypothesis that there will be an increase in the severity of climate-driven droughts as a consequence of temperature-enhanced atmospheric evaporative demand appears reasonable (Breshears et al 2005, Teuling et al 2013). The expected consequences include enhanced biological stress (Williams et al 2013, Peng et al 2011, Carnicer et al 2011) and reduced soil water content, runoff generation, stream flow and groundwater recharge (Cai and Cowan 2008, Cho et al 2011). Nevertheless, the relationship between climate warming and increased evapotranspiration is the subject of large scientific debate. Several studies have shown no effect of temperature increase on drought through increased evaporation, as other meteorological variables that affect the evaporative demand of the atmosphere may compensate for the temperature increase (McVicar et al 2012, Roderick et al 2008), and potential evaporation may in fact have decreased in recent decades (Roderick et al 2008).
Recent studies analyzing the impact of temperature rise on drought severity worldwide have reported variable, if not contradictory, results (Sheffield et al 2012, Dai 2013). These studies have been based on drought indices obtained from low resolution gridded climate data. However, climate data for some variables including precipitation, wind speed, incoming solar radiation and relative humidity are subject to substantial uncertainty at the global scale, because of the scarcity of high quality long-term ground measuring stations and other problems. Uncertainties in global drought severity estimates due to different methods of estimating the evaporative demand of the atmosphere and hence the evolution of drought severity must also be taken into account when assessing drought trends (Sheffield et al 2012). Such uncertainties prevent definitive conclusions to be made, as noted in a recent IPCC report (Seneviratne et al 2012). Consequently, there is a pressing need to undertake studies on the effect of temperature rise on drought severity, to reduce data uncertainties, and to expand monitoring of drought impacts to assess possible increases in drought severity. This is especially so in regions characterized by structural water deficits, as these may be most affected by changes in drought frequency and severity. A case in point is the Iberian Peninsula (IP), which is characterized by scarce and highly variable precipitation and recurrent drought episodes, and where drought impacts might be compounding because of years of unprecedented low precipitation (Hoerling et al 2012). The availability of an effective and dense network of ground meteorological stations measuring a wide range of climatic and hydrologic variables makes the IP highly suitable for testing whether temperature rise is increasing drought severity.
2. Methods
We used complete record sets for the period 1 January 1961 to 31 December 2011, from first-order meteorological stations across the IP; these stations are maintained by professional weather observers of the Spanish and Portuguese meteorological agencies (www.aemet.es; www.ipma.pt/). Following processing of the available information we chose 54 meteorological stations (see supplementary table 1 and supplementary figure 1 available at stacks.iop.org/ERL/9/044001/mmedia) covering the entire IP. For these stations we were able to obtain complete, homogenized and quality controlled series of the variables precipitation, maximum and minimum temperature, relative humidity, surface pressure, wind speed and sunlight hours. Details of the processing and homogenization of the data series for Spain have been published previously (Vicente-Serrano et al 2014a, Azorin-Molina et al 2014, Sanchez-Lorenzo et al 2007, González-Hidalgo et al 2011). The series for Portugal were analyzed specifically for this study, and were quality controlled and homogenized following the same approach. The reference evapotranspiration (ET0) was calculated according to the Food and Agricultural Organization (FAO) Penman–Monteith equation (Allen et al 1998). ET0 was also calculated using methods that require a fewer number of variables (see supplementary material available at stacks.iop.org/ERL/9/044001/mmedia). Quality controlled and homogenized series of evaporation in Spain were also used, based on pan (since 1984) and Piché (since 1966) evaporimeters (Sanchez-Lorenzo et al 2014). Monthly streamflow data from 1460 gauging stations were obtained from water agencies in Spain (Centro de Estudios Hidrográficos, Agència Catalana de l'Aigua, Agencia Andaluza del Agua and Augas de Galicia) and Portugal (Sistema Nacional de Informaçâo de Recursos Hídricos). A total of 287 stations having few data gaps from 1961 to 2009 were selected (supplementary figure 2 available at stacks.iop.org/ERL/9/044001/mmedia), and streamflow data were quality controlled for possible inhomogeneities not caused by human regulation (Lorenzo-Lacruz et al 2012).
To quantify droughts we used the standardized precipitation index (SPI) (McKee et al 1993), which is based on long-term precipitation data, and the standardized precipitation evapotranspiration index (SPEI) (Vicente-Serrano et al 2010), which is based on the difference between precipitation and reference evapotranspiration (ET0; see supplementary materials available at stacks.iop.org/ERL/9/044001/mmedia). The 12-month SPI and SPEI were calculated for each meteorological station. A regional series for the entire IP was obtained by means of a weighting average, using as a weight the surface represented by each station by means of the Thiessen polygons method. The weights were used to determine the surface area affected by drought in each month (<10% of probability; SPI and SPEI < − 1.28). The magnitude of change in the drought indices was assessed using the slope of the regressions of the SPEI and the SPI series with time.
The monthly precipitation and ET0 series were interpolated to a 5 km × 5 km grid using an inverse distance-weighting algorithm. Using a digital elevation model for the entire IP we computed the drainage basin for each streamflow station using the archydro tool in ArcGis© software. The basins were classified as natural, regulated and highly regulated (supplementary figure 3 available at stacks.iop.org/ERL/9/044001/mmedia), based on the impoundment ratio for each station (Lorenzo-Lacruz et al 2012) (the ratio of the cumulative reservoir capacity upstream of the gauge to the mean annual runoff measured by the gauge). Series of monthly total precipitation and ET0 for each basin were obtained from the 5 km × 5 km grids. The statistical significance of the trends in annual precipitation, streamflow and ET0 were assessed using the Kendall tau rank correlation coefficient. Relationships among the time series were assessed using the Pearson's r correlation coefficient.
A streamflow drought index (the standardized streamflow index, SSI) (Vicente-Serrano et al 2012a) comparable in time and space, and across very different river regimes, was calculated for each gauging station for the period 1961–2009, and correlated monthly (Pearson's r) with the series of the SPEI and the SPI corresponding to each basin. The SPEI and the SPI were determined for various time scales (1–24 months; supplementary figure 4 available at stacks.iop.org/ERL/9/044001/mmedia), and were included in the analysis to take account of the time lags between climate and the hydrological variables.
3. Results
There is substantial agreement between the SPI and the SPEI time series for the entire IP (figure 1(A)). Major drought episodes in the IP were recorded in 1981, 1995, 2000 and 2005, and both indices indicated increased drought severity (i.e. trends towards more negative values) between 1961 and 2011, and the surface area affected by drought increased over the same time period (figure 1(B)). Nevertheless, in the last two decades the SPEI has indicated the occurrence of more intense drought events relative to the SPI (figure 1(C)). This pattern is independent of the ET0 method used to calculate the SPEI (supplementary material; figures 5–10 available at stacks.iop.org/ERL/9/044001/mmedia).

Figure 1. (A) Evolution of the regional standardized precipitation index (SPI) (blue columns) and the standardized precipitation evapotranspiration index (SPEI) (black line) for the Iberian Peninsula from 1961 to 2011. The SPEI was obtained using the Penman–Monteith equation, and used to calculate ET0. (B) Percentage of surface area affected by drought from 1961 to 2011, based on the SPI (blue) and the SPEI (red). The surface area affected was selected based on a SPI/SPEI threshold of −1.28, which corresponds to 10% of the events according to the probability distribution function. (C) Difference between the SPEI and the SPI with respect to the surface area affected by drought. A linear fit is included.
Download figure:
Standard image High-resolution imageSpatially, the evolution of the SPI across the IP predominantly decreased (more drought), although the data from eight stations show a different trend (figure 2(A)). Nevertheless, the SPEI showed a greater decrease than the SPI across the entire IP, except for Lisbon (figure 2(B)). Trends in monthly differences between the two indices (SPEI–SPI) showed a dominant negative trend (mainly in the inner IP but also in the southeast; figure 2(C)), which is consistent with the SPEI calculated using other ET0 approaches (supplementary figures 11–16 available at stacks.iop.org/ERL/9/044001/mmedia). Thus, drought severity increased over the IP according to both indices, but the increase was greater based on the SPEI, which includes the effect of ET0. The main factor determining the ET0 increase in the IP is a pronounced decrease in relative humidity, driven by a decreased supply of moisture, and increased atmospheric water holding capacity because of higher temperatures throughout the year, but mainly in summer (Vicente-Serrano et al 2014a). The effect of these two variables combined has not been counteracted by a slight decrease in wind speed and stable radiative forcing (Vicente-Serrano et al 2014b) (supplementary figures 17–20; table 2 available at stacks.iop.org/ERL/9/044001/mmedia). Differences in the magnitude of change in the SPEI obtained by means of different ET0 cluster around 0 at the majority of the meteorological stations; even the Penman–Monteith ET0-based SPEI shows a greater decrease than the ET0 temperature-based methods. The evidence of increasing evaporative demand is supported by the trends in potential evaporation in Spain, measured directly using pan and Piché evaporimeters (supplementary figure 21 available at stacks.iop.org/ERL/9/044001/mmedia). Both measurements show an increase of around 18mmdecade−1 in summer (May–August) potential evaporation (since the 1980s and the 1960s for the pan and Piché evaporimeters, respectively).
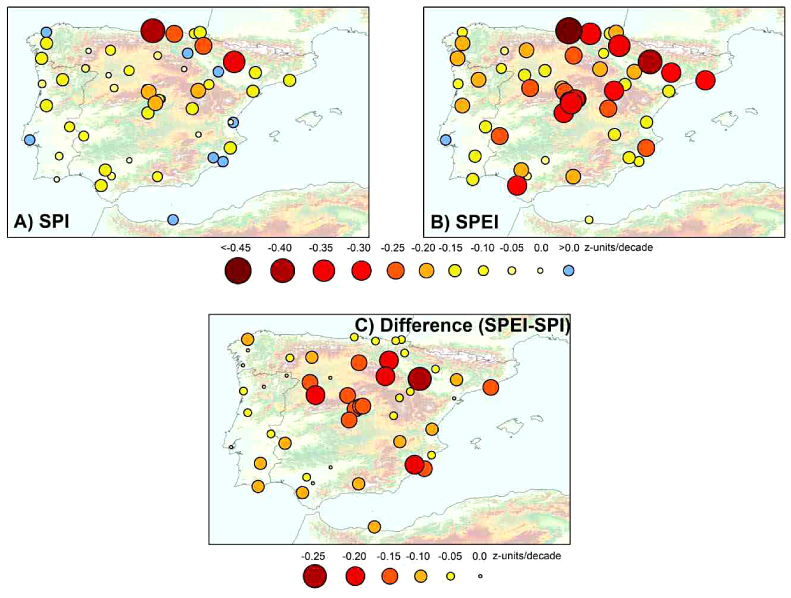
Figure 2. (A) Changes in the SPI (z-units per decade) at each of the 54 stations for the period 1961–2011. (B) As in figure 2(A), but for the SPEI. (C) Changes in the monthly difference between the SPEI and the SPI (z-units per decade) at each of the 54 stations for the period 1961–2011. The changes were estimated using least squares regression, with the series of time as the independent variable.
Download figure:
Standard image High-resolution imageIncreased climate drought severity should be evident in increased impacts on systems sensitive to drought, including soil moisture, crops, streamflow and natural vegetation. We analyzed long series of streamflow data from a dense network of river gauges in the IP, and found significant downward trends (− 9.0 km3 decade−1; p < 0.01) in streamflow measured at the mouths of major IP rivers (supplementary figure 22 available at stacks.iop.org/ERL/9/044001/mmedia) from 1961 to 2009 (figure 3(A)). There was a strong correlation (r = 0.85; p < 0.01) between the time series for streamflow and the observed decrease in precipitation (− 10.2 km3 decade−1; figure 3(B)). Nevertheless, the runoff coefficient (the proportion between annual precipitation and annual streamflow) showed a significant decrease (figure 3(C)), implying that streamflow decreased more than precipitation. This coincides with a marked increase in ET0 (10.1 km3 decade−1;figure 3(D)), suggesting that increased evaporative demand by the atmosphere may be contributing to the reduction in streamflow. This general pattern was observed at the 284 gauging stations available throughout the IP (figure 4). As streamflows have been markedly affected by river regulation during the last five decades (García-Ruiz et al 2011), some perturbation in the streamflow response to drought variability may have contributed to the observed trends. However, we found that this pattern was independent of the level of river regulation (figure 5). Thus, in the 110 natural (non-regulated) rivers the evolution of the runoff coefficient showed a significant decrease (p < 0.01) consistent with increased ET0. The decrease in the runoff coefficient was more acute in regulated and highly regulated rivers, which was not unexpected given that large reservoirs in the basins favor direct evaporation. In addition, these basins are associated with large irrigated areas that favor actual evapotranspiration under increased ET0.
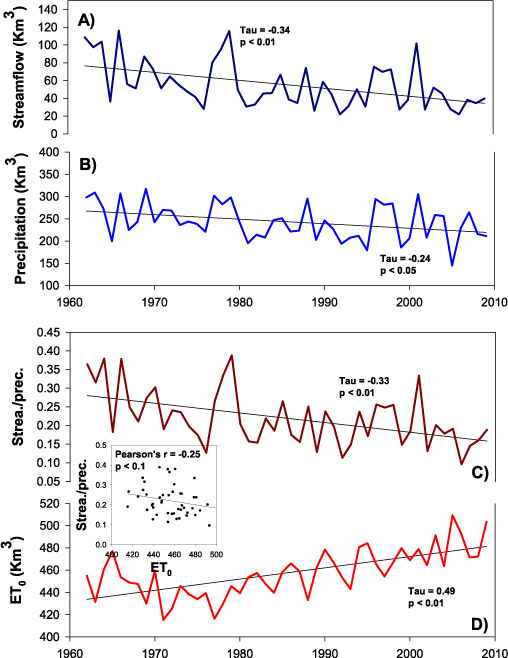
Figure 3. Evolution of parameters in the main hydrological basins of the Iberian Peninsula (see supplementary figure 22 available at stacks.iop.org/ERL/9/044001/mmedia), including: (A) total annual (September–August) streamflow at the outflow (blue line); (B) precipitation (dark blue line); (C) runoff coefficient (ratio between precipitation and streamflow; brown line); and (D) ET0 (red line). The scatterplot (inset) shows the relationship between annual ET0 and the annual streamflow/precipitation ratio.
Download figure:
Standard image High-resolution image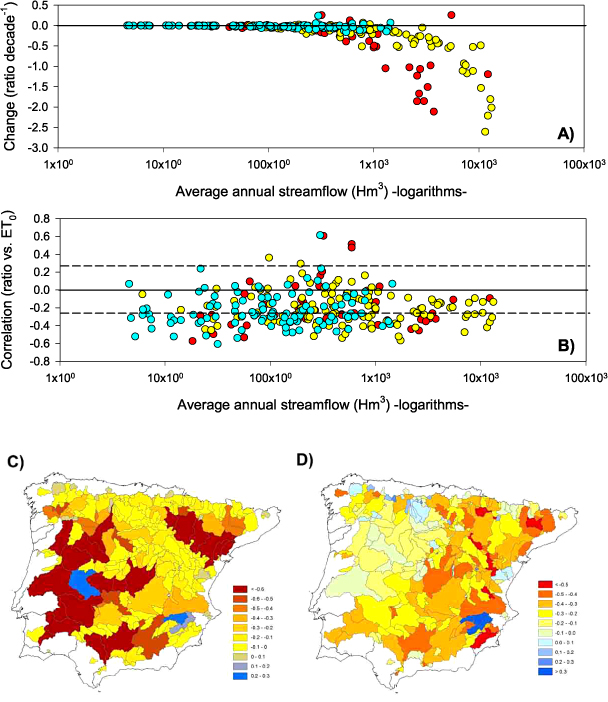
Figure 4. (A) Magnitude of change in the streamflow/precipitation ratio for each of the 287 gauging stations used in the study. Blue: natural basins; yellow: regulated basins; red: highly regulated basins. (B) Pearson's r correlation between the annual series of the streamflow/precipitation ratio and the annual ET0 for each of the 287 gauging stations used in the study. Blue: natural basins; yellow: regulated basins; red: highly regulated basins. Dotted lines indicate the limit for significant correlations (p < 0.1). (C) Spatial distribution in the magnitude of change in the streamflow/precipitation ratio, 1961–2009. (D) Spatial distribution of the Pearson's r correlation between the annual series of the streamflow/precipitation ratio and the annual ET0.
Download figure:
Standard image High-resolution image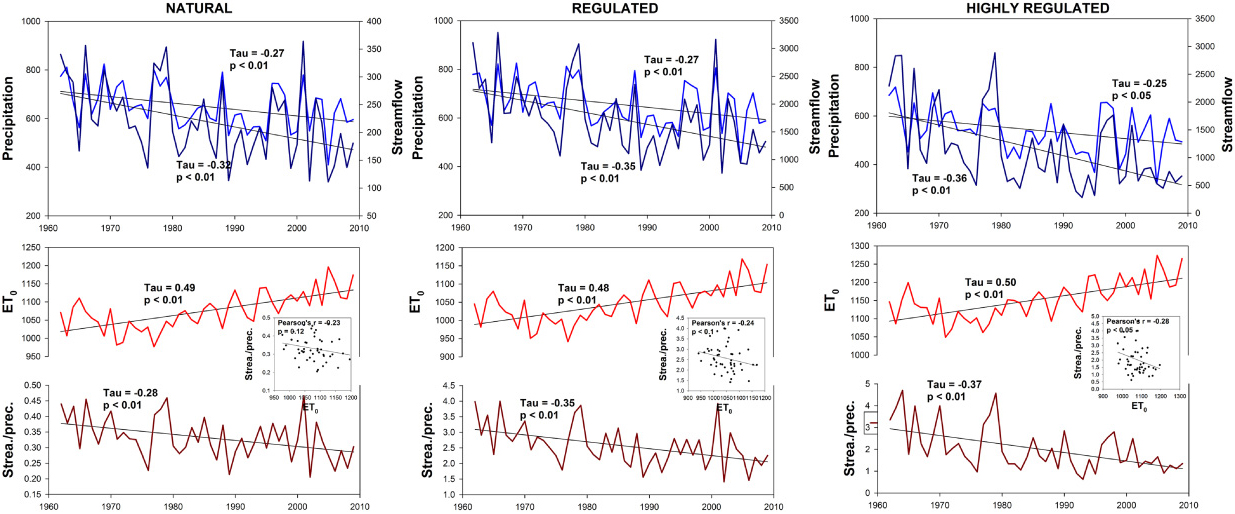
Figure 5. Evolution of the total annual (September–August) precipitation (dark blue), streamflow at the outlet (blue), ET0 (red), and ratio between precipitation and streamflow (dark red) (in km3) for the natural, regulated and highly regulated basins (see supplementary figure 27 available at stacks.iop.org/ERL/9/044001/mmedia). The scatterplots (inset) show the relationship between annual ET0 and the annual streamflow/precipitation ratio for each type of basin.
Download figure:
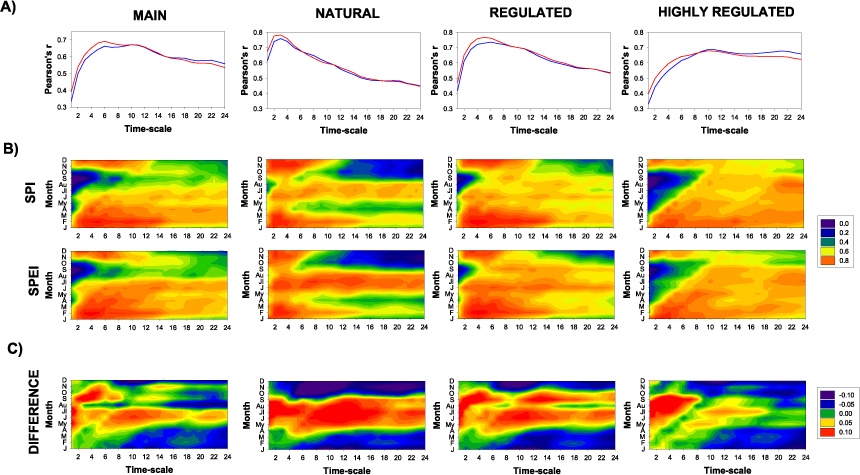
Standard image High-resolution imageAnalysis of the correlations among the SPI, SPEI and SSI for the main IP rivers showed there were stronger correlations between the SSI and the SPEI than between the SSI and the SPI. Streamflow droughts increased in magnitude and duration since 1961, mainly in natural and regulated basins (supplementary figure 23 available at stacks.iop.org/ERL/9/044001/mmedia). Thus, the percent area affected by hydrological droughts increased after 1961 (supplementary figure 24 available at stacks.iop.org/ERL/9/044001/mmedia), consistent with the observed increase in climatic droughts. The relationship between hydrological and climatic droughts is complex, because of temporal lags between climate and hydrologic variables that vary as a function of factors including river basin features and water regulation (López-Moreno et al 2013, Skøien et al 2003). Temporal lags between climate signals and drought can be simulated using time scales in computation of the SPI and the SPEI. Thus, streamflow droughts at the mouth of the main IP rivers were most strongly correlated with the SPEI at the 6-month time scale (figure 6(A)), which implies that precipitation and ET0 in the previous six months determined streamflow variability. The correlation was slightly higher with the SPEI (r = 0.69) than the SPI (r = 0.66), but there are seasonal differences (figure 6(B)), with the highest correlations in winter and spring and the lowest in summer, probably because reservoir releases affect summer streamflow variability (Lorenzo-Lacruz et al 2012). For the late spring and early summer period (April–June), differences in correlation between the SSI and the SPEI and between the SSI and the SPI in the main IP rivers suggest an influence of ET0 on streamflow drought variability (figure 6(C)). Moreover, water regulation clearly masks a greater response of the SSI to the SPEI than to the SPI in the main river basins of the IP, as the correlations show that the SPEI more accurately than the SPI explains the temporal variability of the SSI in natural basins and in summer months, when the ET0 rates are higher. The same pattern occurs in regulated and highly regulated rivers, although the correlation decreases with regulation, especially in summer when outflows from reservoirs are greater because of the need to meet irrigation and urban demands. Consequently, for the majority of rivers the correlation between the SSI and the SPEI is higher than between the SSI and the SPI (supplementary figure 25 available at stacks.iop.org/ERL/9/044001/mmedia).
Figure 6. Climate index correlations for the main IP basins (supplementary figure 18 available at stacks.iop.org/ERL/9/044001/mmedia), and in natural, regulated and highly regulated basins. (A) Correlations of the regional SSI to the SPI and the SPEI at time scales of 1–24 months. Red: correlation between the SPEI and the SSI. Blue: correlation between the SPI and the SSI. (B) Monthly correlations of the SSI to the SPI and the SPEI at time scales of 1–24 months. (C) Differences in correlations between the SPEI and the SSI, and between the SPI and the SSI.
Download figure:
Standard image High-resolution image
4. Conclusions
Here we show that in recent decades higher atmospheric evaporative demand increased the severity of climatic droughts, and contributed to the decrease in surface water resources in the IP. This region has been subject to an increase in aridity caused by a significant rise in temperature (1.5 °C annually; 2.1 °C in summer) coupled with a decline in precipitation (15.6%) in the last five decades. Although drought variability has mainly been controlled by precipitation, drought severity has been exacerbated by greater evaporative demand by the atmosphere, which increased by 7.3% annually and 10.4% in summer in the period 1961–2011; this shows that the SPEI has indicated increased drought severity relative to the SPI. These results are affected to a very limited extent by uncertainties related to the forcing data, as quality controlled and carefully homogenized station data were used. Although the spatial scale of this study was regional and not directly comparable to global studies (Sheffield et al 2012, Dai 2013, van der Schrier et al 2013), the observed climate trends from 1961 to 2011 are equivalent to the expected evolution in the Mediterranean region by 2050, based on current climate change models under the A1B scenario (Giorgi and Lionello 2008). Thus, these climate models consistently project trends of greater warming and drying for the IP, and consequently drought severity and water scarcity are likely to increase in coming decades (Estrela et al 2012). It is expected that the cumulative dryness between 1961 and 2050 will produce an increase in the frequency and severity of drought events in the near future (Lehner et al 2006).
Although isolating the effects of warming on streamflow is difficult because of the substantial human influence on river basins, we have empirical evidence that more extreme hydrological droughts may be favored by higher ET0, confirmed through observation of both natural and regulated basins. In addition, proxy indicators point to increasing drought severity as a consequence of temperature rise, with natural systems that depend on soil water showing decreased vegetation cover (Vicente-Serrano et al 2012b) and reduced forest growth (Carnicer et al 2011), mainly in arid areas. Plant species in these areas are acclimated to frequent precipitation droughts, but increased temperature and ET0 are introducing a new source of soil moisture stress that is probably the explanation for the increased ecological impacts and the reduction in available water resources. Based on temperature projections for the mid-21st century in southern Europe, the vulnerability of hydrological systems to drought will probably increase, and adjustments to the demand and management of increasingly scarce water resources will be necessary to enable adaptation to future drought events (García-Ruiz et al 2011).
Acknowledgments
We would like to thank the Spanish Meteorological State Agency (AEMET), Instituto Português do Mar e da Atmosfera, Centro de Estudios Hidrográficos, Agència Catalana de l'Aigua, Agencia Andaluza del Agua, Augas de Galicia and the Sistema Nacional de Informaçâo de Recursos Hídricos of Portugal for providing the databases used in this study. This work has been supported by research projects CGL2011-27574-CO2-02, CGL2011-27536 and CGL2011–24185 financed by the Spanish Commission of Science and Technology and FEDER, 'Demonstration and validation of innovative methodology for regional climate change adaptation in the Mediterranean area (LIFE MEDACC)' financed by the LIFE programme of the European Commission, CTTP1/12, financed by the Comunidad de Trabajo de los Pirineos, and QSECA (PTDC/AAG-GLO/4155/2012) funded by the Portuguese Foundation for Science and Technology (FCT). ASL was supported by a postdoctoral fellowship from the Catalan Government (2011 BP-B 00078) and CAM was supported by a Juan de la Cierva fellowship by the Spanish Government.