
Abstract
Nitrogen fertilizer use across the world's croplands enables high-yielding agricultural production, but does so at considerable environmental cost. Imbalances between nitrogen applied and nitrogen used by crops contributes to excess nitrogen in the environment, with negative consequences for water quality, air quality, and climate change. Here we utilize crop input-yield models to investigate how to minimize nitrogen application while achieving crop production targets. We construct a tradeoff frontier that estimates the minimum nitrogen fertilizer needed to produce a range of maize, wheat, and rice production levels. Additionally, we explore potential environmental consequences by calculating excess nitrogen along the frontier using a soil surface nitrogen balance model. We find considerable opportunity to achieve greater production and decrease both nitrogen application and post-harvest excess nitrogen. Our results suggest that current (circa 2000) levels of cereal production could be achieved with ∼50% less nitrogen application and ∼60% less excess nitrogen. If current global nitrogen application were held constant but spatially redistributed, production could increase ∼30%. If current excess nitrogen were held constant, production could increase ∼40%. Efficient spatial patterns of nitrogen use on the frontier involve substantial reductions in many high-use areas and moderate increases in many low-use areas. Such changes may be difficult to achieve in practice due to infrastructure, economic, or political constraints. Increases in agronomic efficiency would expand the frontier to allow greater production and environmental gains.
Export citation and abstract BibTeX RIS

Content from this work may be used under the terms of the Creative Commons Attribution 3.0 licence. Any further distribution of this work must maintain attribution to the author(s) and the title of the work, journal citation and DOI.
1. Introduction
Improving nitrogen (N) management across global croplands is crucial to increasing agricultural productivity and human well-being [1–7]. Ammonia synthesis from the Haber–Bosch process allowed a dramatic acceleration of reactive nitrogen (Nr) use for agriculture during the latter half of the 20th century. While this technology has enabled large increases in food production on existing croplands, it has also come at substantial costs to ecosystem and human health.
Excess reactive nitrogen (hereafter referred to as excess nitrogen) in the form of nitrate readily leaches into waterways. Nitrate can contaminate groundwater and contributes to eutrophication of surface waters, decreasing water clarity as well as fish abundance [1, 2, 5, 6, 8, 9]. Nitrous oxide (N2O), released from agricultural soils through nitrification and denitrification, is a powerful greenhouse gas that also depletes stratospheric ozone [5, 10–12]. Volatilizing ammonia and nitric oxide (NO) emissions from agricultural soils can negatively impact regional air quality. Excess nitrogen can also acidify soil [13], and atmospheric deposition of reactive nitrogen can negatively impact terrestrial biodiversity [5]. The Haber–Bosch process itself also has substantial environmental impacts; the process consumes ∼2% of global energy [5].
The nonlinear response of crop yields to nitrogen application rates affords an opportunity to improve crop yields while greatly reducing environmental pollution from excess nitrogen application. Crop yield response to nitrogen is relatively steep at low application rates and shallow to flat at high application rates [4, 14]. Imbalances between nitrogen applied and the ability of crops to utilize nitrogen leads to extreme amounts of excess nitrogen in some areas and nitrogen deficits in others [3, 15, 16]. Efforts to balance patterns of nitrogen surplus and deficit could reduce post-harvest nitrogen losses and can have the additional benefit of improving net production outcomes. For example, reduction of nitrogen use in parts of the People's Republic of China would have little or no impact on crop yields [17, 18]. In the European Union, it is estimated that current wheat nitrogen application rates are approximately 50 kg ha−1 higher than what would be socially optimal, given both the costs and the benefits of nitrogen application [19]. Elsewhere, cropping systems in some developing countries suffer from too-little nitrogen use, which may have detrimental long-term effects on soil quality and yields [5, 20]. In areas of low nutrient application—places at the 'steep' end of the nitrogen-yield curve—small increases in fertilizer use can help prevent mining of soil nutrients while dramatically increasing yields [5, 21–23].
Opportunities to simultaneously increase food production and minimize environmental harm can be mapped using a 'tradeoff frontier' that describes the minimum level of applied nitrogen necessary to achieve various crop production levels. Tradeoff frontiers are a useful framework for determining potential win-win scenarios between endpoints seemingly in conflict [e.g. 24, 25].
Here we provide a first estimate of the tradeoff frontier for global nitrogen fertilizer use and production of three major cereals: maize, wheat, and rice. In this analysis, we assume other nutrients and management practices are not limiting, and we utilize agronomic efficiencies (i.e. crop production realized for a given application rate) implicit in a suite of crop- and climate-specific nitrogen-yield curves parameterized using circa 2000 datasets [4]. We additionally explore potential environmental consequences by calculating excess nitrogen using a soil surface nutrient balance model for each point along the frontier.
2. Methods
2.1. Building the nitrogen consumption-production tradeoff frontier
Mueller et al [4] estimated Mitscherlich–Baule (M–B) nitrogen-yield curves and rainfed maximum yields for crop-specific climate zones (100 zones per crop). These curves were parameterized using global data on crop areas and yields [26], fertilizer application [4], irrigated area [27], and climate [28]. Additional bootstrap analyses are performed to provide a 95% CI on the M–B nitrogen response coefficients. We utilize 1000 bootstrap samples per climate zone per crop, and sampling of grid cells is performed in proportion to harvested area. We note that the bootstrapping does not account for spatial autocorrelation, and thus may underestimate uncertainty. Some crop-climate zone combinations in the Mueller et al [4] model lack a unique nitrogen response coefficient; this occurred when adding nitrogen as an explanatory variable did not minimize root-mean square error of the model fit (for example, nitrogen can have weak explanatory power in cases where yields are primarily limited by irrigation or other fertilizer nutrients). In these climate zones the model utilizes average M–B response coefficients across all climates (and upper and lower bound response coefficients from the bootstrapping results) in conjunction with climate-specific minimum and maximum yields to estimate an expected nitrogen-yield response.
Using the crop- and climate-specific nitrogen response curves, we build a tradeoff frontier relating total global production to total global nitrogen fertilizer use. To do this, for each crop we find levels of nitrogen application across all climate zones for each crop that give the same marginal yield response (dY/dN), which simulates maximum production for a total amount of nitrogen. We use 30 dY/dN values from 0.0001 to 2 Mg yield kg−1 N. This exercise results in a series of crop-specific production and nitrogen application maps (simulated at 5 arc min × 5 arc min resolution) for every point on the tradeoff frontier, which are then summed across the globe (using fixed crop areas [26]) to determine total global production and nitrogen consumption per crop. Maximum yields differ between irrigated and rainfed systems, and expansion of irrigation may not be feasible in areas with limited water supplies. Thus, similar calculations are made for a scenario with no changes to irrigated areas, where nitrogen application rate increases stop on rainfed areas when yields reach the rainfed yield ceilings of Mueller et al [4]. These frontier calculations assume other inputs or management practices (e.g. phosphorus and potassium application, cultivar choice, etc) are not limiting yields. Organic and biologically-derived nitrogen sources are not included as drivers of production due to data limitations (see section 4.4), although they can be important sources of fertility.
To aggregate tradeoff frontiers across multiple crops, we keep the observed proportion of nitrogen allocation between crops (circa 2000) fixed, and then add up modeled production at different levels of total nitrogen use. Spline interpolation in MATLAB was used to interpolate between points on the crop-specific curves in order to construct the aggregate curve. Finally, we overlay 1997–2003 nitrogen consumption by crop [4] and 1997–2003 cereal production [26] to assess the current nitrogen use and production situation relative to the modeled frontier. All calculations are performed over the ∼95% of crop harvested area [26] encompassed by the crop-specific climate zones.
2.2. Soil surface nitrogen balances
Nitrogen balance calculations are carried out using the approach of Foley et al [3], which builds on earlier nutrient balance work for both nitrogen [16, 29] and phosphorus [30]. This method tracks all of the nitrogen inputs (fertilizer [4], manure [31], atmospheric deposition [32], and legume fixation [3]) and outputs (removal of nitrogen in harvested material) spatially for each grid cell. We modify the approach of Foley et al [3] to assess crop-specific nitrogen balances by distributing manure nitrogen between the crops within each grid cell in proportion to the harvested area of each crop. Legume fixation rates are not included, as we only examine cereal crops in this study.
As we build the nitrogen consumption and production frontier, we generate a new nitrogen application rate map and a new yield map for each crop at each point on the curve. These maps are used as inputs to the nitrogen balance model to generate a map of excess nitrogen at every point, which is summed to create the excess nitrogen and production tradeoff frontier.
3. Results
Across major cereals, we find large inefficiencies in the current (circa 2000) distribution of nitrogen use and crop production. These inefficiencies are illustrated graphically as the distance between the current state and the tradeoff frontiers in figure 1 and online figures S1–S3 available at stacks.iop.org/ERL/9/054002/mmedia. Specifically, we find that production could be held constant and nitrogen use could drop approximately 48% (lower- and upper-bound results with 95% CIs on nitrogen response coefficients: 37–55%). Alternatively, nitrogen use could be held constant and global production of major cereals could increase approximately 28% (20–34%) via changes in the geographic intensity of nitrogen use (and associated changes in correlated management practices). Assuming no expansion of irrigated area lowers production potential at high nitrogen consumption values (figure 1).
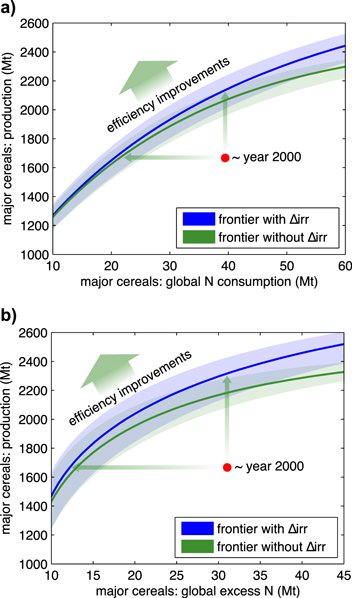
Figure 1. Global-scale tradeoff frontiers for (a) major cereal production and fertilizer nitrogen consumption and (b) major cereal production and excess nitrogen as defined by a soil surface nitrogen balance model. Excess nitrogen considers manure application and atmospheric deposition in addition to fertilizer nitrogen. Shaded areas represent uncertainty ranges calculated with a 95% confidence interval on the nitrogen-yield response coefficients.
Download figure:
Standard image High-resolution imageWith the excess nitrogen-production tradeoff frontier, we find that production could be held constant and excess nitrogen could decrease approximately 61% (49–67%). Excess nitrogen could be held constant and production could increase approximately 39% (29–46%).
Spatial patterns of nitrogen application, excess nitrogen, and cereal yield change with efficient nitrogen allocation. To illustrate these changes, we provide a series of maps for a scenario where cereal production and irrigated areas are held constant, and nitrogen fertilizer is applied spatially to minimize total nitrogen use (figures 2–4). We find substantial decreases in nitrogen application rates across the People's Republic of China, the United States, India, and parts of Western Europe (figure 2). In contrast, much of Eastern Europe and Africa show increases in nitrogen application rates. While total nitrogen consumption lowers, the remaining nitrogen consumption occurs at more homogenous, relatively moderate application rates. Lower nitrogen application rates translate into substantially reduced rates of mass balance excess nitrogen, with only a few locations showing noticeable increases due to higher application rates (figure 3). Some locations with high atmospheric deposition and manure nitrogen remain excess nitrogen hotspots despite lower application rates (parts of the US, Mexico, northern Europe, the People's Republic of China, and South Korea).
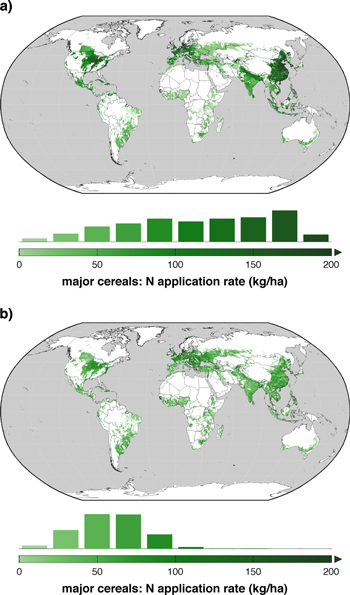
Figure 2. Changes to nitrogen application rates under an efficient spatial nitrogen allocation scenario with constant total cereal production and no changes to irrigated area. (a) Average nitrogen application rates for maize, wheat, and rice circa 2000. (b) Average nitrogen application rates for major cereals under the modeled scenario. Integrated histograms visualize the amount of total nitrogen consumption within application rate categories, and show a shift towards lower and more homogenous application rates.
Download figure:
Standard image High-resolution image
Figure 3. Changes to nitrogen excess rates under an efficient spatial nitrogen allocation scenario with constant total cereal production and no changes to irrigated area. (a) Average nitrogen excess rates for maize, wheat, and rice circa 2000. (b) Average nitrogen excess rates for major cereals under the modeled scenario. Integrated histograms visualize the amount of total excess nitrogen within rate categories.
Download figure:
Standard image High-resolution image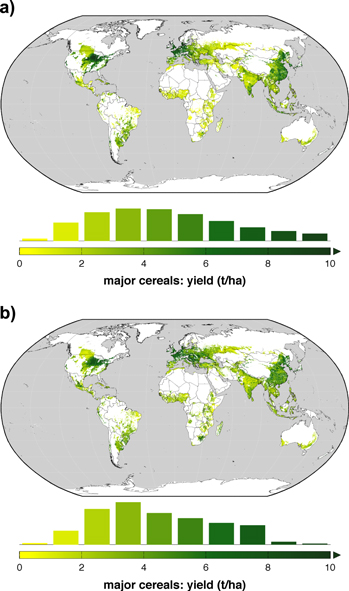
Figure 4. Changes to major cereal yield under an efficient spatial nitrogen allocation scenario with constant total cereal production and no changes to irrigated area. (a) Average cereal yield for maize, wheat, and rice circa 2000. (b) Average cereal yield under the modeled scenario. Integrated histograms visualize the amount of total cereal production within yield categories.
Download figure:
Standard image High-resolution image
While production is held constant under this scenario, there are some changes to the spatial patterns of cereal yield (figure 4). In general, there is also an 'evening out' of yield patterns that accompanies the more homogenous nitrogen application rates. However, the relatively high productivity of some major agricultural regions with high yield potential (e.g. the US Midwest) remains visible. As the nitrogen-yield curves utilized here represent the minimum nitrogen needed to achieve a given yield, modeled frontier yields (as in figure 4(b)) can be thought of as maximum possible yield given a certain level of nitrogen. This yield is modeled with circa year 2000 agronomic efficiency, and it is assumed other management practices, nutrients, and seed quality are not limiting.
Maize, wheat, and rice cultivation are responsible for relatively similar amounts of excess nitrogen circa 2000. Across the top ∼95% of crop area modeled in this study, we calculate maize nitrogen inputs to be 12.0 Mt chemical fertilizer nitrogen, 4.0 Mt manure nitrogen, and 0.6 Mt nitrogen from atmospheric deposition. Excess nitrogen for maize is approximately 8.6 Mt, or 51% of all maize nitrogen inputs. We find wheat nitrogen inputs of 14.7, 4.6, and 0.8 Mt nitrogen from chemical fertilizer, manure, and atmospheric deposition, respectively. Excess nitrogen for wheat is approximately 10.4 Mt, or 52% of total wheat nitrogen inputs. We find rice nitrogen inputs of 12.8, 5.4, and 0.6 Mt nitrogen from chemical fertilizer, manure, and atmospheric deposition, respectively. Rice had the largest amount of excess nitrogen of the three crops: 12.0 Mt nitrogen, or 64% of all rice nitrogen inputs.
4. Discussion
4.1. Increasing production and decreasing excess nitrogen
The tradeoff frontier for nitrogen use and cereal production potential quantifies the large potential for changes to global nitrogen management that both decrease excess nitrogen and increase crop production. While the analysis is not a prescription for any particular management change, it is a 'proof of concept' that changes in the spatial distribution of nitrogen intensity could lead to large production and environmental gains. Comparing spatial patterns of nitrogen application, nitrogen excess, and yield on the frontier relative to the current situation (figures 2–4) provides insight into the direction and magnitude of changes possible to both application rates and production. Pathways to achieve these changes involve a reallocation of nitrogen use intensity: decreases in areas where current nitrogen use is high, and increases in areas where nitrogen use is currently low. In addition, the whole system could and should improve by increasing the agronomic or technological efficiency of N use (see section: Moving the tradeoff frontier), as the models used to construct the tradeoff frontier are calibrated to circa 2000 data.
Moving towards more efficient spatial allocation of nitrogen would likely require substantial changes to infrastructure and markets. For example, many regions in Sub-Saharan Africa with low nutrient use suffer from a combination of high fertilizer prices due to overland transport costs and low per-capita income. In addition, inadequate storage facilities may prevent marketing of increased crop production, further discouraging management for higher productivity [33]. Likewise, reducing nitrogen use in areas of currently high nitrogen use may be politically and economically challenging unless reductions can be done in a way that doesn't hurt farm profits and productivity.
4.2. Impacts on human well-being
Reallocating nitrogen intensity to both increase production and decrease global excess nitrogen should tend to increase human well-being through several pathways. However, such changes will depend strongly on local conditions and the direction and magnitude of local changes to nitrogen use, and areas with increases in excess nitrogen could see negative impacts.
Increasing crop production in areas with currently low yields could enhance food security and promote economic development. However, while food availability (i.e. crop production) is necessary for access to healthy, safe, and nutritious food, it is not sufficient to ensure food security. Chronic poverty—not food availability—is the primary cause of food insecurity [34]. Income inequality, markets, infrastructure, and institutions also play a major role [35].
Efforts to reallocate nitrogen fertilizer application intensity would decrease N2O emissions disproportionately to any reduction in nitrogen use, leading to large benefits for climate and stratospheric ozone. This result is due to nonlinear increases in N2O emissions at high nitrogen application rates, particularly when there are large imbalances between applied and removed nitrogen [36, 37].
Potential human health benefits from decreasing excess nitrogen include decreases in nitrate-contaminated water and improved air quality [5, 7, 8, 19]. Ecosystem recreation value, fishing, and food provision could also benefit from improved water quality and climate change mitigation [8, 38]. Biodiversity, which is important for underpinning myriad ecosystem services, could benefit from improved air and water quality, less severe climate change, and reductions in reactive nitrogen deposition [5, 8]. In contrast, areas where nitrogen use and excess nitrogen increases (such as Eastern Europe, Russia, and Sub-Saharan Africa in the scenario presented by figures 2–4) could experience declines in human well-being through negative impacts on water and air quality.
Though not explicitly modeled here, we expect that efficient spatial allocation of nitrogen use would increase aggregate human well-being by coupling relatively large excess nitrogen reductions in areas of currently high nitrogen use with small to moderate excess nitrogen increases in areas with currently low nitrogen use. However, more information on the relationships between nitrogen-driven ecosystem impacts and human well-being in different regions would substantially aid these analyses. For example, population density in an area, the relationship between nitrogen pollution and fishing productivity, marginal benefits of a reduction in air pollution, and other factors all influence the complex relationships between nitrogen and human well-being in a given region [8]. If future research is able to systematically quantify the costs and benefits (social and private) of agricultural nitrogen use across the globe [e.g. 5, 7, 19], this information would allow greater insight into nitrogen management scenarios that maximize well-being.
4.3. Moving the tradeoff frontier
The tradeoff frontier presented here should be viewed as a first estimate of potential efficiency gains at a snapshot in time, characterizing production possibilities and tradeoffs with circa 2000 technology and average agronomic efficiencies. Substantial changes to the frontier are possible with improved practices and technologies.
A variety of management techniques could increase on-field nitrogen use efficiency and decrease excess nitrogen. Such strategies are characterized under the '4R Nutrient Stewardship' paradigm, which promotes use of the right fertilizer source with the right application rate, timing of application, and fertilizer placement in order to increase agronomic efficiency [39, 40]. Integrated management systems that incorporate these factors have provided dramatic experimental evidence that substantial increases to agronomic efficiencies are possible [18, 41]. For example, Chen et al [42] were able to double maize yields in the People's Republic of China while completely eliminating mass balance excess nitrogen by applying nitrogen in five split doses with soil testing guiding application rates. While such practices may represent a substitution of labor and technology for nitrogen, increasing adoption of these sophisticated agronomic practices could dramatically push up the tradeoff frontier as illustrated in figure 1.
However, despite the large potential for improving agronomic efficiency, broad trends in observed nitrogen recovery efficiency (a large-scale measure of agronomic efficiency) are relatively flat over time in both developed and developing countries [43]. Developed country efficiencies remain higher than developing country efficiencies. So while there is considerable potential for progress, achieving gains in practice will require overcoming system inertia as well as infrastructure, political, and economic obstacles.
Increasing biologically-derived nitrogen inputs can decrease dependency on chemical nitrogen for fertility, although may not necessarily lead to decreases in excess nitrogen [14]. However, organic inputs are especially critical for replenishing soil carbon [44] and ensuring responsive soils [20]. Appropriate crop rotations, mixed cropping systems, and agroforestry with leguminous trees can replenish soil fertility [33].
Other agronomic improvements, such as appropriate plant population, protection from pests and diseases, and improved seed can also improve field-scale agronomic efficiency and production [14]. Such improvements, and the continued development of crop varieties with higher yield potentials, would contribute to future shifts in the frontier. In addition, landscape management with perennial vegetation can capture runoff, and winter cover crops can reduce reactive nitrogen losses [40].
Future work should quantify how the adoption of practices that improve agronomic efficiency would change the tradeoff frontier and the current nitrogen-production status (i.e. changes to figure 1). Such efforts would benefit from consistent assessments of how global fertilizer use is allocated between different crops over both time and space, detailed records of which are currently very limited.
4.4. Uncertainties and limitations
All models are simplifications of reality, and agricultural management is a complex reality to simulate. Thus, there are a number of limitations and caveats that should be considered when interpreting this work.
The nitrogen-yield response curves utilized in this study estimate the minimum amount of nitrogen needed to determine a given yield circa 2000, and do not represent theoretically optimal agronomic efficiency [e.g. 45]. While the curves were parameterized taking into account possible yield limitation by irrigation, phosphorus, and potassium, frontier nitrogen use as estimated here assumes these inputs (and other management practices, including cultivar choice) are not limiting yields. The curves represent a general yield response for a given range of growing conditions, and are not appropriate for quantifying yield response for specific fields under specific management regimes. Given the scale at which the curves were parameterized, the curves do not capture variability in agronomic efficiency and yield that can occur at fine spatial and temporal scales in response to field-specific management and soil conditions [46, 47]. Likewise, this model only captures yield as a function of applied fertilizer nitrogen, not plant-available soil nitrogen, so it does not simulate indigenous nitrogen supply or how that stock may change between years or with specific cropping systems or soil conditions. Furthermore, we ignore the impact of biologically derived (i.e. organic) nitrogen on yield, focusing on inorganic fertilizer in this initial study (further discussion below regarding manure).
The bootstrapping analysis provides an estimate of uncertainty in the nitrogen-yield responses (specifically, the M–B response coefficients), but it does not capture all of the model or data uncertainties. A comparison of median bootstrap parameter estimates and mean estimates is presented in figure S4. Yield y-intercepts and asymptotes were set in the model using the upper and lower tails of the yield distribution in each climate zone [4]. We note that if high-yielding areas were not observed within a climate zone, the asymptote for the yield response could be artificially low, which would tend to make our estimate of the tradeoff frontier conservative.
The soil surface nitrogen balance model used utilizes detailed spatial data on nitrogen inputs and outputs to estimate excess nitrogen. However, we stress that mass balance excess nitrogen as calculated here is only a useful proxy for nitrogen pollution. Even locations with little to no mass balance excess may still experience reactive nitrogen loss throughout a growing season.
We also note that we modified the nitrogen balance model of Foley et al [3] by generating crop-specific nitrogen balances. These crop-specific calculations required apportioning manure inputs between crops proportionally to the area in each crop. The resulting manure use estimates are likely the most uncertain aspect of the spatial nitrogen balance approach, given the relatively rough estimates about the proportion of manure generated that is applied [see 3, 16, 30] and how the manure is divided between crops (this study). Given the lower confidence in the manure application data, manure was left out of the yield response model, but included in the nitrogen balance model. This allows us to roughly characterize the important influence of manure in determining excess nitrogen in areas with high livestock densities without introducing data artifacts into the yield model.
When building the cereal production frontier (figure 1), we aggregate across the crop-specific frontiers (online figures S1–S3) by keeping a fixed proportion of nitrogen consumption between the crops. One could also aggregate using fixed production proportions, i.e. aggregating along the y-axis instead of the x-axis. However, even without using fixed production proportions, the crop production mix varies only slightly under our method of aggregation (figure S5). More generally, we note that the aggregate (multi-crop) production frontier could shift in the future with changes towards or away more nitrogen-responsive crops.
All of the global datasets utilized for this study capture the state of agriculture circa 2000, and we do not capture changes in yield potential and crop area that have occurred in the recent past. Updates to the crop area, yield, fertilizer, and irrigation data would enable better understanding of global agricultural management and production. In addition to greater temporal resolution, different methodological approaches could be useful as well. Future work could generate global production frontiers using process-based models that may be more sensitive to fine-scale weather and soil variations, and such an analysis would be a useful complement to our study.
4.5. Conclusions
This analysis quantifies how substantial improvements are possible in crop production and reduction of both applied and excess nitrogen. Our results suggest global benefit from reductions in nitrogen intensity in some regions and increases in nitrogen intensity in others, along with wholesale increases in agronomic efficiency across the entire system. While such changes may be difficult to achieve, they would be important steps towards meeting projected increases in food demand while improving environmental quality [48].
Lastly, we suggest that the methodology adopted here—a crop production and environmental outcome tradeoff frontier—be utilized more widely to help determine production possibilities in agricultural systems that maximize human well-being. These analyses could and should be carried out at many different scales and over time, with the potential to improve land-use and agricultural land management decision-making.
Acknowledgements
We are grateful for helpful conversations with K Brauman, E Butler, J Hill, P Reich, and D Tilman. Research support was provided by a National Science Foundation Graduate Research Fellowship and a Ziff Environmental Fellowship to NDM, a grant from the Gordon and Betty Moore Foundation to JAF, and previous funding from NASA's Interdisciplinary Earth Science program to JAF. Additional research support was from the University of Minnesota's Institute on the Environment, the McKnight Foundation, the Grantham Foundation, World Wildlife Fund, The Nature Conservancy, and Stanford. Contributions by General Mills, Mosaic, Cargill, Pentair, Google, Kellogg's, Mars and PepsiCo supported stakeholder outreach and public engagement. The funders had no role in study design, data collection and analysis, decision to publish, or preparation of the manuscript.