
Abstract
This letter uses satellite remote sensing to examine patterns of cropland expansion, cropland abandonment, and changing cropping frequency in Mato Grosso, Brazil from 2001 to 2011. During this period, Mato Grosso emerged as a globally important center of agricultural production. In 2001, 3.3 million hectares of mechanized agriculture were cultivated in Mato Grosso, of which 500 000 hectares had two commercial crops per growing season (double cropping). By 2011, Mato Grosso had 5.8 million hectares of mechanized agriculture, of which 2.9 million hectares were double cropped. We found these agricultural changes to be selective with respect to land attributes—significant differences (p < 0.001) existed between the land attributes of agriculture versus non-agriculture, single cropping versus double cropping, and expansion versus abandonment. Many of the land attributes (elevation, slope, maximum temperature, minimum temperature, initial soy transport costs, and soil) that were associated with an increased likelihood of expansion were associated with a decreased likelihood of abandonment (p < 0.001). While land similar to agriculture and double cropping in 2001 was much more likely to be developed for agriculture than all other land, new cropland shifted to hotter, drier, lower locations that were more isolated from agricultural infrastructure (p < 0.001). The scarcity of high quality remaining agricultural land available for agricultural expansion in Mato Grosso could be contributing to the slowdown in agricultural expansion observed there over 2006 to 2011. Land use policy analyses should control for land scarcity constraints on agricultural expansion.
Export citation and abstract BibTeX RIS

Content from this work may be used under the terms of the Creative Commons Attribution 3.0 licence. Any further distribution of this work must maintain attribution to the author(s) and the title of the work, journal citation and DOI.
Introduction
Tropical agricultural expansion, harvest frequency, and intensification (hereafter agricultural development) are growing phenomena (Rudel et al 2009) with important implications for global economic development, food security, deforestation, and environmental quality (Foley et al 2005, Angelsen 2010, Ray and Foley 2013, VanWey et al 2013). Governance of tropical agricultural development is a high priority for conservation and development, but it is inhibited by a dearth of evidence on the characteristics of tropical lands where agricultural development has occured and can be projected to occur. In new agricultural regions such as Mato Grosso, the evidence gap is particularly dire and creates uncertainty concerning the area of remaining land suitable for agricultural development (hereafter the land reserve) and the efficacy of policies to control deforestation or encourage particular agricultural management practices.
Here we investigate the characteristics of land selected for agricultural development as compared to neighboring lands in Mato Grosso over the period 2001 to 2011. Ricardo's rent theory posits that, 'the most fertile and most favourably situated land will be first cultivated' (Ricardo 1891, p 49). If Ricardo is correct, then we can expect significant differences in the characteristics of land selected for agricultural development and lands left undeveloped. Quantifying the relative influence of particular land characteristics requires: (1) identifying the land characteristics to investigate, (2) determining the representation of the land characteristics variables, and (3) choosing the appropriate spatio-temporal scale of analysis.
We investigate land characteristics that are invariant and effectively invariant (elevation, soil type, slope, soy transportation costs at the start of the study period), slow-changing factors (local climatic conditions), and more dynamic processes (protected areas, land reserve). We take several approaches in the representation of land characteristics variables. We (1) test for significant differences between individual land characteristics across agricultural management classifications, (2) investigate trends in the reserve of land with land characteristics similar to existing agriculture, and (3) perform logistic regressions to examine the influence of each land characteristic on the probability that land is used for each of a set of agricultural activites.
Mato Grosso (7.23°–17.87° S and 50.57°–61.52° W) is a 900 000 km2 state in central Brazil comprising portions of three of the government-designated biomes of Brazil: the Amazon (480 000 km2), Cerrado (360 000 km2), and Pantanal (60 000 km2). The natural land cover includes dense forest, primarily in the Amazon biome, biologically diverse woody savannahs primarily in the Cerrado biome, and biodiverse wetlands primarily in the Pantanal Biome (figure 1).
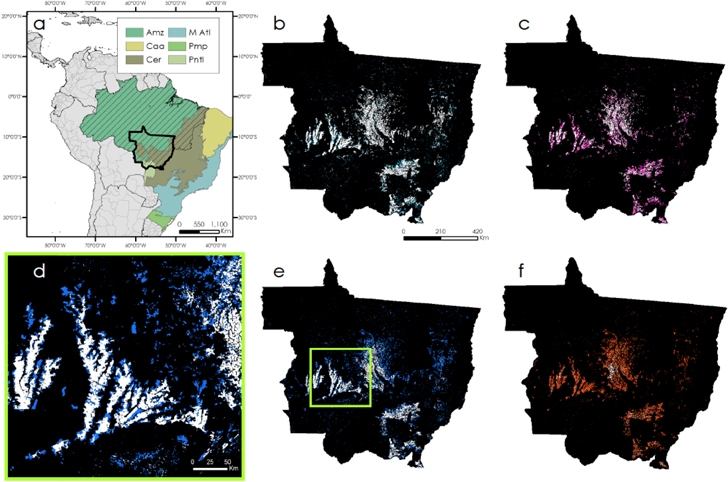
Figure 1. Mato Grosso, Brazil and its agriculture. (a) Mato Grosso State is completely within the Legal Amazon boundary (hatched lines). Mato Grosso is comprised of portions of three biomes, the Amazon (Amz), Cerrado (Cer) and Pantanal (Pntl). Other Brazilian biomes include the Caatinga (Caa), Mata Atlantica (M Atl) and Pampa (Pmp). (b) Cropland abandoned between 2002 and 2010 is highlighted in cyan, and the extent of mechanized agriculture in 2011 in white. (c) Double-cropped land abandoned between 2002 and 2010 is pink and 2011 double cropping is white. (d) Agricultural expansion in western Mato Grosso. Since land must lie fallow for just two years to be classified as abandoned agriculture, it is possible for some new agriculture to appear on old agricultural lands. (e) Agricultural expansion is blue and mechanized agriculture in 2001 is white. (f) The expansion of double-cropped agriculture is orange and 2001 double cropping is white.
Download figure:
Standard image High-resolution imageMato Grosso grows over 8% of global soybeans (FAO 2013). The region has benefited from the development of new soybean varieties that have overcome previous constraints on tropical production—acidic, aluminum-rich soils and short photoperiods (Sephar 1995, Fearnside 2005). Mato Grosso also has Brazil's largest cattle herd and produces 50% of the country's cotton (Brazilian Agricultural Ministry 2013).
Across South America, agricultural expansion and deforestation are often spatially and temporally correlated, and Mato Grosso has been an important center of the phenomenon (Gasparri et al 2013). Annual deforestation in Mato Grosso peaked in 2004 when over 1.1 million hectares were deforested (Brazilian National Institute for Space Research 2013). Between 2004 and 2011, deforestation rates in Mato Grosso declined 94% (Brazilian National Institute for Space Research 2013) 8 . Years of soybean expansion and deforestation in Mato Grosso have tended to coincide (Morton et al 2006), but it is rare for soybeans to expand directly onto cleared land. It is more common for soybean production to expand on cattle pasture and for cattle pasture to expand onto recently cleared land. Although this relationship has not been demonstrated to be causal, it has been argued that by replacing cattle ranching, soy production displaces cattle ranching to the forest frontier (Barona et al 2010, Arima et al 2011). However, from 2006 to 2012, increased output on existing agricultural lands became a more important component of increased agricultural production than expansion onto new lands (Macedo et al 2012).
Mato Grosso's agricultural development and deforestation have been linked to the rise of soy and beef exports to China, the European Union, and the Middle East (Fearnside 2001, Kaimowitz et al 2004, Naylor et al 2005, Nepstad et al 2006). Heightened soy expansion, deforestation, and exports were observed in periods in the early 2000s when the Brazilian currency, the real, was weak relative to the US dollar and when world agricultural commodity prices were high (Richards et al 2012). The Soy Moratorium, a 2006 agreement in which leading soybean companies pledged not to export soy cultivated on land deforested in the Amazon biome after 2006, may have helped to reduce deforestation (Macedo et al 2012, DeFries et al 2013). Controls on credit for deforesting areas and satellite monitoring for intervening in illegal deforestation may also have helped slow deforestation (Assunção et al 2012, Assunção et al 2013).
However, it also possible that land clearing in Mato Grosso has ebbed and cropping frequency has increased in part for the reason that Boserup (1965) argues—that little suitable land remains in the region for agricultural development. In order to investigate whether scarcity of high quality land is affecting agricultural development in Mato Grosso, it is necessary to first assess the characteristics of agricultural expansion, abandonment, and management in the state over time.
This letter leverages a recently developed dataset of agricultural land use in Mato Grosso, Brazil over the period 2001 to 2011 to investigate the association between agricultural development and land suitability in a region undergoing rapid agricultural change. For each year of the study period, the dataset identifies the extent of large-scale mechanized agriculture, the extent of double cropping in the region, the areas of newly created cropland and double cropping, and the areas where mechanized agriculture and double cropping were abandoned. First, we investigate the characteristics of mechanized agricultural lands versus the rest of the state and the characteristics of double cropped lands versus all agricultural lands. Then, we identify which land characteristics have the strongest association with mechanized agriculture and double cropping.
We also investigate whether newly created mechanized agriculture occurs on land with similar characteristics to the agriculture that existed in the state at the start of the study period, arguably the most suitable land. We investigate whether the reserve of high quality land for agriculture has measurably dwindled. We conclude by examining whether abandoned lands have similar characteristics to lands on which expansion occurs.
Methods
We developed maps of changes in agricultural management and prepared maps of key attributes of all land in Mato Grosso over the 2001–2011 period. Land attributes investigated were selected based, in part, on previous studies investigating the region's agriculture and include soils, climate, land use, topography, and transportation costs (Jasinski et al 2005). We performed analyses to: (a) quantify trends in agricultural development in the state; (b) investigate differences in the characteristics of land under different uses at the start of the study period; (c) determine whether the land attributes investigated were associated with agricultural development (when controlling for soils and protected areas); and (d) determine whether, over the course of the study period, land with qualities similar to agricultural land at the start of the period had greater likelihood of development.
Data
Agricultural land cover mapping
Previous research has successfully used moderate resolution imaging spectoradiometer (MODIS) vegetation index (VI) time series to classify land cover types in Mato Grosso (Galford et al 2008, Morton et al 2008, Arvor et al 2012, Brown et al 2013) and to monitor the planting of soy on deforested land (Rudorff et al 2011, 2012). We developed and validated the first 250 m resolution maps of mechanized agricultural land cover and management in Mato Grosso over the period 2001–2011. We are also first to demarcate the area of single cropped soybeans, the area of single cropped cotton, the soy-cotton rotation, and the soy-corn rotation across the entire state and study period. Because we are using 250 m resolution satellite data, these maps do not capture areas of smallholder farming.
We created MODIS Enhanced VI 16-day 250 m resolution annual time series over Mato Grosso for the eleven growing seasons between August 2001 and July 2011. We analyzed these data pixel-by-pixel with a decision-tree algorithm to determine both the area of cropland per growing season and the specific rotations of that cropland. Crop-specific growing season lengths and maximum EVI thresholds were used to classify mechanized agriculture into one of five crop rotation classes: soy, cotton, soy-corn, soy-cotton, and irrigated. All thresholds and parameters were determined using 99 points of training data collected in Mato Grosso in March 2011, general phenological patterns and thresholds described in Galford et al (2008) and Arvor et al (2011), and published regional crop calendars (United States Department of Agriculture Foreign Agricultural Service 2012).
We randomly sampled points within 1 km of roads in Mato Grosso (an area constituting 18% of the state and known to be the location of a large fraction of mechanized agriculture) to choose 600 new points for validation of each of the 11 annual agricultural land-cover maps. For each point, Landsat images depicting bands 4 (0.84 μm) as red, 5 (1.65 μm) as green, and 3 (0.66 μm) as blue were compiled and analyzed. Landsat images from the mid-to-late growing season highlight unique crop canopy reflectance signatures. A complete discussion of the decision-tree algorithm—including specific parameters and thresholds, validation, and accuracy assessment—can be found in the supporting online material. We present results for annual mechanized agricultural extent, Ct , and annual double cropping extent, DCt , where t is each of the 11 growing seasons between 2001 and 2011. The notations used throughout the paper are summarized in table 1.
Table 1. Paper notation.
| Land cover type | Paper notation |
|---|---|
| Cropland 2001 | C2001 |
| Agricultural land reserve 2003 | CR2003 |
| New cropland 2003 | NC2003 |
| New cropland 2011 | NC2011 |
| Double cropping 2001 | DC2001 |
| Double cropping land reserve 2003 | DCR2003 |
| New double cropping 2003 | NDC2003 |
| New double cropping 2011 | NDC2011 |
| Mato Grosso | MT |
| Abandoned cropland 2002 | AC2002 |
| Abandoned cropland 2010 | AC2010 |
| Abandoned double cropping 2002 | ADC2002 |
| Abandoned double cropping 2010 | ADC2010 |
Land reserve identification
Annual mechanized agriculture land reserve (CR) and double cropping land reserve (DCR) for the period 2003–2011 were identified. The agricultural land reserve, CRt , is the area of all land in Mato Grosso that can potentially be converted to agriculture because it is not yet used for agriculture. Using a two-year rule, the land reserve is defined as all land that was not mechanized agriculture in either year t − 1 or year t − 2. The double cropping land reserve, DCRt , is the area of all land with the potential to be converted to double cropping. The double cropping land reserve, then, is defined as all land that was not double cropping in year t − 1 or year t − 2. Therefore DCRt is the sum of CRt and all land in single cropping. This approach overestimates the land that is likely to be converted to agriculture or to double cropping by including land that is inaccessible due to remoteness or institutional barriers (such as policies preventing deforestation). Thus, our estimates of scarcity will be conservative estimates.
New cropland identification
Annual maps were developed of new mechanized agriculture (NC) and new double cropping (NDC) for the period 2003 to 2011. The new cropland class, NCt , is the subset of all land classified as mechanized agriculture in year, t, that was not mechanized agriculture in year t − 1 or year t − 2. The new double-cropping class, NDCt , is the subset of all land classified as double cropping in year, t, that was not double cropping in year t − 1 or year t − 2. This approach overestimates the area of new cropland by including land that may have been cropland greater than two years before year t. However, it more accurately captures dynamic changes than an approach classifying a pixel as cropland in perpetuity once it has been used for agriculture in any year.
Abandoned cropland (AC) identification
Annual mechanized agriculture AC and abandoned double cropping (ADC) for the period 2002 to 2010 were identified. Again, the two-year rule was implemented: ACt , is all land that was mechanized agriculture in year t − 1, but not in years t or t + 1. Abandoned double-cropped land, ADCt , is all land that was double cropped in year t − 1, but not in years t or t + 1. This approach may overestimate the area of abandoned land by including land that is returned to agriculture after year t + 1. All analyses were repeated using a five-year abandonment rule and a nine-year abandonment rule to test the sensitivity of our results. While the total abandoned area identified changed under the different rules, the land characteristics of the abandonment were stable. See tables S8–S13.
Suitability maps
Slope and elevation maps
NASA's Shuttle Radar Topography Missions (SRTM) data were used to create a 90 m digital elevation map (DEM) of Mato Grosso. A slope map of the same resolution was derived from the DEM using ENVI software and the application of a seven-kernel smoothing window to account for anomalously high slopes created as a result of forest edges and variable canopy heights (Van Zyl 2001).
Average temperature maps
Annual minimum and maximum Climate Research Unit V 3.21 temperature data at 50 km resolution for 1980–2000 were downloaded from the British Atmospheric Data Centre database, and averaged over this time period (New et al 2002).
Average precipitation and soil moisture maps
Gridded 50 km long-term means from monthly (1981–2010) Climate Prediction Center soil moisture and Global Precipitation Climatology Centre data were downloaded from NOAA/OAR/ERL Physical Sciences Division website (Fan and van den Dool 2004).
Soybean transportation costs map
A model was developed estimating the least cost of transporting soybeans from any location in Mato Grosso to processing facilities in the state at the start of the study period. The costs are expressed in year 2000 US. Dollars per ton and are computed for each 1 km grid cell in Mato Grosso. A raster map of land cover and of road, river, and rail transportation networks 9 was created and used to develop a friction raster depicting the cost per meter of traversing each surface type. Costs were adapted from travel times in Farrow et al (2011), were modeled using data on Brazilian agricultural logistics (de Castro et al 1999, Bowman et al 2011, University of São Paulo-ESALQ System of Freight Information 2012) and were adjusted for slope and elevation (Wagtendonk and Benedict 1980). Next, locations where soybeans are purchased and traded were mapped (Brazilian Institute of Geography and Statistics 2013). Finally, we used the cost-distance feature of ArcMap 10.0 Spatial Analyst to compute the least-cost path from each grid cell on the map to the soybean market points.
Protected areas
Shapefiles of Brazil's protected areas and indigenous reserves were downloaded from the World Database on Protected Areas (IUCN and UNEP-WCMC 2014). The dataset maps indigenous reserves and the year of their creation over 1958–2010 and protected areas over 1978–2006. For our analysis, for each year from 2001 to 2011, we created maps of indigenous reserves and protected areas to date.
Soils
We classified soils based on a 1 km, 19 class soil map produced by the Brazilian Agricultural Research Corporation and the Brazilian Institute of Geography and Statistics (Brazilian Agricultural Research Corporation 2014). The 19 classes in the map are aggregate groups of similar soil types in the Brazilian soil classification system. Of the 19 soil classes in the mapping, ten are present in Mato Grasso (Sfigure 12). We reclassified the Mato Grosso soils into two categories: upland soils suitable for agriculture (deep quartz-rich soils, soils 'podzolicos', latosols, and terra roxa) and all other soils (cambisols, hydromorphic laterites, hard laterites, gley soils, lithic soils, and water). These other soils are mainly present in wetland areas. Nearly all mechanized agriculture in Mato Grosso is cultivated on the upland soils suitable for agriculture (Sfigure 13).
Analysis
Each suitability map and land-cover map was projected to WGS 84 UTM South American Zone 21, set to the extent of a 1255 km by 1187 km rectangle inscribing Mato Grosso, and resampled to match the resolution of the MODIS data. We converted the rasters to integer ascii files, exported them to Stata 12 SE and assigned a unique gridcode to each cell. We calculated descriptive statistics for each year of land cover maps CRt , DCRt , NCt , NDCt , ACt , and ADCt . Several analyses were performed: (1) we used t-tests to identify statistically significant differences in the distribution of land attributes of nine land use categories; (2) we computed the amount of agricultural land reserve and double cropping land reserve in each year that fell within 1/2 standard deviation, 3/4 standard deviation, 1 standard deviation, and 2 standard deviations of mean values for 2001 agriculture and mean values for 2001 double cropping for all seven land attributes simultaneously; and (3) we performed logistic regressions to assess the explanatory power of land attributes for the location of the stocks, increments, and decrements of mechanized agriculture and double cropping. The land characteristics employed as explanatory variables in the regressions were continuous variables for: average annual maximum temperature, average annual minimum temperature, average annual soil moisture, average annual precipitation, elevation, slope, and soy logistics costs in the year 2000; and binary variables for the presence of indigenous reserves, the presence of protected areas, and the presence of good soils. The dependent variables investigated were: (a) CRt and DCRt (from 2001 to 2011) over Mato Grosso; (b) NCt and NDCt (from 2003 to 2011) over CRt and DCRt respectively, and (c) ACt and ADCt (2002 to 2010) over Ct and DCt respectively. In the logistic regressions performed, '1' denoted the pixels classified in each land classification and '0' denoted the remainder of the population at risk of transition—(i.e. the subset of the state that had the chance to transition into each land cover type, but did not. Thus, for new mechanized agriculture in 2003, '1' s were the area of agriculture in 2003 that was not agriculture in 2001 or 2002)β. '0's are the area that was not mechanized agriculture in 2003 that was also not mechanized agriculture in 2001 or 2002. Areas that were agriculture in either 2001 or 2002 were excluded because they had no possibility of becoming new agriculture in 2003. For 2002 abandonment, '1' denotes pixels that were not mechanized agriculture in 2002, were agriculture in 2001, and do not go on to become agriculture in 2003. Regressions on total agricultural area examined the probability that any pixel in the state could become mechanized agriculture 10 .
Results
Agricultural area expanded and cropping frequency increased
In 2001, total agriculture, C2001, was 3.3 million hectares (figures 2 and 3). Of this, roughly 500 000 hectares were double cropped, DC2001. Of the 5.8 million hectares of C2011, 2.9 million hectares were double cropped (DC2011). Single cropped soybean production accounted for 53% of Ct from 2001 to 2011, while soy-corn rotations accounted for 37%. Over the period 2003–2011, 6 million hectares of cropland were created from forest, pasture, or Cerrado, while 6.4 million hectares of NDC were brought into cultivation. This indicates that, over the period, NDC was more likely to persist than new single cropping.
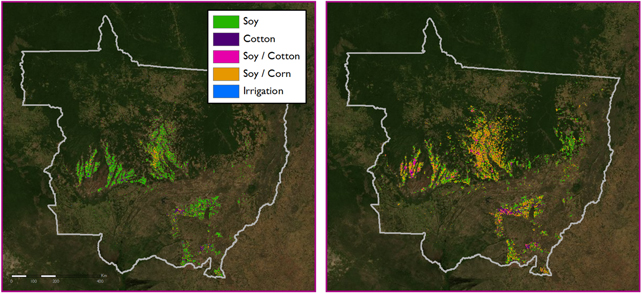
Figure 2. Maps of mechanized agriculture in Mato Grosso for the 2001 (left) and 2011 (right) crop years. Between 2001 and 2011, total cropland area in Mato Grosso increased 75% from 3.3 million ha to 5.8 million ha. The amount of double cropped land increased six-fold from 0.5 million hectares of land 2001 to 2.9 million hectares in 2011, with soy-corn double cropping rotation accounting for 92% of double-cropped land in 2011.
Download figure:
Standard image High-resolution image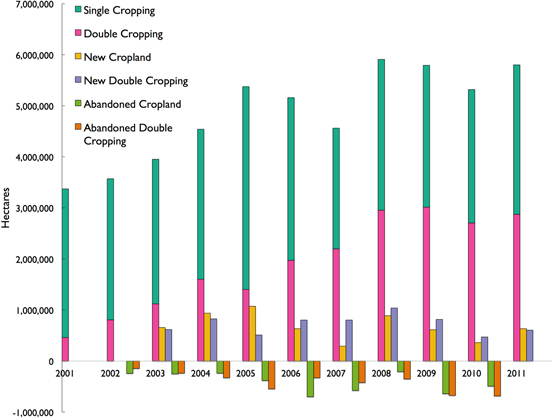
Figure 3. Cropping frequency, expansion and abandonment. Cropland expanded from 3.9 million hectares of cropland in 2003 to 5.8 million hectares by 2011. However, during the period, over 6 million hectares of cropland were created from the forests, pastures, and savannas of the state and an additional 5 million hectares of single cropping were converted to double cropping. Another 3.7 million hectares of cropland were two-year-rule abandoned between 2002 and 2010. There is no discernible trend in the rate of cropland creation or abandonment over the period, but increased cropland abandonment since 2005 has helped limit the increase in total cropland area in recent years. Single cropping and double cropping comprise the total cropland pool. New double cropping is not a subset of new cropland. New double cropping is areas in which no double cropping occurred in the previous two years, whereas new agriculture is in which there was no agriculture in the previous two years. Thus, new double cropping may or may not also be new cropland, but new cropland might not be new double cropping.
Download figure:
Standard image High-resolution imageAgricultural land is significantly different from non-agricultural land
In 2001, just under 5% of Mato Grosso was mechanized agriculture. Of this agriculture, roughly 12% was double cropped. Relative to the rest of the state, land in agriculture was significantly higher in elevation, lower in slope, and had lower logistics costs for soybeans (p < 0.001). Mean minimum temperature and mean maximum temperature were lower for agricultural lands (p < 0.001). Mean annual precipitation and mean annual soil moisture were higher (p < 0.001). Double cropping in 2001 had similar characteristics to the rest of 2001 mechanized agriculture, except that the slope of these lands was somewhat lower. Mean and standard deviations of the attributes of each of the land cover types can be found in table 2.
Table 2. Attributes of select land uses. Table 2 contains mean values and standard deviations of the attributes of the select land cover types. T-tests were also performed comparing land attributes of column 1 with columns 2–4 and 9–11, and comparing column 5 with columns 6–8, 9, and 12–13. Each t-test was statistically significant. Two-tailed P-values were <0.001 for each t-test performed.
| C2001 | CR2003 | NC2003 | NC2011 | DC2001 | DCR2003 | NDC2003 | NDC2011 | MT | AC2002 | AC2010 | ADC2002 | ADC2010 | |
|---|---|---|---|---|---|---|---|---|---|---|---|---|---|
| Area (km2) | 33 745 | 859 320 | 6564 | 3494 | 4619 | 889 540 | 6173 | 2809 | 904 520 | 2423 | 4938 | 1462 | 6852 |
| Elevation (m) | 535 | 327 | 469 | 354 | 520 | 333 | 499 | 435 | 336 | 434 | 433 | 536 | 468 |
| [127] | [134] | [150] | [147] | [137] | [139] | [130] | [126] | [141] | [149] | [149] | [148] | [127] | |
| Slope (degrees) | 1.03 | 2.27 | 1.39 | 2.21 | 0.989 | 2.23 | 1.00 | 1.36 | 2.22 | 1.50 | 1.61 | 1.17 | 1.24 |
| [0.68] | [2.19] | [1.02] | [0.19] | [0.728] | [0.16] | [0.71] | [1.01] | [2.16] | [1.23] | [1.08] | [1.01] | [0.72] | |
| Precipitation (mm yr-1) | 1810 | 1760 | 1760 | 1700 | 1780 | 1770 | 1810 | 1810 | 1170 | 1800 | 1760 | 1770 | 1810 |
| [151] | [268] | [177] | [245] | [132] | [265] | [141] | [151] | [267] | [216] | [182] | [155] | [145] | |
| Soil moisture (mm yr-1) | 5490 | 5320 | 5370 | 5250 | 5460 | 5330 | 5460 | 5340 | 5340 | 5400 | 5390 | 5450 | 5430 |
| [216] | [430] | [299] | [411] | [197] | [426] | [213] | [253] | [427] | [319] | [302] | [231] | [249] | |
| Minimum temperature (°C) | 19.2 | 19.7 | 19.3 | 19.8 | 19.2 | 19.7 | 19.2 | 19.4 | 19.9 | 19.5 | 19.4 | 19.2 | 19.3 |
| [0.470] | [0.670] | [0.580] | [0.680] | [0.440] | [0.670] | [0.430] | [0.530] | [0.680] | [0.560] | [0.570] | [0.510] | [0.520] | |
| Maximum temperature (°C) | 32.0 | 32.2 | 32.1 | 32.3 | 32.1 | 32.2 | 32.1 | 32.2 | 32.3 | 32.2 | 32.1 | 32.4 | 32.6 |
| [0.540] | [0.590] | [0.570] | [0.600] | [0.550] | [0.590] | [0.500] | [0.500] | [0.600] | [0.520] | [0.560] | [0.550] | [0.530] | |
| Soy cost distance ($) | 46.5 | 74.6 | 57.8 | 63.9 | 47.0 | 73.8 | 54.1 | 70.7 | 73.5 | 56.1 | 63.6 | 47.1 | 62.3 |
| [17.2] | [35.0] | [22.8] | [29.8] | [15.8] | [34.8] | [18.0] | [30.2] | [34.8] | [21.9] | [26.8] | [18.2] | [24.0] |
*standard deviations in brackets
The selective land characteristics of agricultural expansion
Over the study period, the attributes of new cropland created were far more similar to base-year cropland than to the attributes of the rest of the state. However, steady trends in the attributes of new cropland were evident. Cropland created in 2011 was significantly hotter, at lower elevations, drier, farther from markets, and more steeply sloped than cropland created in 2003 (p < 0.001 for each attribute). Newly double-cropped land in 2011 was also significantly different from newly double-cropped land in 2003 (p < 0.001 for each attribute), but that difference was less pronounced than the difference between 2001 mechanized agriculture and newly mechanized agriculture in 2011. Figure 5 and table 2 provide synopses of these trends. The average hectare of C2001 had an elevation of 535 m, and a slope of 1°. By contrast, NC2011 averaged an elevation of 354 m and slope of 2.2°. From C2001 to NC2011, precipitation decreased from 1811 mm to 1700 mm, soil moisture height dropped from 5493 mm to 5247 mm, and average annual maximum temperature increased from 32 °C to 32.3 °C. The average hectare of DC2001 had an elevation of 520 m, and a slope of 1°. By contrast, NDC2011 averaged an elevation of 435 m and slope of 1.4°. From DC2001 to NDC2011, the precipitation mean increased slightly from 1780 mm to 1811 mm, soil moisture height dropped from 5460 mm to 5355 mm, and average annual maximum temperature increased from 32.1 °C to 32.2 °C (table 2, figure 4).
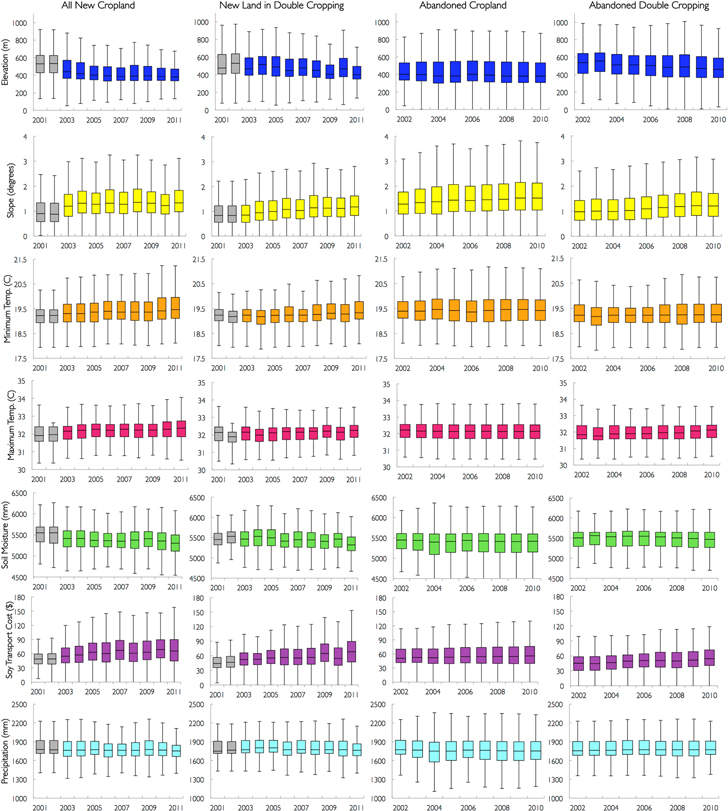
Figure 4. Box-and-whisker plots of elevation, slope, soil moisture, precipitation, average maximum temperature, average minimum temperature, and soy transportation costs of all expansion of mechanized agriculture, expansion of double cropping, abandonment of mechanized agriculture, and abandonment of double cropping by year. Pixels are classified as expansion of mechanized agriculture or double cropping in year t if they are classified as mechanized agriculture or double cropping in year t, but not in the previous two years. The gray boxes depict the characteristics of all agriculture and all double cropping in the state. Pixels are classified as agricultural abandonment or double cropping abandonment in year t if they are classified as agriculture or double cropping, respectively, in year t − 1 but not classified as agriculture in years t or t + 1. The line at the center of the boxes depicts the median, the ends depict the first and third quartiles, and the whiskers depict 1.5 times the interquartile range.
Download figure:
Standard image High-resolution imageThe selective land characteristics of agricultural abandonment
As shown in table 2 and figure 4, in comparison to 2001 mechanized agriculture, agriculture abandoned in 2002 was lower, drier, hotter, on steeper slopes, and had higher logistics costs. By 2010, the profile of abandonment had shifted even further toward lower, more sloped, drier, and higher initial logistics costs than of that in 2002 (p < 0.001). In comparison to 2001 double cropping, double cropping abandoned in 2002 was higher, more sloped, drier, hotter, and had slightly higher initial logistics costs. ADC in 2010 continued on lands that were even more sloped, and had lower soil moisture, and higher initial logistics costs than those abandoned in 2002 (p < 0.001).
Sensitivity of agricultural abandonment classification
For the 2002–2006 period, over half of the cropland that was abandoned for two years remained abandoned for at least another three years, while 36% remained abandoned throughout the study period. Only approximately 32% of double cropping abandoned for two years remained so for the following three years, while 17% remained abandoned through 2011. Our definition of abandonment allows for double cropping to be 'abandoned' to single cropping. Thus, much of the variability captured in sensitivity tests shown in table 3 may be farmers rotating single cropping and double cropping through their fields.
Table 3. Land abandonment classification sensitivity test. We examined the sensitivity of land abondonment area to the duration of abandonment. The two columns at left show the proportion of agriculture and double cropping abandoned for two years that persisted for at least five years. The two columns at right show the proportion agriculture abandoned for two years that persisted for nine years. Because our most recent land use data are from 2011, five-year abandonment tallies were limited to the 2002–2006 period and the nine-year abandonment could only be calculated for the year 2002.
| Remaining proportion of two year abandonment | ||||
|---|---|---|---|---|
| After five years | After nine years | |||
| ACt | ADCt | ACt | ADCt | |
| 2002 | 49.6% | 37.6% | 36.37% | 17.19% |
| 2003 | 51.1% | 30.1% | ||
| 2004 | 58.8% | 25.8% | ||
| 2005 | 59.8% | 31.6% | ||
| 2006 | 49.5% | 35.8% | ||
Table 4. Relationships between land characteristics and land transitions. Pluses with asterisks indicate positive correlations (p < 0.001) across all years investigated. Pluses without asterisks indicate positive correlations across all years, but with some years statistically insignificant. Minuses indicate negative correlations (p < 0.001) across all years. Minuses without asterisks indicate negative correlations across all years, but with some years statistically insignificant. 'M's indicate cases where both negative and positive correlations were observed across the study period. Full results of all of the regressions performed are reported in the SOM.
| Ct | DCt | NCt | NDCt | ACt | ADCt | |
|---|---|---|---|---|---|---|
| Maximum temperature | +* | +* | +* | +* | −* | −* |
| Minimum temperature | −* | −* | −* | −* | +* | +* |
| Precipitation | +* | m | m | −* | m | +* |
| Soil moisture | −* | −* | + | +* | m | m |
| Soy transport cost | −* | −* | −* | −* | + | +* |
| Elevation | +* | +* | +* | +* | −* | −* |
| Slope | −* | −* | −* | −* | +* | +* |
| Upland soils | +* | +* | +* | +* | −* | − |
| Protected areas | −* | −* | −* | −* | +* | m |
| Indigenous reserves | −* | −* | −* | −* | +* | m |
Agricultural dynamics are correlated with specific land characteristics
Logistic regressions were performed to examine whether the land attributes investigated are associated with the incidence of Ct , DCt, NCt , NDCt ACt , and ADCt . The regressions controlled for soil type and the presence of indigenous reserves or other protected areas. Of the seven land attributes investigated, all were significant in explaining land use location, expansion, and abandonment probabilities. The sign of the coefficients of each attribute was the same for agricultural extent, double cropping extent, agricultural expansion, and double cropping expansion. The sign of coefficients for agricultural abandonment and double cropping abandonment were the reverse of the sign for the coefficients of all other land types (see table 3). In some regressions, soil moisture and precipitation were not significantly associated with land uses. The directions of the coefficients for agricultural abandonment and double cropping abandonment for the five-year rule and nine-year rule were the same as for the two-year rule. The magnitudes differed slightly, but not systematically. A comparison of these regressions can be found in table 13 of the SOM.
The pool of high quality land is decreasing
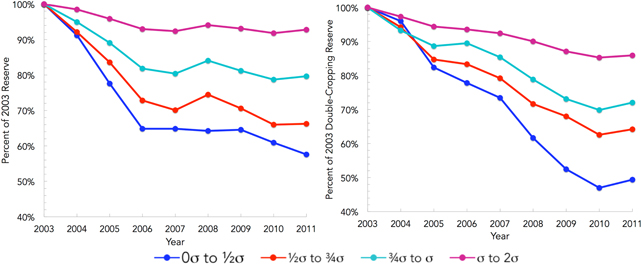
Very little of the 2003 land reserve, CR2003, was similar in all seven attributes to 2001 agriculture, C2001, and very little of double cropping land reserve, DCR2003, was similar to 2001 double cropping, DC2001. Just 14% of CR2003 was within two standard deviations (2σ) of the characteristics of C2001 for all seven continuous land attributes investigated. For DCR2003, just 14% was within 2σ of the mean attributes of DC2001. Though constituting a small share of the land reserve, these areas went on to play a disproportionately important role in agricultural expansion. 32% of new cropland, NCt , occurred on these lands and 53% of new double cropped land, NDCt , occurred on these lands. In addition, land within 1σ of attribute means for C2001 was three times more likely to be developed than land between 1σ and 2σ. Considering all seven land attributes jointly suggests a much stronger case for the potential emergence of land reserve scarcity than examining scarcity attribute by attribute. The area of CR2011 within 1σ of 2001 declined 22% from CR2003, while DCR2011 within 3/4σ declined 32% from DCR2003. Nevertheless, the majority of CR2003 and DCR2003 remain within 2σ of Q2001 and DC2001 respectively (figure 5).
Figure 5. Decline in area of available land similar to 2001 agriculture. The characteristics of the land available in Mato Grosso (2003–2011) for mechanized agriculture and double cropping were compared to the characteristics of mechanized agriculture and double cropping in Mato Grosso in 2001. For example, the dark blue line represents the portion of land available for agricultural expansion that falls within zero to 1/2 standard deviations of the mean value of each the seven investigated land attributes of the 2001 agricultural area in the state. The red line represents the portion that is within 1/2 to 3/4 standard deviations from the mean values. The proportion of available land for double cropping declines more steeply despite constituting a larger area.
Download figure:
Standard image High-resolution image
Discussion and concluding remarks
Our investigation of Mato Grosso, Brazil from 2001 to 2011 provides firm evidence that agricultural expansion, abandonment, and harvest frequency were selective with respect to elevation, slope, maximum temperature, minimum temperature, and the soy logistics costs at the start of the study period (p < 0.001). Nonetheless, new agriculture and new double cropping in 2011 had come to have significantly different land characteristics than new agriculture and new double cropping had in 2003. The characteristics of new double cropping changed less than new single cropping. Thus the selectivity for double-cropped land was more pronounced than the selectivity for single cropped land. This discrepancy is perhaps due to the more stringent agronomic requirements associated with double cropping. However, double cropping was also less likely to be abandoned than single cropping. Perhaps double cropped farms tend to be more economically and institutionally resilient to production shocks than single cropped farms.
Over the decade, land characteristics of agricultural expansion inched further from the characteristics of the first lands developed and closer to the characteristics of previously abandoned lands. Recent areas of expansion were more likely to be abandoned than early areas of expansion. A scarcity of available suitable land may be prompting farmers to experiment with agriculture on a variety of lands. Through a process of expansion and abandonment, agriculture may eventually become concentrated on the most favorable of these.
Meanwhile, we also demonstrate a substantial decline in the area of land reserve with characteristics similar to the initial agricultural land. If Ricardian rent theory is correct that agricultural expansion will occur first on the highest quality lands and later on the lower quality lands, then this decline also means a reduction in the availability of quality land reserve. A growing shortage of quality land reserve may explain the slowdown in agricultural expansion over the latter half of the study period.
Thus a growing scarcity of high quality land available for agricultural expansion may be influencing patterns of agricultural development in Mato Grosso. Other explanations such as deforestation governance (DeFries et al 2013) and the potentially underestimated utility of cattle ranching (Bowman et al 2011) are unlikely to be associated with such strong and patterned trends in land characteristics of agricultural extent, expansion, and abandonment.
Land scarcity effects have important ramifications for the design and assessment of a variety of land use policies. One such policy is the Low Carbon Agriculture program, an effort by the Federal Government of Brazil that seeks to promote the conversion of pastureland to cropland in Brazil (Stabile et al 2012). Future analyses could investigate whether low land quality of existing pastures is impeding conversion. Conversion of pasture may also be impeded if the utility of extensive cattle ranching is higher than some estimates suggest (Cohn et al 2011).
Evaluation of policies to prevent deforestation can benefit from assessment of the influence of land quality on deforestation outcomes. Policies in Brazil seek to prevent deforestation through mechanisms such as satellite monitoring of deforestation, municipalities black-listed from selling agricultural products, government credit limitations, and voluntary agreements to prevent soy and beef sales from recently deforested land (Nepstad et al 2009, Soares-Filho et al 2010, Newton et al 2013). It is possible that some of these policies have helped to 'decouple' agriculture expansion and deforestation in Mato Grosso (Macedo et al 2012). But it is also possible that the decoupling is a consequence of a scarcity of available land worth deforesting for agricultural development (Soares-Filho et al 2006). An investigation of the attributes of deforested versus forested lands is foundational for evaluating the efficacy of deforestation policies.
Author contributions
SAS, ASC, LKV, and JFM designed the research; SAS, and ASC performed the research; SAS, ASC, LKV, and JFM analyzed the data; SAS, ASC, LKV, and JFM wrote the paper; SAS, ASC, JR, BFR, and MA contributed reagents.
Footnotes
- 8
The measurement and comparison of soybean expansion and deforestation provides an incomplete picture of the land conversion process in Mato Grosso. Savannah vegetation covers over a third of the state. Official deforestation statistics do not monitor conversion of savannah lands and it is particularly difficult to detect the conversion of savannah to cattle pasture. Of the total Brazil cerrado, 2.2% is legally protected with another 4.1% allocated as indigenous lands (versus 5.7% protected within the Amazon biome and another 17.7% allocated to indigenous lands) and there a difference in Forest Code regulation. For more, please see: Klink C A & Machado R B (2005). Conservation of the Brazilian cerrado. Conservation Biology, 19(3), 707–713.
- 9
These data were accessed at diva.org, and the Brazilian Environmental Ministry website.
- 10
A small subset of regressions could not be run due to matrix characteristics. We suspect that high covariance between the coefficients of some independent variables in some analyses was to blame. Our solution was to select a random subset of each population at risk (n = 2 million pixels) on which to perform the analysis. Using this subset reduces bias from spatial autocorrelation and speeds up processing time. The subsetting procedure was first to generate a random number for each observation in the dataset. Then we sorted the dataset first by population at risk and then by these random numbers. Then we divided the dataset into ten equal sized groups, then we performed the regressions on the first group of observations alone. Coefficients and goodness of fit were robust to the subsetting procedure.