
Abstract
Thaw of ice-rich permafrost soils on sloping terrain can trigger erosional disturbance events that displace large volumes of soil and sediment, kill and damage plants, and initiate secondary succession. We examined how retrogressive thaw slumps (RTS), a common form of thermo-erosional disturbance in arctic tundra, affected the local loss and re-accumulation of carbon (C) and nitrogen (N) pools in organic and surface mineral soil horizons of 18 slumps within six spatially independent sites in arctic Alaska. RTS displaced 3 kg C and 0.2 kg N per m2 from the soil organic horizon but did not alter pools of C and N in the top 15 cm of the mineral horizon. Surface soil C pools re-accumulated rapidly (32 ± 10 g C m−2 yr−1) through the first 60 years of succession, reaching levels similar to undisturbed tundra 40–64 years after disturbance. Average N re-accumulation rates (2.2 ± 1.1 g N m−2 yr−1) were much higher than expected from atmospheric deposition and biological N fixation. Finally, plant community dominance shifted from graminoids to tall deciduous shrubs, which are likely to promote higher primary productivity, biomass accumulation, and rates of nutrient cycling.
Export citation and abstract BibTeX RIS

Content from this work may be used under the terms of the Creative Commons Attribution 3.0 licence. Any further distribution of this work must maintain attribution to the author(s) and the title of the work, journal citation and DOI.
1. Introduction
More than half the global soil organic carbon (C) pool resides in the soils and sediments of Arctic and Boreal regions (Schuur et al 2009, Tarnocai et al 2009, Zimov et al 2006). This has spurred considerable interest in understanding how the C balance of these ecosystems will respond to observed and predicted climate warming (Schuur and Abbott 2011). Release of C due to thaw and decomposition of permafrost has been identified as one of the strongest and most likely positive feedbacks between the biosphere and a warming climate (Chapin et al 2008, Schuur and Abbott 2011, Schuur et al 2008, Yang et al 2010). Although circum-arctic observations of permafrost warming (Romanovsky et al 2010) and thaw have increased substantially in the last five decades (Bowden 2010, Jorgenson et al 2001, Lantz and Kokelj 2008), the rate and magnitude of the feedback remains uncertain because of complex interactions between physical and biological processes caused by thaw (Callaghan et al 2004, Jorgenson and Osterkamp 2005, Jorgenson et al 2010, Schuur et al 2008).
In permafrost soils, ground ice may occupy soil volume (Murton 2009, French and Shur 2010), thus permafrost thaw in relatively flat areas of the landscape leads to subsidence, microtopographic changes, and altered water tables (Jorgenson et al 2010). Changes in soil moisture and temperature may accelerate both soil organic matter decomposition and plant growth, resulting in variable effects on ecosystem C balance (Lantz and Kokelj 2008, Schuur et al 2009, Schuur et al 2007). On sloping landscapes, thaw of ice-rich soil can destabilize the ground surface, leading to catastrophic mass wasting of soil and sediment and the formation of thermo-erosional disturbance features (Kokelj et al 2009, Murton 2009, Schuur et al 2008). This process mixes plant biomass with surface and deep soils, exports surface materials to aquatic ecosystems (Kokelj et al 2005, Ping et al 2011), and exposes unweathered mineral substrates (Lantz et al 2009, Schuur et al 2008). Plant community reorganization may occur via recruitment of new individuals from seeds, spores, or the vegetative propagules of damaged plants within the disturbed site (Bartleman et al 2001, Jorgenson et al 2001, Mackay and Burn 2002, Ovenden 1986, Yang et al 2010), leading to shifts in the species and functional groups that dominate after disturbance (Lantz et al 2013).
Permafrost ecosystems of Alaska's North Slope tend to have thick organic surface soil layers due to relatively higher rates of plant production compared to decomposition (Hobbie et al 2000). Disturbances that impact this layer alter both biological and physical controls over carbon cycling (Boike et al 1998, Lantz et al 2009, Mack et al 2011). The organic layer stores about 63% of the soil C (Ping et al 2008) and nitrogen (N) (Mack et al 2011) in the top 1 m of soil, so disturbances that lead to its redistribution or loss can dramatically alter element stocks and turnover on both disturbed and downstream ecosystems. Because N is the element most likely to limit plant productivity in upland tundra (Shaver and Chapin 1986), its loss may constrain future C uptake potential as well. Furthermore, greater than 90% of plant root and rhizome biomass is found in the organic layer (Shaver et al 2014), and some plant and lichen species only recruit on organic soils (Hestmark et al 2007). The soil organic layer also modulates the physical state of permafrost soils, regulating surface hydrology and insulating permafrost from air temperatures (Boike et al 1998, Zhang et al 2003). Finally, when the seasonally thawed active layer includes mineral soil, the organic layer acts as an interface that buffers pH and mediates the transport of phosphorus (P) and base cations that are produced from the weathering of primary materials (Borin et al 2010, Hobbie and Gough 2002).
Retrogressive thaw slumps (RTS) are thermo-erosional disturbance features that occur when ice-rich permafrost degrades on sloping terrain, often in connection with heat transfer from a lake, stream, or river (Bowden 2010, Burn and Lewkowicz 1990). These disturbance features consist of a headwall of exposed mineral soil and a footslope where thawed sediments accumulate (Lantz et al 2009). If terrain is sufficiently ice-rich and air is warm, the slump headwall may retreat upslope at rates that range from one to tens of meters per year (Lantz and Kokelj 2008) until upslope sediments cover the headwall and it becomes thermally stable. Often, an area of the landscape may have a cluster of RTS, some actively exporting materials and some that have undergone stabilization (Bowden et al 2012). As permafrost thaws at the headwall, the soil organic layer is ripped apart and tumbles to the footslope, evacuation channel, or into the lake or river below, exposing mineral substrate that, once erosion ceases, is colonized by plants via seeds or spores (Bartleman et al 2001). Organic soil may also form islands or become buried in the slump floor, mud lobe (Lantuit and Pollard 2008), or evacuation channel (Lacelle et al 2010). Tall deciduous shrubs, in particular, tend to dominate plant recruitment once the substrate has stabilized (Lloyd et al 2003, Schuur et al 2007). A shift in vegetation dominance, from pre-disturbance graminoid to post-disturbance shrub, may determine the rate of recovery of C and N cycles after disturbance by impacting both biotic and abiotic controls (DeMarco et al 2011).
We examined the effects of thermo-erosional processes on the losses and re-accumulation of C and N pools in the organic layer and surface mineral soils of six spatially independent RTS sites on the North Slope of the Brooks Range and in Noatak National Preserve, Alaska, USA. Each site contained one to seven individual slumps that varied in time after erosional processes ended and plant succession was initiated. Our intention was to characterize the ecosystem-scale dynamics of surface C and N pools in arctic tundra undergoing a cycle of this disturbance, which is an important component of landscape-scale disturbance dynamics (Turner 2005). We did not examine the dynamics of C and N pools associated with deep permafrost soils and sediments. To estimate the amount of soil C and N displaced or lost from surface soils during the erosional period, we compared the element pools of surface soils in actively eroding or recently stabilized features with those in nearby undisturbed tundra. We expected that loss from the organic layer would be substantial but also expected that material from this layer would be mixed into mineral soil, leading to net gain at depth. We examined the recovery of C and N pools among disturbed sites that varied from 8 to more than 500 years in time after the initiation of plant succession. In addition, we also compared the abundance of tall shrubs and mosses across these sites. Due to the dominance of these two plant functional groups and the exposure of a deep active layer following disturbance, we expected that rates of C re-accumulation would be high, leading to a rapid recovery of the soil organic layer.
2. Materials and methods
2.1. Study sites
Five of the six RTS sites (NE-14, I-minus 1 and the Itkillik series) are located in the vicinity of the Toolik Field Station (TFS; 68.63 N, 49.60 W), which is 720 m above sea level in the foothills province of the Brooks Range, Alaska (figure 1, appendix figure A1, available at stacks.iop.org/ERL/9/075006/mmedia). Sites were accessed via helicopter from TFS or by foot from the Dalton Highway. Vegetation in this region includes moist acidic tundra (MAT) (tussock sedge, dwarf-shrub, moss tundra; Walker et al 2002), which is defined by the presence of the tussock-forming sedge Eriophorum vaginatum; moist non-acidic tundra (MNT) (non-tussock sedge, dwarf-shrub, moss tundra; Walker et al 2002), and low shrub tundra.

Figure 1. Distribution of study sites across upland arctic tundra, North Slope of the Brooks Range and Noatak National Preserve, Alaska, USA. Sites are indicated by symbols (see map key). Within sites, undisturbed tundra is indicated with 'C' and slumps of varying age are identified by numbers that correspond to site age class in table 1.
Download figure:
Standard image High-resolution imageThe fourth site (Loon Lake; 67.92 N, 161.96 W) is located in the vicinity of the Noatak National Preserve (NOAT), which is on the south slope of the Brooks Range in northwestern Alaska (figure 1). This site was accessed via bush plane from Kotzebue and then via helicopter from a central field camp. Although MAT and MNT dominate much of the NNP, the tree Picea glauca also occurs at low density (Suarez et al 1999).
To locate sites with RTS features, we used helicopter over-flights, aerial photographs, Google Earth images (2009), and field surveys. Re-vegetated sites at I-minus 1 were located with LiDAR (Krieger 2012). Once sites were identified, we visually classified individual RTS features within sites, henceforth referred to as slumps, as recently disturbed (observed active headwall migration and bare mineral soil exposed due to sediment movement), intermediate aged (mature tall shrubs and some moss cover established), and old (little to no mineral soil exposed and relatively continuous vegetation cover). The I-minus 1, NE-14, and Loon Lake sites had multiple slumps within each site. Itkillik sites 1–3 were more complex features, with several overlapping slumps. In each of these sites, we identified one unique slump that did not appear to have substantial overlap with other slumps. Slump ages (in years after stabilization) were assigned later based on dating of shrubs and soil organic matter (described below).
Within sites, all slumps were located on the same geologic surface: NE-14 and I-minus 1 on the drift of Itkillik phase II (till and ice-contact deposits), Itkillik series on undifferentiated lacustrine deposits, and Loon Lake on Holocene floodplain deposits (alluvium) (Hamilton 2003). Slumps within most sites were close (<500 m) so that the climate and the pool of organisms capable of colonizing were likely similar. The only exception was the Itkillik series, where the three slumps were located along the bank of the Itkillik River and separated by as much as 1 km.
Aspect and topography varied somewhat among slumps within sites. Although the three slumps in NE-14 had similar southern aspects, they differed in slope. The two older sites had ∼10% less slope than the active site due to stabilization of the headwalls. The three Itkillik series sites had southeastern aspects according to location on the Itkillik River, and slopes were similar among slumps. The I-minus 1 site is on the shore of the eponymous lake, and slumps 1–3 had northern aspects, while 4–7 had southern aspects. Slopes were similar among slumps. Finally, all Loon Lake slumps had northwestern aspects and similar slopes.
In all sites, undisturbed (control) tundra was randomly selected from the area surrounding the site for comparison. At NE-14, we selected two undisturbed areas over 500 m apart. At I-minus 1, we selected two undisturbed areas on the south (250 m apart) and one on the north aspect of the lake. For the Itkillik series, we paired an undisturbed area with each disturbed slump. Only one undisturbed area was sampled in Loon Lake because of helicopter time constraints. In almost all cases, undisturbed sites were on gently sloping surfaces that were upslope of and similar in aspect to their attendant slumps.
Within the center of the slump floor (Lantuit and Pollard 2008) of each disturbed slump or in the undisturbed area, we established a 50 m by 4 m belt transect along the contour, where we sampled soils and surveyed vegetation. We sampled a larger area (50 × 10 m along the above transect) for shrub and soil age. If the disturbed slump was not wide enough to fit a single 50 m transect, two parallel transects were established that covered the same 200 or 500 m2 area. Our primary goal within each slump was to sample the slump floor zone that was not currently affected by active deposition of new material from the headwall or sidewalls or by inundation from the associated lake or river. GPS coordinates were recorded for each transect (appendix table A1).
For NE-14, Itkillik and Loon Lake sites, the vegetation of the surrounding undisturbed tundra was classified as MNT: non-tussock sedge, dwarf-shrub, moss tundra, with peaty non-acidic soils (Walker et al 2002). Frost boils (barren patches of cryoturbated soil) were common. Vegetation at the I-minus 1 site was classified as MAT (Walker et al 2002). Vegetation within disturbed slumps was variable but was dominated by deciduous shrubs (Salix alexensis, S. pulchra, S. glauca, and Betula nana).
2.2. Age of disturbed slumps
In tundra, shrub rings can be used to date vegetation establishment in much the same way as they are used in forest stands (Johnstone and Henry 1997, Rayback and Henry 2005). We sampled tall (>0.5 m height) shrubs from the slumps, excavating shrub bases to the root-shoot interface (root collar) to determine whether this was located in the mineral soil. We presumed that shrubs with root collars in the mineral soil colonized the surface from seed once erosive disturbance ended. We counted growth rings at the root collar to determine age. Eighty percent of the shrubs sampled were from species that were not present in the undisturbed tundra. The oldest shrub and mean shrub age, then, is an estimate of when sediment stabilized and plant colonization via seed began. It is not meant to reflect the age of the entire disturbance feature and likely only represents a minimum slump age since erosional activity can persist for years after the initial slope failure (Lantz et al 2009).
In the older slumps where the moss and soil organic layers had re-accumulated, we also measured the radiocarbon age of moss macrofossils at the base of the recovering soil organic layer. Like shrubs rooted on mineral soil, we assumed that moss bodies at the organic-mineral soil interface colonized after substrate stabilization so again, these ages are likely to represent minimum slump age.
In disturbed slumps, all tall deciduous shrubs (>50 cm height) were inventoried along the 50 × 10 m belt transect. Shrub species encountered included Salix alexensis, S. pulchura, and S. glauca. Out of these species, only S. pulchra and S. glauca were present in undisturbed tundra (but in prostrate, <50 cm tall growth forms). In disturbed slumps, more than 10% of individuals were randomly selected for root collar excavation, and only plants that were embedded in the mineral soil were harvested. A few shrubs >0.5 m tall were rooted in buried organic material, presumably coming from residual patches of undisturbed tundra that had 'rafted' into the slump on moving sediment; these were excluded from our survey. Lastly, in Loon Lake slump 5, we aged dead stems of P. glauca that were rooted in the mineral soil because tall shrubs were absent from the transect. We measured the radiocarbon age of the outermost rings of the stems and added the years after death to the age estimated by ring count.
We used ring number at the root collar to estimate the age of each individual tall shrub. Stems were cleaned and sliced into three horizontal sections. Only the bottom-most section where growth rings were clearly differentiated was used for aging. Sections were dried at 60 °C until they reached a constant mass, sanded using progressively finer grades of sandpaper (180, 220, 320, 400 and 600 grit), and then scanned at 2400 dpi to determine the number of growth rings using an image analyzing system (Windendro™, Basic 2009, Regent Instruments Canada). Three transects (center to edge) were counted on each stem and averaged per stem. Where ring boundaries were difficult to discern, a stereoscope was used to confirm software accuracy. For the P. glauca from Loon Lake, basal stem sections of three different individuals (∼10 cm basal diameter) were used and processed similarly to shrub stems.
To determine the basal age of soil organic layers in sites where they had accumulated, we relied on both radioactive decay and bomb curve calibration methods (Osterkamp et al 2009, Trumbore 2009). We selected well-developed moss colonies from the shrub sampling area. At 10 m intervals, a pit was dug through the organic and into the mineral soil, and a profile was removed from the wall. Profiles were selected when there was no evidence of mixing of the mineral and organic layer, as might be expected during active erosion. Five soil profiles were collected from each stable site and a subset were analyzed (table 1).
Table 1. Mineral soil exposure, shrub age, and basal age of soil organic layer in retrogressive thaw slumps across six sites in upland arctic tundra, Alaska, USA.
| Shrubs | Basal soil organic layer | ||||||||||
|---|---|---|---|---|---|---|---|---|---|---|---|
| Site | Slump | Mineral soil exposure (%) | Mean age (yr) | n | SE | Oldest (yr) | Δ14C‰ | n | SE | Age (yr) | Time after disturbance (age class) |
| Itkillik 1 | 1 | 100 | 6.8 | 6 | 0.4 | 8 | — | — | — | — | Recent |
| Itkillik 2 | 1 | 33 | 6.4 | 10 | 0.4 | 7.5 | — | — | — | — | Recent |
| Itkillik 3 | 1 | 33 | 34.4 | 7 | 4.8 | 54.3 | — | — | — | — | Intermediate |
| I-minus 1 | 1 | 83 | 5.8 | 7 | 0.6 | 8 | — | — | — | — | Recent |
| 2 | 83 | 12.2 | 12 | 0.9 | 16 | — | — | — | — | Recent | |
| 3 | 67 | 19.3 | 7 | 1.2 | 25 | 66.2 | 3 | 0.58 | 53.3 | Recent | |
| 4 | 17 | 30.5 | 5 | 1.8 | 37 | 118.4 | 3 | 21.9 | 28.3 | Intermediate | |
| 5 | 83 | — | — | — | — | 97.9 | 3 | 0.58 | 52.7 | Recent | |
| 6 | 17 | — | — | — | — | −46 | 2 | 67.2 | 380 |
Old | |
| 7 | 0 | — | — | — | — | −34.4 | 2 | 300 | 472 |
Old | |
| Loon lake | 1 | 50 | 2.3 | 4 | 0.3 | 3 | — | — | — | — | Recent |
| 2 | 67 | 10.6 | 5 | 3.5 | 22.0 | — | — | — | — | Recent | |
| 3 | 67 | 29.6 | 5 | 1.1 | 32.8 | — | — | — | — | Recent | |
| 4 | 50 | 44.6 | 4 | 9.4 | 64.3 | 116.1 | 2 | 6.4 | 14.5 | Intermediate | |
| 5 |
50 | 238.3 | 3 | 43.4 | 302 | −61.4 | 2 | 28.3 | 565 | Old | |
| NE-14 | 1 | 57 | 4.8 | 2 | 0.3 | 5 | — | — | — | — | Recent |
| 2 | 0 | 25.2 | 29 | 1.3 | 42 | 300.3 | 2 | 13.4 | 27.5 | Intermediate | |
| 3 | 0 | 29.3 | 25 | 1.5 | 45.8 | 178.7 | 2 | 1.4 | 22.0 | Intermediate | |
aAlternative radiocarbon age = 518 yr. bAlternative radiocarbon age = 325 yr. c Picea glauca dead stems. See text for methods.
Soil profiles were wrapped in tinfoil to maintain structure, frozen, and shipped on ice to the University of Florida for processing. Mineral and organic layers were separated, and the organic layer was sectioned into 1.75 cm deep layers starting at the mineral-organic interface. Moss macrofossils were removed from the deepest (A) and second deepest (B) 1.75 cm increment by hand and their identity was confirmed under a dissecting scope. Macrofossils were purified to holocellulose (Gaudinski et al 2005), which was combusted, purified to CO2, and converted to graphite (Dutta et al 2006, Vogel et al 1987). 14C content was analyzed at the University of California-Irvine W M Keck Carbon Cycle Accelerator Mass Spectrometer Laboratory.
When Δ14C values were above zero indicating bomb radiocarbon, we converted them to calendar age by referencing Δ14C against the high northern latitude atmospheric radiocarbon record (Hua and Barbetti 2004, Pries et al 2012). Samples where the B increment was more enriched in 14C than the A increment were assigned to the ascending slope of the bomb peak (<1966), while samples where the B section was more depleted than the A section were assigned to the descending slope (>1966) since moss/organic soils accumulate vertically in these systems (Mack et al 2011). When Δ14C values were below zero, we converted them to calendar age using the InCal09 calibration dataset in Calib 6.0 (Stuiver et al 2010).
In addition to shrub and radiocarbon aging, we also incorporated mineral soil exposure (%) in our age classification because it indicates whether active erosion is still occurring. Slumps within each of the six sites were assigned to four age classes according to exposure of mineral soil and time after disturbance: recent (more than 50% cover of mineral soil in soil transects; 1–33 years), intermediate (less than 50% cover of mineral soil; 33–60 years), old (no mineral soil exposed, headwall slope still visible, and >60 years), and control (undisturbed tundra). We chose 33 years and 50% mineral soil exposure as the division between recent and intermediate slumps because sites <33 years old and this much exposure of mineral soil indicated sediment movement, while slumps >33 years had more continuous vegetation cover. Intermediate sites had less than 50% of mineral soil exposure, which indicated more stable sediment.
2.3. Soil C and N pools
Along each transect, we sampled surface soils at 10 m intervals and took additional measurements of organic layer depth at 5 m intervals. At each sample point, we dug a ∼30 × 30 cm pit to the organic-mineral interface and removed an organic profile from the exposed wall with a knife. Mineral soil was sampled from the organic-mineral interface to 15 cm depth in the mineral soil with a 7 cm internal diameter corer. Soils were wrapped in tinfoil to preserve structure and returned on ice to the lab at TFS where preliminary processing took place. Here, we sectioned organic soils into depth increments (0–5 cm and 10 cm increments thereafter) with an electric knife. Each increment was weighed and homogenized by hand to remove >2 mm diameter coarse woody debris, roots, rhizomes, and rocks. Gravimetric water content was determined by drying organic soils at 60 °C for 48 h and mineral soils at 110 °C for 48 h.
We measured soil pH on a 1:1 ratio of air-dried, homogenized soil and DI water. The mixture was allowed to settle for 30 min before submerging a calibrated pH electrode (Thermo Orion, Beverly, MA, USA) for measurement.
To determine bulk soil C and N content, a subsample of the homogenized soil fraction was dried at 60 °C for 48 h, ground to a fine powder on a Wiley-mill (Thomas Scientific, Swedesboro, NJ, USA) with a #40 mesh screen, and analyzed using an ECS 4010 elemental analyzer (Costech Analytical, Valencia, CA, USA).
Soil bulk density was calculated for each organic and mineral soil depth increment as the mass (g) per unit volume (cm3) of <2 mm dry soil. Carbon and N pools were calculated for each depth increment as the element concentration times the bulk density scaled to a meter squared. Total organic layer pool is the sum of all depth increments within a profile; total mineral soil layer pool is the sum of all depth increments within the top 15 cm of the mineral layer. Organic layer bulk density was calculated as an average for each profile by dividing the summed soil mass by the summed volume. Total layer %C and %N were similarly calculated for each profile by dividing the summed C or N pool by the summed soil mass. Total layer pH was calculated for each profile by (1) multiplying hydrogen ion concentration in each layer by the mass of soil in the layer, (2) summing the layers, and (3) dividing the sum by the total soil mass. Statistics were performed on hydrogen ion concentrations and back-transformed to pH for reporting.
To estimate loss or gain of soil C or N caused by disturbance, we compared pools in organic and mineral layers of the disturbed slumps (recent, intermediate, and old) to those in the paired, undisturbed areas. Note that this estimate of loss or gain does not necessarily represent transfer of soil C or N to the atmosphere. The disturbance event may have mixed soil organic matter deep (>15 cm) into the mineral soil or redistributed it to the mud lobe or nearby aquatic ecosystems. Our sampling was not designed to determine the mass balance of surface soils in the entire slump; rather our goal was to characterize loss and gain in the relatively homogeneous conditions of the slump floor and to determine the initial conditions from which successional processes originated. This is, by design, a study at the ecosystem-scale, not the landscape-scale.
2.4. Vegetation
We measured tall shrub (>0.5 m height) and moss presence or absence with a point-intercept method at 0.5 m intervals in 5 m bins along each undisturbed or disturbed transect (n = 10, in our nested model n = 3, table 1).
2.5. Statistical analyses
The four age classes in which we classified slumps (control, recent, intermediate, and old) were included as 'treatments' in our model, and we considered site to be the level of replication. These classes represent the time of stabilization and initiation of succession. Organic and mineral soils were analyzed separately, and all response variables were transformed to fit the assumption of normality (table 2). We used a three-way, mixed-effects nested ANOVA to test for the effects of treatment on all soil characteristics (organic layer depth, pH, C and N content, C:N, bulk density, and C and N pools) that included treatment nested within slump, nested within site (random). The same model was used to analyze total (organic plus mineral) soil C and N pools and tall shrub and moss proportional contribution to vegetation cover. Post-hoc Tukey HSD tests were performed to test for differences among age classes in each analysis.
Table 2. Statistics (F and P values) for the effect of age on surface soil characteristics and tall shrub and moss proportional contribution (proportion of sample locations along transects that contained tall shrubs and mosses) in six RTS sites in upland arctic tundra, Alaska, USA. All measurements were analyzed separately by soil layer, using a split-plot mixed ANOVA with 'age' (control (undisturbed tundra), recent (1–33 yr), intermediate (33–60 yr), and old (>60 yr)) nested within slump and slump nested within site (random factor). Age (recent, intermediate, and old slump and undisturbed) was included as a separate fixed factor. Test statistics with P < 0.05 are indicated in bold.
| Layer | Characteristic | Data transformation | F | P |
|---|---|---|---|---|
| Organic layer | Organic layer depth (cm) | Rank | 8.2 | <0.001 |
| pH | Rank | 4.1 | 0.022 | |
| Bulk density (g cm−3) | Square root | 0.8 | 0.5 | |
| %C | Arcsine square root | 0.6 | 0.6 | |
| %N | Arcsine square root | 1.8 | 0.2 | |
| C:N | Log10 | 0.98 | 0.4 | |
| C pool (g m−2) | Rank | 5.2 | 0.006 | |
| N pool (g m−2) | Rank | 3.9 | 0.02 | |
| Mineral soil | pH | Rank | 5.3 | 0.008 |
| Bulk density (g m−2) | Square root | 3.3 | 0.052 | |
| %C | Arcsine square root | 1.5 | 0.25 | |
| %N | Arcsine square root | 3.1 | 0.06 | |
| C:N | Log10 | 1.2 | 0.33 | |
| C pool (g m−2) | Rank | 1.0 | 0.4 | |
| N pool (g m−2) | Rank | 2.5 | 0.09 | |
| Total (org + min) | C pool (g m−2) | Log10 | 2.4 | 0.09 |
| N pool (g m−2) | Log10 | 1.1 | 0.4 | |
| Vegetation | Tall shrub proportional contribution | Box Cox (λ = 0.5) | 5.4 | 0.006 |
| Moss proportional contribution | Square root | 3.6 | 0.04 |
To examine which within-site differences were driving the main effects in the full nested ANOVA, we conducted a separate one-way ANOVA for each site and a posteriori Dunnett's tests to compare each age class to undisturbed tundra. In this analysis, we used soil profiles as the replicate unit, and thus our inferences are more limited. To visually represent these differences, we subtracted C or N pools in each disturbed age class from paired undisturbed tundra. Propagated error was calculated with the formula:

where f = a − b, Ua is the standard error of the pools in the disturbed slump, and Ub is the standard error of the pools in the undisturbed tundra at each site.
To estimate rates of C and N re-accumulation in the soil organic layer after disturbance ended, we examined the relationship between time after disturbance ended (log10-transformed years) and pool size using least squares regression. Because no single Itkillik site had more than one measured slump, we combined the three sites into one model after normalizing for differences in pre-disturbance pool sizes. This was only done for estimates of C and N re-accumulation; for all other statistical analyses, these sites were considered separate. We also normalized means for pre-disturbance pool sizes for I-minus 1, where slumps 1–3 and 4–7 were paired with separate undisturbed transects due to differences in aspect. In sites where we detected a significant relationship between time and pool size, we calculated the annual rate of C or N accumulation for two time frames: 10–50 years or 50–100 years of time after disturbance.
All statistical analyses were done in JMP, version 10.0 (SAS Institute Inc., Cary, NC, USA).
3. Results
3.1. Age of disturbed slumps
We used both shrub dendrochronology and radiocarbon dating of moss macrofossils at the base of the newly-formed soil organic layer to estimate when soil erosional processes ended and plant regeneration was initiated in the slumps. We classified slumps within sites into either recent (1–33 years maximum shrub age), intermediate (34–60 years maximum shrub age), or old (older than 60 years maximum shrub age) time after disturbance (table 1). The youngest sites were aged based on oldest shrub as moss or soil organic layers had not yet developed, and mean and oldest shrub ages produced equivocal results.
In the subset of the intermediate age class where we dated moss macrofossils (where moss was present), radiocarbon ages were not always consistent with shrub age at the decadal scale as might be expected given the different vegetation processes giving rise to establishment. In I-minus 1 slump 4 and NE-14 slumps 2 and 3, mean radiocarbon ages were similar to the mean shrub ages. In I-minus 1 slump 3, however, radiocarbon ages of individual moss profiles were 20 and 30 years older than mean and maximum shrub age. The additional fact of high mineral soil exposure (>50%) further supports the idea that shrub age is a better estimate of the disturbance age at this slump. In contrast, Loon Lake slump 4 radiocarbon age was 50 and 30 years younger than maximum and mean shrub age, respectively. We conservatively assigned this slump to the intermediate age class since both shrub and radiocarbon ages were <60 years but >10 years and mineral soil exposure was 50%.
Finally, a subset of sites did not have shrubs. In Loon Lake slump 5, we aged P. glauca trees in addition to moss macrofossils. Trees were approximately 200 years younger than the average moss radiocarbon age (565 years). In I-minus 1 slumps 6 and 7, radiocarbon values had multiple possible calendar ages due to the particular pattern of variation in atmospheric radiocarbon during those time intervals (Heaton et al 2009), but despite this uncertainty, all mosses were definitely >200 years old. None of these sites had mineral soil exposure greater than 50% and were therefore classified as old.
3.2. Soil characteristics
Across sites, the organic layer depth of recently disturbed slumps was reduced by a factor of four relative to undisturbed tundra (tables 2 and 3). Organic layer was only present in 30 ± 13% (mean ± 1 SE) of the sampling points, on average, in recently disturbed slumps. When it was present, it tended to be in large, tumbled piles still supporting vegetation from the undisturbed tundra. The depth of the layer increased with time after disturbance as new soil organic matter accumulated and was not different between old (>60 years) sites and undisturbed tundra (table 3). Bulk density, C and N concentration, and C:N ratio did not differ among age classes, but soil pH tended to be more basic in all age classes of disturbed slumps than in undisturbed slumps (tables 2 and 3, appendix table A2).
Table 3. Mean (±SE) surface soil characteristics for undisturbed tundra, recent (1–33 yr), intermediate (33–60 yr), and old (>60 yr) slumps within six RTS sites in upland arctic tundra, Alaska, USA. Values with different superscript letters were significantly different at P < 0.05.
| Slump | |||||
|---|---|---|---|---|---|
| Layer | Characteristic | Undisturbed | Recent | Intermediate | Old |
| Organic layer | Organic layer depth (cm) | 12.7 (1.4)a | 2.9 (0.9)b | 7.6 (1.2)ab | 7.5 (1.2)ab |
| pH | 5.4 (0.14)a | 6.2 (0.3)ab | 6.6 (0.17)b | 6.7 (0.18)ab | |
| Bulk density (g · cm−3) | 0.16 (0.02) | 0.23 (0.05) | 0.19 (0.04) | 0.15 (0.01) | |
| C (%) | 33.5 (1.1) | 31.5 (1.2) | 30.9 (1.1) | 31.4 (1.7) | |
| N (%) | 1.7 (0.07) | 1.9 (0.1) | 1.6 (0.08) | 1.9 (0.1) | |
| C:N | 22.4 (1.6) | 17.7 (1.8) | 20.4 (1.2) | 16.8 (1.1) | |
| Mineral soil | pH | 5.8 (0.13)a | 6.9 (0.14)b | 6.7 (0.12)b | 6.3 (0.13)ab |
| Bulk density (g cm−3) | 0.9 (0.06) | 1.1 (0.05) | 0.8 (0.08) | 0.8 (0.1) | |
| C (%) | 4.4 (0.9) | 3.2 (0.6) | 4.9 (0.8) | 4.5 (0.9) | |
| N (%) | 0.3 (0.06) | 0.2 (0.04) | 0.3 (0.05) | 0.3 (0.05) | |
| C:N | 13.8 (0.5) | 15.7 (0.7) | 14.4 (0.4) | 13.3 (0.5) | |
3.3. Surface soil C and N pools
In recently disturbed slumps, soil organic layer pools were three times smaller than in undisturbed tundra, suggesting an average loss of about 3000 g C and 200 g N m−2 (table 2, figure 2) or 48% and 52% of pre-disturbance C and N, respectively. This effect was attributable to significant reductions in organic layer pools in Itkillik 1, I-minus1, and Loon Lake relative to undisturbed tundra (figure 3). Reduced pool sizes were primarily caused by reduced organic layer thickness since bulk density and carbon or nitrogen concentration differed only marginally between recently disturbed and undisturbed tundra (table 3).
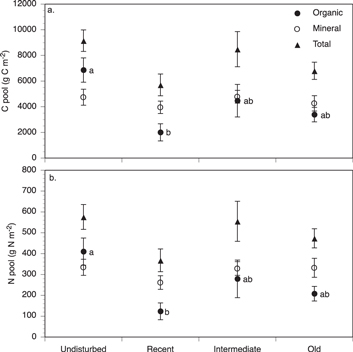
Figure 2 Mean (±SE) organic, mineral (to 15 cm depth) and total soil C (a) and N (b) pools in undisturbed tundra and slumps of three age ranges (recent (1–33 yr), intermediate (33–60 yr), and old (>60 yr)) across six RTS sites. Values with different letters were significantly different at P < 0.05 (mineral and total pools were similar across the four age ranges).
Download figure:
Standard image High-resolution image
Figure 3. Average change in soil organic layer C (a) and N (b) pools due to disturbance across six RTS sites in arctic tundra. Change in C or N pool was calculated as the difference between pool size in the undisturbed tundra and recent, intermediate or old slumps in each site. Error bars represent propagated error. +P < 0.1, *P < 0.05, **P < 0.01, and ***P < 0.001.
Download figure:
Standard image High-resolution imageWe did not detect evidence that C or N pools from the organic soil layer were transferred to the surface mineral soil during the initial disturbance process or that C or N accumulated in these pools over time. Carbon and N pools in the top 15 cm of mineral soil were similar between undisturbed tundra and disturbed slumps (table 2, figures 2 and 3).
Organic layer C and N pools in intermediate and old age classes were, on average, half of those in undisturbed tundra but were not significantly different than undisturbed pools when analyzed with sites as the unit of replication (figure 3, appendix table A3). Within site analyses (with profiles as replicates) revealed that pools in the intermediate age class of I-minus 1 were lower than those in paired undisturbed tundra (figure 3, appendix table A3). The intermediate slumps of Loon Lake, NE-14 and Itkillik 3, and the old slumps in I-minus and Loon Lake did not differ from undisturbed tundra.
Increase in C and N pools over time was detectable in I-minus 1 and Loon Lake, the two sites that had old slumps (figure 4). During the first 60 years of recovery, 42 g C and 3.3 g N m−2 yr−1 accumulated in the soil organic layer of I-Minus 1, while 23 g C and 1.2 g N m−2 yr−1 accumulated at Loon Lake. Between 60 and 300 years, rates slowed to 8 g C and 0.6 g N for I-Minus 1 and 5 g C and 0.2 g N m−2 yr−1 for Loon Lake, respectively.

Figure 4. Re-accumulation of soil organic layer C (a) and N (b) pools over time after initiation of secondary succession. Each point represents mean C or N pool for each different-aged slump in six sites. Note that the three Itkillik sites were grouped into one series. Regression analyses were done separately for each site using log-transformed time as the independent variable (x-axis was back-transformed for figure). Regression analysis was significant at P < 0.1 for I-minus 1 and Loon lake sites (lines shown).
Download figure:
Standard image High-resolution image3.4. Vegetation
Tall deciduous shrubs increased in abundance initially after disturbance but were not different than undisturbed tundra in the old slumps (table 2, figure 5). Moss cover was substantially reduced in recently disturbed slumps but increased to undisturbed levels in intermediate and old slumps (table 2, figure 5).

Figure 5. Mean proportion (±SE) of sampling locations along vegetation transects that contained tall shrubs and mosses in slumps of four age classes (undisturbed tundra, recent (1–33 yr), intermediate (33–60 yr), and old (>60 yr)) across six sites. Different letters indicate a significant difference between age ranges at P < 0.05.
Download figure:
Standard image High-resolution image
4. Discussion
Soil disturbance associated with the formation of RTS causes profound structural and functional changes in tundra ecosystems (Bowden 2010, Lantz and Kokelj 2008). In our study, RTS resulted in an average loss of 3 kg C and 0.2 kg of N m−2 from the surface organic layer, corresponding to 48% and 52% of pre-disturbance C and N pools, respectively (table 2, figure 2). We did not detect evidence for mixing of C and N into the surface mineral layer; pools of these elements were similar across mineral soils in undisturbed and disturbed sites (table 2, figure 2). Our surface measurements, however, do not rule out mixing of surface soils to depths greater than our sampling, or in other parts of the slump, such as the evacuation channel. Recently disturbed slumps had four times thinner organic soil layer compared to undisturbed tundra (tables 2 and 3), with an average of 70% of mineral soil exposure (table 1). Correspondingly, moss cover was reduced (figure 5(b)) as was organic soil horizon habitat for plants, animals, and other soil organisms (Graham et al 2012). Ground insulation and infiltration was also likely reduced (Lantz et al 2009, Osterkamp et al 2009). In addition, both organic and mineral soils in recently disturbed sites had higher pH (table 3) probably due to mixing of deeper, less weathered soil materials into surface soils as well as reduced organic acid loading (Bohn et al 2001, Lantz et al 2009).
Carbon loss from surface soils during RTS formation was larger than losses reported for thermokarst subsidence (e.g., Schuur et al 2009) or combustion in a rare tundra wildfire (Mack et al 2011). The fate of lost C in our study, however, may not necessarily be return to the atmosphere as in these other studies. Some of the displaced surface soil is likely to have been buried deeply in mineral sediments or accumulated in the evacuation channel, lake, or river downslope from the area of the slump that we studied. Inputs of terrestrial organic matter to lakes may be stabilized in anaerobic sediments (Walter et al 2007), while in streams or rivers, rapid aerobic processing may result in rapid return to the atmosphere (Kokelj et al 2013). Surface soils may have been mixed more deeply into mineral soil than we sampled, which was constrained by the depth of seasonal thaw. If surface soils mix with deep sediments during RTS formation and headwall collapse or during transport through the evaculation channel (Lacelle et al 2010) then this disturbance may behave similarly to cryoturbation frost boils, patches of barren or sparsely vegetated mineral soil formed by differential frost heave (Michaelson et al 2012, Walker et al 2004). Cryoturbation may also bury large amounts of organic matter deeply in the mineral soil, sequestering as much as 70% of local surface soil C pools below the active layer after surface stabilization (Michaelson et al 1996, Walker et al 2004). Deep burial may stabilize soil organic matter through sorption on minerals or freezing as the active layer thins.
A key question for ecosystem-level C cycling is how much of surface soil organic matter pools displaced by RTS formation is moved to aerobic surface environments where decomposition proceeds (Koven et al 2011, Pries et al 2012, Schuur and Abbott 2011, Schuur et al 2008), churned into deeper soils where they are stabilized by mineral interactions or freezing (Koven et al 2009), or exported to aquatic ecosystems (Kokelj and Burn 2005, Kokelj et al 2013, Ping et al 2011). Schädel et al (2014) used long-term aerobic laboratory incubations to estimate potential C loss from tundra soils and concluded that 2% of total soil organic C would be lost over one year, 13% over 10 years, and 26% C over 50 years at a constant temperature of 5 °C. Based on these estimates and the fact that field temperatures are not maintained throughout the year, maximum loss via decomposition can only account for one quarter of soil C loss over 50 years. This suggests that we have not constrained the dominant fate of displaced surface soil C in our study. Future sampling of deep, frozen soils and estimates of transfer to lakes or rivers is needed to account for the fate of this organic matter.
Most slumps showed a significant reduction in soil C and N pools between undisturbed and recent (3–33 years) age classes. By the intermediate age, however, we could not detect differences between disturbed and undisturbed slumps (figure 3, appendix table A3). This soil organic layer recovery was contemporaneous with increased shrub and moss abundance, which was highest in intermediate sites (figure 5). On average, 1.4 kg of C m−2 and 0.1 kg of N m−2 had recovered by year 50 across all sites. However, these results should be interpreted with caution; recovery over the first 50 years was highly variable across sites: low in I-minus 1 and NE14, intermediate in Loon Lake, and high in the Itkillik series (figure 4). Thus, no difference in recovery may reflect a type II error due to the low sample size of intermediate and old aged sites, rather than rapid re-accumulation. Overall, our estimates of C and N re-accumulation in the soil organic layer were 32.3 g of C m−2 yr−1 and 2.2 g of N m−2 yr−1 over the first 60 years, and 6.5 g of C m−2 yr−1 and 0.5 g of N m−2 yr−1 from year 60 to 300 (figure 4), which are comparable to some but lower than other published estimates of C or N accumulation rates in arctic tundra. Pries et al (2012), for example, estimated an annual average C accumulation of 25.8 g C m−2 in surface soils in Healy, Alaska, while Bockheim et al (2004) estimated a much higher rate of C accumulation of 267 g C m−2 yr−1 in young (0–50 yr), and 60 g C m−2 yr−1 in medium-aged (50–300 yr) thermokarst lake basins after drainage.
Surface N pools displaced during RTS disturbance were substantial and could constrain future plant productivity. Nitrogen inputs to undisturbed North Slope tundra ecosystems from atmospheric deposition (0.008–0.06 g N m−2 yr−1) and biological N fixation (0.1 g N m−2 yr−1) are low (Hobara et al 2006). Based on these estimates of inputs alone, it would take 1250 years for N to re-accumulate to pre-disturbance levels. Our estimated rate of N pool recovery in the organic soil layer, however, indicates a much higher rate of re-accumulation: 2.2 g of N m−2 yr−1 over the first 60 years. These results suggest that N is re-accumulating from sources different than in undisturbed tundra. One possibility is that tall shrubs are harvesting N from deep in the soil profile via their larger, deeper root systems. A second possibility is that the concave shape of the RTS results in concentration of dissolved organic matter and ions from undisturbed tundra, functioning similar to water tracks (Shaver et al 2014). Finally, biological N fixation may be higher in RTS than in undisturbed tundra. Because most N fixation is carried out by lichen or moss-associated diazotrophs, high quality shrub litter and a shift in the moss community may enhance fixation activity relative to undisturbed tundra. Although N loss from surface pools may significantly constrain productivity immediately after thermokarst disturbance, N seems to recover relatively fast as tall shrubs and mosses increase in abundance in disturbed sites.
Parallel to C and N dynamics, RTS disturbance drove rapid changes in vegetation structure. Tall deciduous shrubs, which establish from wind-dispersed seeds on exposed mineral soils (Frost et al 2013), dominated plant communities 30–60 years after disturbance (figure 5). In particular, Salix glauca, S. hastata, S. pulchra, and Betula nana were taller and more abundant inside RTS features than in undisturbed tundra. Species common to disturbed surfaces like gravel bars and road construction sites (i.e., Salix alaxensis) (Lantz et al 2010) were only present in RTS features. These changes in vegetation composition have profound effects on ecosystem processes. For instance, previous studies have shown that net primary productivity of shrub tundra (780 g biomass m−2 yr−1) is almost twice than that of moist acidic tussock tundra (430 g m−2 yr−1) (Shaver and Chapin 1991). Tall shrubs produce high quality leaf litter, and soils from shrub tundra cycle N more rapidly than soils from graminoid tundra (DeMarco et al 2011). Shrubs may also trap snow, insulating soil from heat loss during winter and increasing soil temperature and rates of N turnover (Sturm et al 2005). These internal plant-soil feedbacks could therefore reinforce high nutrient availability and high productivity by maintaining high rates of turnover after disturbance (Myers-Smith et al 2011).
Moss abundance was initially reduced by more than 50% due to disturbance but recovered to the level of undisturbed tundra by 30–60 years after slumps stabilized (figure 5). In addition to changes in abundance, mosses in undisturbed tundra were highly diverse (14 species), whereas in disturbed sites moss communities were dominated by two species of feather mosses (Hylocomium spendens and Pleurozium schrebrei). These changes coincided with the recovery of soil organic layer (table 3), which could be partially driven by the accumulation of recalcitrant moss litter (Hobbie et al 2000). The oldest sites were dominated by graminoids and had low tall shrub abundance, mirroring the vegetation in undisturbed tundra. Plant community composition appeared to recover after long-term succession, but these results should be interpreted with caution because we had limited representation of disturbed areas over 60 years of age. Furthermore, recently disturbed sites may not adequately represent the history of older sites due to directional change in climate (Walker et al 2006).
A major methodological puzzle in our study was determining how to assign an age to each disturbed feature. Based on shrub dendrochronology and radiocarbon dating of moss macrofossils, we estimated that the 16 slumps across six sites varied between 7.5 and 565 years in age (table 1). Given that both shrubs and mosses recruit only after substrate stabilization and RTS may experience active erosion for years (Lantz et al 2009), these two methods most likely represent a minimum time after the initiation of the disturbance event. However, as expected given the vegetation processes that give rise to shrub and moss establishment, estimates by these two methods were not always consistent at the decadal-scale. For instance, while age estimates were similar for NE14 across the two methods, they varied in I-minus 1 and Loon Lake (table 1). Thus, using only one of these methods would have given very different age estimates. Incorporating percent mineral soil exposure (bare ground) in addition to shrub and moss age estimates allowed us to detect a number of slumps where erosion was still active and to better assess time of thaw slump stabilization. For example, slumps 3 and 5 in the I-minus 1 thermokarst were determined to be 53 years old (14C age), but both had more than 50% of mineral soil exposure, therefore appearing to still be actively eroding. These results support previous studies showing that disturbance in thaw slumps may persist for decades and even longer (Lantz et al 2009). We recommend future studies also take into account this or a similar measurement of erosional activity in addition to shrub dendrochronology or radiocarbon aging. Finally, application of high resolution remote sensing may help to better constrain slump age.
5. Conclusions
Thermokarst disturbances are predicted to increase in frequency as the climate of arctic ecosystems continues to warm (Lantz and Kokelj 2008). The RTS disturbances that we studied displaced 3 kg C and 0.2 kg N per m−2 from surface soils. The fate of displaced pools is uncertain, but estimates of maximum loss via aerobic decomposition can account for loss of only 1/4 this pool over the first 50 years after surface stabilization. The fate of the remaining displaced C could include stabilization in deep soils or in anaerobic lake environments or alteration and decomposition in rivers or streams. Recovery of surface soil pools after disturbance was relatively rapid: the C and N pools of disturbed slumps were not distinguishable from undisturbed tundra after 30–64 years. Nitrogen re-accumulation rates were higher than expected from external N inputs alone, suggesting that either N acquisition from deep soils, lateral transport of N, or enhanced biological N fixation may play an important role in ecosystem recovery. Finally, RTS formation caused plant community dominance to shift from graminoids to tall deciduous shrubs, a shift likely to increase rates of primary productivity, biomass accumulation, and nutrient cycling (DeMarco et al 2011). Future research should determine the fate of displaced surface soil C and N pools, balancing soil element loss with changing vegetation pools to estimate the net effect of slump formation on surface dynamics. Finally, these structural changes are likely to impact dynamics of the active layer, so the challenge for further research at the ecosystem-scale will be to integrate surface dynamics with the thaw, decomposition, and release of permafrost C and N pools.
Acknowledgments
We would like to thank Camilo Mojica, Garrett Arnold, Kira Taylor-Hoar and many undergraduates at the University of Florida for their assistance in the field and the lab. This study was supported by NSF grant OPP-0806271 to MCM and EAGS.