

Abstract
In January 2013, a severe regional haze occurred over the North China Plain. An online-coupled meteorology-chemistry model was employed to simulate the impacts of aerosol–meteorology interactions on fine particles (PM2.5) pollution during this haze episode. The response of PM2.5 to meteorology change constituted a feedback loop whereby planetary boundary layer (PBL) dynamics amplified the initial perturbation of PM2.5. High PM2.5 concentrations caused a decrease of surface solar radiation. The maximal decrease in daily average solar radiation reached 53% in Beijing, thereby leading to a more stable PBL. The peak PBL height in Beijing decreased from 690 m to 590 m when the aerosol extinction was considered. Enhanced PBL stability suppressed the dispersion of air pollutants, and resulted in higher PM2.5 concentrations. The maximal increase of PM2.5 concentrations reached 140 μg m−3 in Beijing. During most PM2.5 episodes, primary and secondary particles increased simultaneously. These results imply that the aerosol–radiation interactions played an important role in the haze episode in January 2013.
Export citation and abstract BibTeX RIS

Content from this work may be used under the terms of the Creative Commons Attribution 3.0 licence. Any further distribution of this work must maintain attribution to the author(s) and the title of the work, journal citation and DOI.
1. Introduction
While aerosol-radiation interactions (ARI) are clearly very important in the context of climate change Boucher et al (2013), they also can have profound impacts on atmospheric chemistry and meteorology on short time scales in areas with high aerosol loading. Radiation scattering and absorption by atmospheric aerosols directly affect surface and air temperature along with semi-direct effects or rapid adjustments such as changes in atmospheric stability and cloud cover. Thus, consideration of ARI is not only important for climate models but also for numerical weather prediction and air quality models.
To assess ARI, several online-coupled meteorology and chemistry models have been developed and applied (e.g. Jacobson 1994, Jacobson et al 1996, Jacobson 1997a, 1997b, Grell et al 2005, Wong et al 2012). Their development and applications have been reviewed by Zhang (2008), Grell and Baklanov (2011), Kukkonen et al (2012), Lee and Ngan (2011), Zhang et al (2012), El-Harbawi (2013), and Baklanov et al (2014). The impacts of aerosols on surface solar radiation, temperature profile, planetary boundary layer (PBL) stability, moisture, winds and precipitation have been analyzed using online models (Zhang et al 2007, Zhang et al 2010, Fan et al 2012). However, most of these studies focused on the change of meteorological parameters, but rarely mention that this modification of meteorology further increases the concentration of fine particulate matter with aerodynamic diameter equal to or less than 2.5 μm (PM2.5).
The rapid response of meteorology and air quality to aerosol effects during wildfires has been examined (Grell et al 2011, Fu et al 2012, Jiang et al 2012, Wong et al 2012). It has been reported that high aerosol concentrations would cool the surface, heat the atmosphere, increase the boundary layer stability, and suppress the dispersion of PM2.5 (Andreae et al 2004, Koren et al 2004, Feingold et al 2005, Grell et al 2011, Wong et al 2012, Ding et al 2013). Some studies have reported the delay or reduction of precipitation by changing cloud process (Andreae et al 2004, Koren et al 2004, Feingold et al 2005, Tosca et al 2010, Grell et al 2011, Ding et al 2013). Reduction of O3 due to the reduction of solar radiation was also reported (Jiang et al 2012, Wong et al 2012). In China, PM2.5 concentrations during haze episodes could reach similar levels or even higher than those during wild fire episodes (Li et al 2013, Liu et al 2013, Zhang et al 2013), and haze episodes show different characteristics. First, the ratio of light-absorbing carbon in PM2.5 is lower than that during wild fires (Andreae et al 2004, Feingold et al 2005, Grell et al 2011, Jiang et al 2012, Ding et al 2013). Second, the wild fire itself may cause perturbations in the meteorological system because of the additional heat release. Therefore, aerosol effects during haze episodes could be strong and with different characteristics. Studies on aerosol effects during haze episodes are quite limited (Quan et al 2013, Wang et al 2014).
In January 2013, a severe regional haze episode with daily PM2.5 exceeding 500 μg m−3 occurred over the North China Plain, which offered an opportunity to investigate the aerosol effects on meteorology and air quality. In this study, the two-way coupled WRF and Community Multi-scale Air Quality Model (CMAQ) system (WRF-CMAQ) was employed to explore the interactions between aerosols and meteorology and resulting effects on air pollutant concentrations during this severe winter haze episode. This study quantifies the feedback loop between PM2.5 and meteorology, which can narrow the gap between models and observations of air pollution in January 2013, and thus helps improve our understanding of winter haze episodes.
2. Model configuration and observational data sources
2.1. Model configuration
The two-way coupled WRF-CMAQ system consists of three components: WRF version 3.4 developed by US National Center for Atmospheric Research, CMAQ version 5.0 developed by US Environmental Protection Agency and an inter-model coupler. Detailed information about the two-way coupled WRF-CMAQ system can be found in Wong et al (2012). The WRF model configuration include the WRF single-moment 6-class microphysics scheme (Hong and Lim 2006), version 2 of the Kain-Fritsch cumulus cloud parameterization (Kain 2004), the Asymmetric Convective Model version 2 for the PBL (Pleim 2007a, 2007b), the RRTMG radiation mechanism and the Pleim–Xiu land-surface model (Pleim and Xiu 1995 and Xiu and Pleim 2001) with indirect soil moisture and temperature nudging (Pleim and Xiu 2003, Pleim and Gilliam 2009). The CMAQ model is configured using the AERO6 aerosol module and the CB05 gas-phase chemical mechanism. Although interactions between particulate matter and meteorology include ARI and aerosol–cloud interaction, only ARI is considered in this study.
The modeling domain, as shown in figure 1, covers most of China and part of East Asia with 36 km × 36 km grid resolutions. Both WRF and CMAQ use 23 vertical layers. The model simulation period is from 1 to 31 January 2013. The configurations of chemical initial conditions and boundary conditions, domain configuration, and emission inventory are consistent with our previous papers (Zhao et al 2013a, 2013b). In order to quantify the ARI, two scenarios, with shortwave feedback (SF) and without feedback (NF) are simulated.

Figure 1. CMAQ modeling domain at a horizontal grid cell resolution of 36 km over China. The red frame shows the modeling domain and the black dots show the cities selected in this study. The colors show the emission intensity of PM2.5.
Download figure:
Standard image High-resolution image2.2. Observational data sources
Observed PM2.5 hourly mass concentrations at Tianjin, Shijiazhuang and Jinan in the North China Plain are obtained from China National Urban Air Quality Real-time Publishing Platform (http://113.108.142.147:20035/emcpublish/). For a given city, PM2.5 hourly mass concentration is represented by the average of data from all monitoring sites located in the city. Since the PM2.5 data in Beijing are not included in this platform until January 17th, the observed data from State Key Joint Laboratory of Environmental Simulation and Pollution Control, Peking University is used instead. The locations of those cities are shown in figure 1. Daily total solar radiation observation data at Beijing and Tianjin are downloaded from China Meteorological Data Sharing Service System (http://cdc.cma.gov.cn/). The observed PBL height data is limited in China, therefore, PBL heights obtained from the Global Data Assimilation System (GDAS) (Rolph 2013) are used. GDAS is assimilated by surface observations, balloon data, wind profiler data, aircraft reports, buoy observations, radar observations, and satellite observations. It includes analyses at 00:00, 06:00, 12:00, and 18:00UTC and forecast fields at three hours after each analysis. The UTC time is converted to China Standard Time by adding 8 h to Beijing Time in China.
3. Results and discussion
3.1. Impact of feedback on meteorology
3.1.1. Impact of feedback on surface solar radiation
The simulated and observed surface solar radiation data at Beijing and Tianjin are shown in figures 2(a) and (b), respectively. The simulated and observed daily total solar radiation were calculated by integrating the hourly surface solar irradiance from 0:00 to 23:59. At the Beijing site, the correlation coefficient (R) of simulated surface solar radiation for NF scenario and observed surface solar radiation is 0.35. The normalized mean bias (NMB) is 0.70. For SF scenario, R is 0.55 and NMB is 0.25, shown in table 1. At the Tianjin site, R of simulated surface solar radiation for NF scenario and observed surface solar radiation is 0.55. The NMB is 0.90. For SF scenario, R is 0.82 and NMB is 0.3. These results indicate that the model with aerosol feedbacks better captured the trend and magnitude of surface solar radiation.

Figure 2. Simulated and observed surface solar radiation data for Beijing (a) and Tianjin (b), in January 2013. The black line with dots, blue dashed line and the red solid line show the observed solar radiation, simulated surface solar radiation in NF scenario and simulated surface solar radiation SF scenario, respectively.
Download figure:
Standard image High-resolution imageTable 1. Observed and modeled average surface solar radiation, PBL height, and PM2.5 in Beijing, Tianjin, Shijiazhuang and Jinan in January 2013.
| Variable | City | OBS | NF | SF | NMBNF | NMBSF | (SF-NF)/NF(%) |
|---|---|---|---|---|---|---|---|
| Surface solar radiation (MJ m−2) | Beijing | 6.23 | 10.61 | 7.81 | 0.70 | 0.25 | −26.39 |
| Tianjin | 5.36 | 10.17 | 6.97 | 0.90 | 0.30 | −31.47 | |
| PBL height (m) | Beijing | 692.71 | 552.37 | −20.26 | |||
| PM2.5 mass concentration (μg m−3) | Beijing | 148.30 | 119.87 | 143.66 | −0.19 | −0.03 | 19.85 |
| Shijiazhuang | 300.09 | 197.88 | 227.11 | −0.34 | −0.24 | 14.77 | |
| Tianjin | 155.91 | 112.18 | 125.52 | −0.28 | −0.19 | 11.89 | |
| Jinan | 227.13 | 166.58 | 190.88 | −0.27 | −0.16 | 14.58 |
The difference between surface solar radiations of NF and SF scenarios is due to the column accumulation of aerosol extinction. The simulated daily average reduction of total surface solar radiation in January was 2.8 MJ m−2 and 3.2 MJ m−2 for Beijing and Tianjin, respectively, which translates into 26% and 31% reduction of surface solar radiation. Detailed statistical information is shown in table 1. The maximal reduction for Beijing and Tianjin occurred on 10, 11 and 19 January, consistent with periods when high PM2.5 concentration were recorded (figure 4). The maximal reduction reached 5.9 and 7.1 MJ m−2 for Beijing and Tianjin, respectively, representing 53% and 65% of daily solar radiation in NF scenario, a dramatic modification of surface solar radiation. Solar radiation absorbed by the surface of the Earth, heats the bottom of the atmospheric column producing convective eddies that transport heat and water vapor upward driving the growth of the PBL (Lee and Ngan 2011). The decrease of solar radiation leads to a decrease daytime PBL height.
3.1.2. Impact of feedback on PBL height
Simulated and GDAS diurnal average PBL heights for Beijing are shown in figure 3. NMB for simulated PBL height of NF scenario compared to GDAS was 0.2. With SF scenario, the NMB decreased to −0.04. The aerosol extinction affects the PBL temperature in two ways, as shown in figure S1. On the surface, it causes a decrease of surface solar radiation, which leads to a decrease of surface temperature. Meanwhile, the absorption of light-absorbing particles such as black carbon (BC) increases the temperature of the upper PBL. This process enhances the temperature inversion during the haze episode and leads to a more stable PBL. During the daytime, PBL height of the NF scenario is higher than the SF scenario. Peak PBL height of the NF simulation is 690 m but the SF scenario is only 590 m. The lower PBL height suppresses vertical mixing and dispersion of the pollutants, which in turn results in higher concentrations.

Figure 3. Simulated and assimilated diurnal average PBL height in Beijing, January 2013. The blue dashed line and the red solid line show the PBL heights of NF and SF scenario, respectively. The gray box shows the GDAS data. The central rectangle spans the first quartile to the third quartile. The segment inside the rectangle shows the median. The whiskers above and below the box are the 5th and 95th percentiles. According to the Sunrise and sunset time in Beijing in January 8:00–17:00 is defined as daytime and the other is defined as nighttime.
Download figure:
Standard image High-resolution image3.1.3. Impact of feedback on temperature, wind speed and humidity
The daily average temperature, wind speed, and humidity of east China in January 2013 are given in figures S2–S4. For a wide range of spatial and temporal scale, such as east China, the surface temperature decreases due to the reduced surface solar radiation, which is caused by aerosol extinction. The wind speed is slightly decreased, due to the reduction of driving force and more stable PBL. The decreased wind speed also suppressed the dispersion of pollutants. However, no significant differences were observed on humidity between NF and SF scenarios for east China.
3.2. Impact of feedback on PM2.5 pollution
Figure 4 shows the simulated and observed hourly average PM2.5 mass concentrations in January 2013. NMB of PM2.5 mass concentrations for the NF scenario is −0.19, −0.34, −0.28 and −0.27 for Beijing, Shijiazhuang, Tianjin and Jinan, respectively. Simulations of NF scenario matched well with the observations when PM2.5 concentrations were low. However, during heavily polluted periods, the simulated PM2.5 in the NF scenario is significantly underestimated. For the hours when observed data were over 300 μg m−3, the PM2.5 in NF scenario showed 40%, 46%, 22% and 46% underestimation for Beijing, Shijiazhuang, Tianjin and Jinan, respectively.
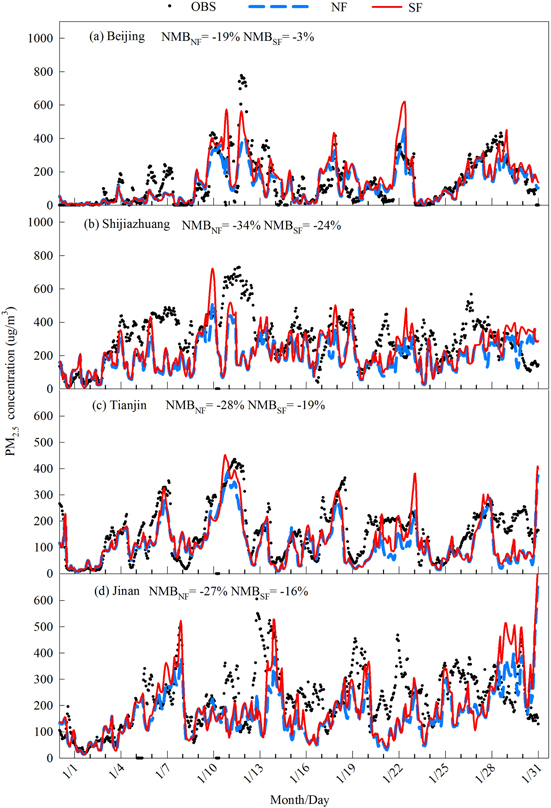
Figure 4. Hourly average PM2.5 mass concentrations for Beijing (a), Tianjin (b), Shijiazhuang (c) and Jinan (d) in January 2013. The black dots, blue dashed line and the red solid line show the observed PM2.5 concentrations, PM2.5 simulations in NF scenario and PM2.5 simulations in SF scenario, respectively.
Download figure:
Standard image High-resolution imageConsidering the aerosol feedback, the NMB of simulated PM2.5 mass concentrations for the SF scenario are −0.03, −0.24, −0.19 and −0.16 for Beijing, Shijiazhuang, Tianjin and Jinan, respectively. Although PM2.5 concentration in the SF scenario was still underestimated due to uncertainties in secondary organic aerosol mechanism in CMAQ Baek et al (2011), the model performance was largely improved. Taking Beijing as an example (figure 4(b)), PM2.5 mass concentrations in both NF and SF scenarios are similar during low concentration periods. For heavily polluted periods (9–11th, 18–19th and 28–30th), however, the PM2.5 mass concentrations in the SF scenario are much higher than those in the NF scenario and closer to the observed data. The difference of PM2.5 mass concentrations between the NF and SF scenarios gets larger as the PM2.5 pollution gets worse. For the hours when observed data were greater than 300, the PM2.5 in SF scenario showed 23%, 37%, 10% and 36% underestimation for Beijing, Shijiazhuang, Tianjin and Jinan, respectively. The maximal increase of PM2.5 in the SF scenario over the NF scenario is 140 μg m−3 during the simulation period. The data for other cities have similar trends, implying that the aerosol feedback should not be neglected when modeling severe haze episodes.
Figure 5 shows the difference of hourly average PM2.5 species mass concentrations between SF and NF scenarios for Beijing from 12 January to 24 January 2013. The average increases of PM2.5 mass concentration from NF to SF scenario are 6.2, 2.3, 5.5, 2.7, 8.1, and 14.0 μg m−3 for NO3−, SO42−, NH4+, EC, OC and other species, respectively. Compared with NF scenario, NO3−, SO42−, NH4+, EC, OC and other species grew 20.4%, 15.2%, 18.5%, 30.3%, 30.2% and 33.5%, respectively. The increase for Shijiazhuang, Tianjin and Jinan is shown in table S1. It was found that primary particles (EC, part of OC and others) and secondary particles (NO3− SO42− NH4+ and part of OC, the secondary OC is rather small compared with primary OC in simulation) increased simultaneously. However the ratio of primary particles increase was larger than that of secondary particles, which implied that the growth mechanism of primary and secondary PM2.5 mass concentration were not identical. The vertical mixing of air pollutants was suppressed due to the lower PBL height (as discussed in section 3.2), which caused the increase of both primary and secondary particle levels. The decrease of PBL height and wind should have similar impact on primary and secondary PM2.5. However, the mechanism for secondary PM2.5 increase was more complicated. Figure S5 shows that the ozone concentration is reduced in most places of China. The ozone reduction region is consistent with the solar reduction region and the free radicals reduction region. It indicates that the reduction of solar radiation leads to a decrease of photo-reaction rate. The formation of free radicals is suppressed and atmospheric oxidation is reduced. The reduced atmospheric oxidation decreases the formation of secondary PM2.5. On the other hand, decreased surface temperature, shown in figure S1, also decrease the rate atmospheric aerosol formation reaction. The dispersion suppression and reduction of formation rate lead to a smaller growth ratio of secondary particles.

Figure 5. Difference of hourly average PM2.5 species between SF and NF scenario (SF-NF) for Beijing from 12 January to 24 January 2013. The blue, red, green, yellow, black, and gray area show the difference of nitrate (NO3−), sulfate (SO42−), ammonia (NH4+), organic carbon (OC), elemental carbon (EC), and other species mass concentration between SF and NF scenario, respectively.
Download figure:
Standard image High-resolution image
4. Conclusion
This study demonstrates the feedback loop during haze episodes whereby aerosols affect meteorology through changes in radiation and PBL dynamics thereby increasing PM2.5 concentrations. The high PM2.5 levels affect the temperature of the PBL in two ways. At ground-level, PM2.5 pollution causes a decrease of surface solar radiation, which leads to a decrease of surface temperature. Meanwhile, the absorption of light-absorbing particles such as BC increases the temperature of the upper PBL. This process enhances the temperature inversion during the haze episode, leading to a more stable PBL. Enhanced PBL stability initiated by aerosols suppresses the vertical mixing and dispersion of the air pollutants, resulting in higher PM2.5 concentrations. These results imply that the aerosol feedback shall not be neglected when simulating heavy haze episodes. Considering such feedback loop helps bridge the gap between model simulations and observations.
Due to the feedback loop, the initial perturbation due to emissions could be amplified. Emissions of PM2.5 and its precursors could enhance the adverse meteorological conditions for dispersion of pollutants and finally result in extremely high pollution events. This implies that ARI play an important role in understanding the evolution of the winter haze episodes in China. Additionally, during haze episodes, emission reduction measures may be particularly effective.
Acknowledgments
This work was sponsored by National Natural Science Foundation of China (21221004), MEP's Special Funds for Research on Public Welfares (201309009 and 201409002), Strategic Priority Research Program of the Chinese Academy of Sciences (XBD05020300) and special fund of State Key Joint Laboratory of Environment Simulation and Pollution Control (12L05ESPC). The authors also appreciate the support from the Collaborative Innovation Center for Regional Environmental Quality and support from Prof Michael B McElroy and Mr Chris Nielsen of China Project, School of Engineering and Applied Science, Harvard University. We thank Weidong Guo, Scott Voorhees, and Xueying Zhang for their helpful discussion.