

Abstract
Societal dependence on insects for pollination of agricultural crops has risen amidst concerns over pollinator declines. Habitat loss and lack of forage have been implicated in the decline of both managed and native pollinators. Land use changes in the Northern Great Plains of the US, a region supporting over 1 million honey bee colonies annually, have shifted away from historical grassland ecosystems bees rely on for forage toward landscapes dominated by corn, soybeans, and other row crops. We investigated how land use impacts honey bee colony population size during the growing season and subsequent colony population size for almond pollination in central California the following February. We provide estimates of how land use affects beekeeper economics by linking summer habitat with pollination service payments and later production of new colonies. Our results demonstrate that a greater presence of non-bee foraged agricultural crops surrounding apiaries in the summer results in smaller colonies by the end of the growing season. Apiaries with colonies exhibiting smaller population size in the autumn were also smaller during almond pollination the following spring; impacting the beekeeper with a reduced per-colony rental fee for pollination services and reduced potential for creating new spring colonies, based on prior growing season land use. This study highlights the downstream effects of factors driving land use decisions on the ability of beekeepers to provide robust honey bee colonies to support the pollination industry on a national scale. It also demonstrates the direct linkages between habitat in the Northern Great Plains, bee health, and pollination services rendered elsewhere in the US.
Export citation and abstract BibTeX RIS

Original content from this work may be used under the terms of the Creative Commons Attribution 3.0 licence.
Any further distribution of this work must maintain attribution to the author(s) and the title of the work, journal citation and DOI.
Introduction
In the United States, managed honey bee colonies (Apis mellifera L.) deliver the bulk of pollination services to pollinator-dependent crops, with an estimated value of $12 billion USD annually [1]. Despite their contribution to agricultural productivity, honey bees and the beekeeping industry alike face immediate and long-term socioeconomic, political, and ecological challenges [2–4]. Beekeeper annual colony losses have remained relatively high over the past decade since Colony Collapse Disorder was characterized [5], averaging over 30% since 2006 [e.g. 6–9]. Numerous stressors of honey bee colonies have been identified, and may be broadly grouped into three interacting categories, including pesticide exposure [10–12], the effects of parasites and diseases [13, 14], and the nutritional impacts of land use, land-use change, and forage availability [15–18].
The growth of the almond industry in the California Central Valley has substantially contributed to the economic profitability of the honey bee pollination industry over the past two decades. Planted area of almonds in California has doubled from 200 000 to >400 000 hectares between 2000–2015 [19, 20]. Almonds, completely dependent on insect pollination, are a top agricultural export in California worth over $5 billion USD annually [20]. The recommended honey bee colony stocking density for pollinating almonds is five to six colonies per hectare (2–2.5 colonies per acre) [21]. Approximately 2–2.5 million colonies were required to pollinate almonds in 2015; representing ≈75% of the 3 million colonies in the entire US [22]. Rental rates per colony for almond pollination have risen from around $56 in 2000 to $140–200 USD in 2015, depending on the average population size (frames of bees) among colonies in a beekeeper's operation [23–25].
A large proportion of US honey bee colonies (30%–40%) reside across the northern great plains (NGP) region during the growing season [22]. This spatiotemporal decoupling of summering grounds (NGP) and primary pollination service locales (California Central Valley) underlines the importance of informing sound national policy decisions on the issues of agricultural productivity, land use, conservation, and pollinator health [26, 27]. In addition to pollinating California almonds and other crops across the country, colonies positioned in the NGP contribute substantially to US honey production, a crop worth $326 million USD in 2015 [28]. Further, many NGP beekeepers support and service other sectors of the beekeeping industry such as producing package bees and splitting colonies; wherein robust colonies are divided into a number of smaller colonies and each is provided with a new queen bee. Given the elevated annual colony losses experienced by beekeepers over the past several years, splitting colonies is an important management mechanism allowing beekeepers to replenish their individual lost stocks, while selling excess colonies to other beekeepers across the country to make up their annual losses. Thus, the NGP region plays a critical role in supporting multiple sectors of the beekeeping industry in addition to honey and crop production across the country.
Over the past decade, land use conditions have shifted dramatically across the NGP where grassland habitat has been converted to corn and soybeans [29, 30], crops of little value as bee forage. These changes are in part driven by high commodity crop prices, reduced conservation funding, and subsidies for liquid biofuel production [29, 31]. Landscapes dominated by intensive corn and soy agriculture have been shown, on a limited scale, to negatively impact the health and survival of honey bee colonies [21, 32]. Beekeepers typically situate their colonies near pastures and grasslands, areas that provide an abundance of flowering resources [16, 32]. The expansion of corn and soybeans in the NGP has reduced pollinator forage habitat through loss of grassland and bee-foraged crops [16, 33, 34]. Loss and conversion of forage habitat in the NGP may pose serious risks to honey bees and threaten the economic solvency of the commercial beekeeping industry, almond and other pollinator-dependent crop industries, and US food security [35, 36].
Grassland habitat in the NGP supports the growth of herbaceous forbs, woody shrubs, and flowering trees honey bees rely on for nectar and pollen throughout the growing season [37, 38]. A steady, abundant supply of nutritional resources are required for honey bee colonies to grow, produce a honey crop, and overwinter successfully [39–41]. Landscape and forage quality influence the physiological health of honey bee colonies [17, 42] which modulates the effects of interactions with parasites and pathogens of honey bees [43, 44] resulting in differential health and survival outcomes [45, 46]. An additional benefit of grassland habitat for pollinators is a more limited exposure risk profile from agricultural pesticides [11, 47, 48], and limited degradation of forb communities occurring near agricultural fields where herbicides are pervasively used [49, 50].
In this study, we quantify the impacts of summer land use in the NGP on the health and population size of honey bee colonies during the fall and spring almond crop pollination season. Specifically, we quantify (1) the relationship between growing season land use and colony health and population size, and the resulting economics of (2) the differential rental rates for pollination services, and (3) the profitability of subsequent beekeeper management strategies and techniques (i.e. producing split colonies after almond pollination).
Materials and methods
Apiary site selection and land use quantification
We selected research apiaries across a grassland-agriculture gradient representative of the NGP (figure 1). Our previous work suggests that beekeepers tend to avoid corn, soybeans, and other row crop, and favor areas with more grassland when establishing apiaries in the NGP [16]. Thus we expected these land covers to be related to bee health. In Geospatial Modelling Environment Version 0.7.4.0, we extracted grassland area from the 2014 National Agricultural Statistic Survey (NASS) Cropland Data Layer (CDL) (https://nassgeodata.gmu.edu/CropScape/) within a 5 km radius [37] of 18 363 active apiaries in the North Dakota (n = 11 629) and South Dakota (n = 6734) Departments of Agriculture 2014 apiary registration databases (data accessed 12 January 2015). The state of Minnesota does not document apiary locations, so we instead acquired coordinates for each of the collaborating beekeeper's apiaries and similarly quantified land use around each one. We chose NASS CDL because it provides annual land cover data and reliable classification of the dominant row crops in our region. (www.nass.usda.gov/Research_and_Science/Cropland/docs/MuellerICASVI_CDL.pdf).
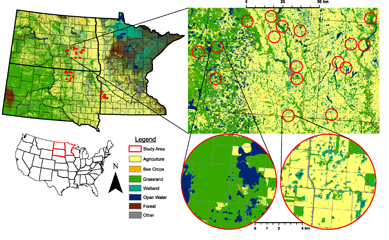
Figure 1. Map depicting 2015–2016 study region land use, locations of apiaries in North Dakota, South Dakota, and Minnesota, and two example North Dakota apiaries. Apiaries are located at the center of each 4 km radius circle. Land covers in the Other category include developed and barren land. Land covers in the Agriculture category include corn, soybean, and small grains.
Download figure:
Standard image High-resolution imageIn R (Core Team 2015, packages rgdal, rgeos, raster, sp), we calculated the mean and standard deviation of the apiary grassland distribution and assigned apiaries to distinct bins representing low (< x̅ ˗ 1 sd), average (x̅ ± 1 sd), and high (> x̅ + 1 sd) area of grassland. We defined potential study apiaries as those owned by participating commercial beekeepers operating across the NGP that were (1) active in 2014, (2) registered/used in North Dakota, South Dakota, or Minnesota, and (3) within 100 km of field crew home stations to ensure monitoring cycles could be completed. From these potential apiaries, we used ArcMap 10.3 to randomly select a subset of five study apiaries across the three grassland bins in order to have equal sampling across the land use gradient. This resulted in 15 established apiaries per state that reflected grassland distribution around apiaries in the NGP, east of the Missouri River. After consulting with collaborating beekeepers on site locations, this list was pared down to ten apiaries in each of the study states. We also used six additional apiaries in North Dakota that have been part of an ongoing colony monitoring study since 2009 [17, 32]. Thus, there were 36 apiaries included in the study in each of the two study years, 2015–2016. Two apiaries from 2015 were not used by the collaborating beekeepers in 2016, so two alternative apiaries were selected from the previous list of potential apiaries.
Land use around the selected study apiaries was quantified within a 4 km (2.5 mi) radius of each apiary from 2015 and 2016 NASS CDLs using Geospatial Modelling Environment Version 0.7.4.0 and R (packages rgdal, rgeos, raster and sp). This area encompassed approximately 5000 hectares (ha) of land; representative of the foraging range of a typical honey bee colony [51]. Individual CDL land use categories (SI table 1 available at stacks.iop.org/ERL/13/084016/mmedia) were combined into one of four analyzed composite groups sharing similar characteristics indicative of their potential benefit to honey bees (figure 2): (1) Agricultural area in non-honey bee forage (Ag) that included corn, soybeans, and small grain crops (wheat, barley, rye, sorghum, oats, millet); (2) Grassland (Grass) that included grassland, conservation lands, pasture, fallow land, wildflowers, and hay land; (3) Bee crops, including alfalfa, canola, and sunflower; and (4) Wetlands, including both herbaceous and woody wetlands.

Figure 2. Land use within a 4 km radius around 36 study apiaries, 2015–2016. Apiary names on the y-axis are ordered vertically from highest to lowest area (ha) of agriculture (corn, soy, small grains) around North Dakota (ND), South Dakota (SD), and Minnesota (MN) apiaries.
Download figure:
Standard image High-resolution imageHoney bee colony health assessments
The collaborating beekeepers populated selected apiaries with colonies each spring (late May) in each year of the study (2015 and 2016). We selected and labeled twelve colonies in each apiary with a typical population size for June in the NGP (no less than five frames of bees), exhibiting no overt disease symptoms, and having a viable, laying queen. Health assessments were conducted on all research colonies within the first two weeks of June, and again during the first two weeks of September. In each colony, an estimate of the adult population size was obtained as the number of frames of bees in the colony completely occupied by adult bees [52]. Population data from each frame in each colony were recorded as such and frames and bees were additionally examined for the presence of a number of disease symptoms, including Chalkbrood, American Foulbrood, Deformed Wing Virus, and Parasitic Mite Syndrome. Queen status was definitively determined via visual observation of the queen or via observed presence of eggs. Further, end-of-season queen status notation was made during September health assessments with potential entries including, (1) Queenright (a present, fertile, laying queen), (2) Drone-layer (laying only unfertilized drone eggs), (3) Laying worker (absence of a queen with stereotypical worker-laid egg pattern), and (4) Virgin/New queen (Queen present, but in the absence of eggs and young brood). Varroa infestation was determined from eight colonies per apiary to arrive at an average apiary level September Varroa mite load [17, 53]. The number of colonies per apiary exhibiting disease or queen events/problems were used below as model predictors (SI table 2).
Treatments to control Varroa mites (a.i. amitraz) and Nosema spp. (a.i. fumagillin) were applied to all colonies by the beekeepers in the study apiaries in spring, fall, and winter, as per their typical management practices. Additionally, all colonies were provided with sugar syrup and protein patties in spring, fall, and winter to stimulate colony growth and fortify colony nutritional stores as per typical practice of the collaborating beekeepers. In February, during almond bloom in California, the number of frames of adult bees was determined for each colony in the study.
The collaborating beekeepers maintained all living research colonies, regardless of size and strength, throughout the duration of experimentation, i.e. there was no culling or equalizing of live colonies during the experimental window (June through February almond pollination). For each apiary, we also calculated the proportion of research colonies that died from June through February (SI table 2). To avoid under-estimating the average colony size in apiaries experiencing colony mortality, we removed colonies that died during the course of the study from the analysis. This treatment of dead colonies facilitated the use of our model estimates to economically value the pollination services and colony splits of live colonies among apiaries. After almond orchard assessments, the collaborating beekeepers moved the colonies to subsequent overwintering or colony splitting locations before returning fresh colonies to NGP apiary locations the following spring.
Modeling the influence of land use and health metrics on apiary responses
For all analyses we treated each unique combination of apiary and year as the experimental unit (n = 72) and calculated average colony responses among research colonies in each apiary per study year. We considered apiaries to be nearly independent between years due to (1) difference in annual cropping patterns, (2) differences in annual weather, and (3) because each apiary received entirely new colonies each year. We initially considered models where colonies with zero frames of bees (dead colonies) were either included or removed prior to analyses. This alternative treatment of dead colonies did not result in a different interpretation of the magnitude of the land use effect in the models. Therefore, for the purposes of linear mixed effect modeling, and the subsequent economic valuation of apiaries, we elected to remove zeros (dead colonies) from statistical analyses. This treatment of dead colonies enabled us to apply model estimates (which included live colonies only) directly to the economic valuation of apiaries because beekeepers do not receive pollination payments for, and cannot create split colonies from, dead colonies.
We initially used simple linear regression to model the relationship between land use covariates and the change in adult bee population over the growing season, without specifying and partitioning any random effects. Those models indicated that the area of agriculture was the best predictor of adult population change. We then incorporated three random effects inherent in our study design into the models and employed linear mixed effect modeling to account for the variation derived from the specified random effects (including state, apiary, and study year). To examine the influence of land use on the health of colonies in a linear mixed modelling context, we considered two response variables: (1) '∆ SUMMER POP', and (2) 'ALMOND POP'. The ∆ SUMMER POP was defined as the average change in colony population size (measured as the change in number of frames of adult bees from June to September assessments within each live colony), per apiary and year, and ALMOND POP was defined as the average number of frames of adult bees per live colony at the time of almond pollination, per apiary and year. We used R v.0.99.464 (package lme4) for linear mixed effect modeling analyses and subsequently evaluated competing models using AICc, model weights, and 95% confidence intervals.
Predictors included the total hectares of agriculture (Ag), grassland (Grass), wetlands, and bee crops within a 4 km radius of each research apiary, September Varroa mite load per apiary, and whether a queen event (queenless, laying worker, drone layer, virgin queen) or disease symptom (Chalkbrood, American Foulbrood) was observed during September health assessments.
Economic valuation of apiaries
The realized colony rental rates for colonies in almonds vary depending on the nature of individual grower-beekeeper agreements, but a sliding scale that depends on a minimum or average colony size is common [24, 25]. For example, a 5–7 frame colony average in almonds may net $130–$150 per colony, while an 8–12+ frame colony average is worth $160–$200+. In the spring after almond pollination, colonies are moved out of almond orchards and beekeepers produce 'splits'; dividing strong colonies into a number of smaller colonies and providing each with a new queen. We used the beekeeper-reported colony split target size of 4 frames of bees and conservatively estimated the value of such a split (including a new queen) at $100.
Estimates produced by linear mixed effect modeling were used to examine the impact of growing season Ag area (ha) around apiaries on the average colony adult population size of live colonies for almond pollination and subsequent colony splitting. Across the observed land use gradient, this encompassed a difference of approximately 4000 ha (4200 ha Ag (a 'low-end' apiary) to 200 ha Ag (a 'high-end' apiary) within a 4 km radius). Model estimates for Ag and Grass were opposite each other owing to the overall dominance of those two land use categories (figure 2). We assigned dollar values to our observed and predicted apiary population size averages across the range of observed colony population sizes (SI table 3; 5–14 frames of bees, $130–$200 USD). This dollar value was multiplied by the product of the proportion of colonies surviving per apiary and apiary size (48 colonies, typical for the region) to arrive at the final estimated almond pollination dollar value per apiary. To determine the value of split colonies, we multiplied the average almonds frames of bees by the number of colonies per apiary (48 colonies) and the proportion of colonies surviving and available for making splits. This value was then divided by four (the target population size for splits) and multiplied by $100, the approximate value of a four-frame colony, to arrive at the estimated value per apiary in split colonies.
Results
Modeling the influence of land use and colony metrics on apiary responses
The results of the ∆ SUMMER POP model indicated that the area of Ag, or alternatively, Grass, were most supported (figure 3, table 1, ≤ 2 AICc from the top model) in influencing the change in adult population size over the growing season. The remaining models had declining support and coefficient confidence intervals overlapping zero. Models containing Ag or Grass encompassed 73% of the total model weight, further highlighting their importance as predictors among all models. As the area of Ag around apiaries increased, average colony population size went from increasing to decreasing over the growing season (figure 3). Each additional hectare of Ag resulted in a negative change of 0.0005 frames of bees per colony over the growing season. Alternatively, each additional hectare of Grass resulted in a positive change of 0.0005 frames of bees per colony over the growing season. Across the apiary land-use gradient (range: 200–4200 ha Ag) there was an approximate two frames of bees differential in relation to Ag or Grass area (figure 3).

Figure 3. Relationships between key land use features (agriculture (Ag: corn, soy, small grains) and grassland (Grass)) and colony population change over the growing season from the ∆ SUMMER POP model. Change in colony size was defined as the difference in adult population size (frames of bees) from June to September assessments.
Download figure:
Standard image High-resolution imageTable 1. ∆ SUMMER POP models of the impact of land use on growing season change in frames of bees. Land use was quantified as the number of hectares within a 4 km radius of each apiary. FOB = frames of bees.
| Response | Fixed effects | K | Log L | ΔICc | ΔAICc | w | Coefficients | ± 95% C.I. |
|---|---|---|---|---|---|---|---|---|
| Δ FOB | Intercept: 1.94 | (−0.10, 3.85) | ||||||
| June–September | Ag | 6 | −146.0 | 305.25 | 0.00 | 0.193 | Ag: −0.0005 | (−0.001, −0.0001) |
| Intercept: −0.18 | (−2.14, 1.79) | |||||||
| Grass | 6 | −146.3 | 305.84 | 0.59 | 0.144 | Grass: 0.0005 | (0.00006, 0.001) | |
| Intercept: 1.32 | (−1.11, 3.49) | |||||||
| Ag | 7 | −145.2 | 306.09 | 0.84 | 0.127 | Ag: −0.0004 | (−0.001, 0.00002) | |
| Bee crops | Bee crops: 0.004 | (−0.002, 0.01) | ||||||
| Intercept: −0.43 | (−2.64, 1.72) | |||||||
| Grass | 7 | −145.4 | 306.55 | 1.30 | 0.101 | Grass: 0.0004 | (−0.00004, 0.001) | |
| Bee crops | Bee crops: 0.005 | (−0.002, 0.01) | ||||||
| Intercept: 0.73 | (−1.89, 3.42) | |||||||
| Wetlands | 7 | −145.6 | 307.03 | 1.78 | 0.079 | Wetlands: −0.003 | (−0.007, 0.001) | |
| Bee crops | Bee crops: 0.006 | (−0.001, 0.01) | ||||||
| Intercept: 1.98 | (−0.27, 4.16) | |||||||
| Ag | 7 | −145.7 | 307.13 | 1.88 | 0.076 | Ag: −0.0004 | (−0.001, 0.0001) | |
| Wetlands | Wetlands: −0.002 | (−0.006, 0.003) | ||||||
| Intercept: 1.31 | (−1.079, 3.86) | |||||||
| Wetlands | 6 | −146.9 | 307.19 | 1.94 | 0.073 | Wetlands: −0.004 | (−0.007, 0.0001) | |
| Intercept: 0.08 | (−2.27, 2.33) | |||||||
| Bee crops | 6 | −146.9 | 307.21 | 1.96 | 0.073 | Bee crops: 0.007 | (−0.0003, 0.01) | |
| Intercept: 0.34 | (−1.94, 3.00) | |||||||
| Grass | 7 | −146.0 | 307.76 | 2.51 | 0.055 | Grass: 0.0004 | (−0.0002, 0.001) | |
| Wetlands | Wetlands: −0.002 | (−0.006, 0.003) | ||||||
| Intercept | 5 | −148.7 | 308.34 | 3.09 | 0.041 | Intercept: 0.65 | (−1.35, 2.62) | |
| Intercept: 0.09 | (−2.40, 2.87) | |||||||
| Grass | 8 | −145.1 | 308.51 | 3.26 | 0.038 | Grass: 0.0002 | (−0.0003, 0.001) | |
| Wetlands | Wetlands: −0.002 | (−0.006, 0.003) | ||||||
| Bee crops | Bee crops: 0.005 | (−0.002, 0.01) |
We did not observe a significant linear relationship between growing season land use and the proportion of colonies surviving to pollinate almonds per apiary (F1,70 = 0.71, r2 = 0.01, p = 0.40). Prior to modeling, we determined the incidences of bees symptomatic of deformed wing virus and parasitic mite syndrome were significantly correlated with Varroa infestation levels (Pearson correlation between Varroa level and deformed wings: t = 5.83, df = 70, p < 0.001, r = 0.57, 95% CI: 0.39, 0.71; parasitic mite syndrome: t = 7.5, df = 70, p < 0.001, r = 0.67, 95% CI: 0.52, 0.78) and were therefore not included in the set of ALMOND POP model predictors.
The most supported ALMOND POP model included the area of Ag, followed by the addition of the number of colonies with disease symptoms and September Varroa mite load, respectively (figure 4, table 2). As such, we observed direct overwinter influences of growing season land use, disease incidence and September Varroa levels on colony size for almond pollination. Models containing Ag encompassed 90%, while models containing disease or September Varroa levels accounted for 23% and 20%, respectively, of the total model weights. Each additional hectare of Ag again resulted in an average decrease of approximately 0.0005 frames of adult bees per colony. Across the apiary land use gradient, this represents a two frames of bees differential in adult bee population for almond pollination in relation to Ag area alone.
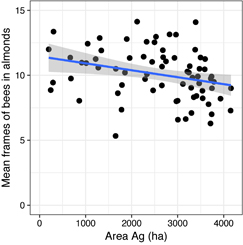
Figure 4. ALMOND POP model relationships between land use (agriculture (Ag: corn, soy, small grains)) and adult honey bee population size (frames of bees) during almond pollination.
Download figure:
Standard image High-resolution imageTable 2. ALMOND POP models of the impact of Ag (corn, soy, small grains) land use, September Varroa mite levels, the number of colonies per apiary with queen events, and disease symptoms on the population size for almond pollination. Land use was quantified as the number of hectares of Ag within a 4 km radius of each apiary. Varroa mite load was log-transformed prior to analyses. Models > 2 AICc from the intercept-only model are not listed due to lack of evidence supporting them as plausible models. FOB = frames of bees.
| Response | Fixed effects | K | Log L | AICc | ?AICc | w | Coefficients | ± 95% C.I. |
|---|---|---|---|---|---|---|---|---|
| Almonds | Intercept: 11.29 | (9.62, 12.92) | ||||||
| FOB | Ag | 6 | −143.1 | 299.40 | 0.00 | 0.395 | Ag: −0.0005 | (−0.001, −0.0001) |
| Intercept: 11.44 | (9.76, 12.95) | |||||||
| Ag | 7 | −142.8 | 301.36 | 1.96 | 0.148 | Ag: −0.0005 | (−0.001, −0.0001) | |
| Disease | Disease: −0.09 | (−0.36, 0.16) | ||||||
| Intercept: 11.41 | (9.64, 13.29) | |||||||
| Ag | 7 | −143.0 | 301.75 | 2.35 | 0.122 | Ag: −0.0005 | (−0.001, −0.0001) | |
| Varroa | Varroa: −0.15 | (−1.02, 0.73) | ||||||
| Intercept: 11.27 | (9.58, 12.93) | |||||||
| Ag | 7 | −143.0 | 301.84 | 2.44 | 0.116 | Ag: −0.0005 | (−0.001, −0.0001) | |
| Q event | Q event: 0.03 | (−0.40, 0.45) | ||||||
| Intercept: 11.54 | (9.77, 13.31) | |||||||
| Ag | 8 | −142.8 | 303.82 | 4.42 | 0.043 | Ag: −0.0005 | (−0.001, −0.0002) | |
| Varroa | Varroa: −0.13 | (−1.01, 0.173) | ||||||
| Disease | Disease: −0.09 | (−0.36, 0.17) | ||||||
| Intercept: 11.42 | (9.73, 12.96) | |||||||
| Ag | 8 | −142.8 | 303.88 | 4.48 | 0.042 | Ag: −0.0005 | (−0.001, −0.0001) | |
| Disease | Disease: −0.09 | (−0.36, 0.17) | ||||||
| Q event | Q event: 0.03 | (−0.02, 0.16) | ||||||
| Intercept | 5 | −146.5 | 303.95 | 4.55 | 0.041 | Intercept: 9.94 | (8.45, 11.40) | |
| Intercept: 11.39 | (9.59, 13.31) | |||||||
| Ag | 8 | −143.0 | 304.28 | 4.88 | 0.034 | Ag: −0.0005 | (−0.001, −0.0001) | |
| Varroa | Varroa: −0.15 | (−1.02, 0.73) | ||||||
| Q event | Q event: −0.02 | (−0.41, 0.45) |
Economic valuation of apiaries
The 2 frame greater population average of surviving colonies (table 2, Ag coefficient) across our observed land use gradient during the growing season could conservatively net an additional ≈$20 per colony in almond pollination rental payments [25]. We estimated an increase of $1200 per 'high-end' (48 colonies surrounded by 200 ha Ag) relative to a 'low-end' (4200 ha Ag, ≈80% of the area within a 4 km radius) apiary (figure 5(a); F1,70 = 3.96, r2 = 0.05, p = 0.05). When producing spring splits, the 2 frame greater colony population size carried over from the growing season to almonds (table 2, Ag coefficient) in high-end apiaries meant that there were approximately 96 additional frames of bees from which to make splits (two additional frames per colony × 48 colonies per apiary). Across the land use gradient, we estimated an increase of $2900 per high-end, compared to low-end, apiary (figure 5(b); F1,70 = 5.62, r2 = 0.07, p = 0.02).

Figure 5. Economic valuation of apiaries across a land use gradient. Estimated pollination (a) and split colony (b) values were plotted against land use area in agriculture (Ag: corn, soy, small grains) within a 4 km radius of each apiary.
Download figure:
Standard image High-resolution image
When combining the economic revenue generated from colony rental payments for almond pollination and producing splits, each high-end apiary generates an additional $4100 compared to a low-end apiary. These estimates are further amplified when extending these estimates to the scale of a typical beekeeping operation in the NGP. Commercial beekeepers in the NGP often operate thousands of colonies distributed among hundreds of apiaries. For example, 10 000 colonies distributed at a rate of 48 colonies per apiary ≈200 apiaries; 200 high-end apiaries, netting an additional $4100 in colony rentals and splits per apiary, would then be worth an additional $820 000 annually compared to 200 low-end apiaries. These estimates do not account for potential differential honey production, lost revenue from dead and below-grade colonies prior to, or not available for, almond pollination, and wasted inputs on dying and below-grade colonies prior to almond pollination which could further increase the economic benefit of high-end apiaries for beekeepers.
Discussion
Here we demonstrate how growing season land-use conditions surrounding apiaries in the NGP result in differential outcomes on ecosystem service delivery in another part of the country: February-blooming almonds in California. This study was conducted in a region considered to contain favorable beekeeping habitat conditions, and yet we observed a land-use signal influencing colony population size for pollination services. Further, we determined that the effect of land use on colony population size continued beyond the growing season, exerting the same magnitude of influence on population size in almonds as on the change in population size over the growing season.
This study provides evidence of how multiple stressors such as habitat, parasites, diseases, and stochastic events (e.g. queen failure) may culminate in differential outcomes for bee health. Elevated Varroa mite levels, and the diseases they transmit, cause physiological damage to worker honey bees during the fall and winter and lead to colony mortality [54, 55]. Queen events have been implicated as predictive markers of mortality in honey bee colonies [56], and are particularly problematic when occurring late in the season or overwinter. While we found evidence for the direct influence of land use on colony population size in almonds, it is important to recognize that other factors influence colony outcomes while having no clear relationship with land use, other than potentially obfuscating its effects when, for example, Varroa mites are not under adequate control [42].
Agriculture per se should not be misconstrued as being non-compatible with beekeeping, as agricultural landscapes are putatively where many honey bee colonies reside, and have been shown to contribute positively to colony health in certain contexts [57]. At the same time, it must be recognized that the primary agricultural crops grown in our study region (corn, soy, small grains) do not provide adequate forage resources for pollinators. Adding to the complexity, beekeepers often do not own the land on which their apiaries are located. Thus, the business livelihoods of commercial beekeepers necessitate a substantial dependence on established relationships with farmers and private landowners allowing for the placement of apiaries on private property in the NGP and elsewhere.
The epicenter of honey bee colony numbers and honey production has shifted over the past 50–70 years from the east-central Midwest to the Northern Great Plains, Pacific Northwest, and coastal states including California, Texas, and Florida [e.g. 22, 58–60]. However, pushing farther west from the NGP ahead of the expanding corn and soybean frontier [29] may be unfeasible due to several factors. Beekeepers live, work, and possess infrastructure investment in their respective home ranges, making it difficult to quickly expand into new territory hundreds of miles away where other beekeepers may already be established in prime locations. Further, beekeepers are unlikely to expand farther west because inter-annual patterns of precipitation become less reliable for consistent honey production in historically mixed- and short-grass prairie, forests, and mountainous ecosystems [61]. Taken together, these facts highlight the timeliness of this study conducted in a critical area for beekeeping in the US, as dramatic land-use changes have occurred across the region [16, 29].
Our estimates of the economic benefits of grassland habitat to honey bee colonies and beekeepers were performed for a high-end compared to a low-end apiary, i.e. an apiary surrounded by an additional 4000 ha of grassland (equating to approx. 85% of the total land area within 4 km). Data derived from North and South Dakota Departments of Agriculture apiary registration databases indicate that beekeepers do select for apiary sites comprised of high amounts of grassland, as evidenced by the highest apiary densities occurring along the Missouri Coteau, an area characterized by marginal soils and substantial amounts of uncultivated grassland. Unfortunately, high-end apiaries like those assessed in the present study, currently rank in the minority among known, registered apiaries in the NGP ([16], median percent grassland around apiaries in 2005–2007 ≈ 56%), highlighting the impact that beekeepers have likely already incurred from land use conditions as they currently exist.
While dramatic shifts in NGP agro-ecosystems toward supporting more grassland are not likely to occur in the short term, several federal, state, regional government agencies, and private industry have bolstered efforts to establish pollinator habitat in agricultural landscapes (e.g. https://directives.sc.egov.usda.gov/OpenNonWebContent.aspx?content=37370.wba). Further, as recently as 2015, the pollinator health task force (PHTF) developed a national strategy for promoting the health of pollinators, setting goals to reduce annual colony losses to no more than 15% by 2025 and establish or enhance 2.8 million hectares (7 million acres) of pollinator habitat by 2020 [62]. Achieving habitat establishment on the scale suggested by the PHTF will require a concerted effort across all walks of government, private enterprise, and other stakeholders, similar to the approach that has been proposed for monarch butterflies [63].
We did not detect a relationship between land use and colony survival. However, we did observe a relationship between elevated Varroa levels in September and reduced survival over the winter, independent of land use. Because we opted to remove dead colonies from the calculation of average almond population size, the importance of September Varroa levels on almond population size was de-emphasized in our ALMOND POP model. Had dead colonies been included as zeros in the calculation of the almond population size average, Varroa would have clearly been a major contributor to colony population size (decline) up to almond pollination. However, this approach would have hampered our ability to provide realistic estimates of apiary economic values because beekeepers only receive pollination rental payments for, and can only make splits from, live colonies.
Consistent survival rates among all apiaries in our study may be due to routine management and food supplementation on behalf of our collaborating beekeepers. For example, colonies in our study were chemically treated for parasites and nutritionally supplemented to increase the likelihood of the colonies surviving to the almond pollination season. In fact, among the apiaries in the present study, we observed an average annual loss rate of just 13%, but with substantial apiary-to-apiary and year-to-year variation (SI table 2, range: 0%–81%). Capturing the 'true' effect of land use on apiary survival or elucidating environmental carrying capacity would benefit from a study design wherein nutritional supplements are withheld from colonies across a broad land-use gradient, requiring colonies to subsist solely off environmentally-available resources. However, this design would fall short in that beekeepers would not typically allow colonies to starve and die due to a paucity of naturally-occurring food.
Our economic valuation of apiaries in the NGP omits many of the additional, well-established ecosystem services provided by grassland habitat [e.g. 64–70] while maintaining a productive agricultural economy. When evaluating the overall benefits of grasslands or conservation lands it is important to recognize that viewing associated individual ecosystem services in isolation is ineffective at representing the holistic range of services provided by such pieces of the landscape to landowners and society. As such, the consequences of national, state, and local policies influencing land use decisions made by growers and land managers have far-reaching implications for the health and sustainability of food production, ecosystem services, and environmental conservation. Our work can be extended to forecast the effects of future land use policies on pollinator health, and economic impacts to the beekeeping industry and agricultural systems elsewhere in the US. These models would be useful in informing national policy decisions and targeting goals established by the Pollinator Health Task Force [62]. In addition, ecosystem service models could be developed that assist decision-makers in understanding how policy decisions affect multiple ecosystem services. These models would also be useful for planning and implementing landscape level strategies to support and sustain managed and wild pollinator populations while providing a variety of ecosystem services and allowing for a robust agricultural economy. Given the rapid conversion of natural habitats across the globe and a burgeoning human population, there has never been a more pressing need to understand how land-use changes affect pollinators in tandem with multiple ecosystem services that directly affect human health and society.
Acknowledgments
We thank the collaborating beekeepers and USGS field technicians who facilitated and supported the research. Funding for this research was provided in-part by the USDA-Farm Service Agency (17IAMRECRPHB1) and USDA-Natural Resources Conservation Service (673A7514178). The authors have no competing interests to declare. The data reported in this paper are archived in the US Geological Survey ScienceBase-Catalog [71]. Any use of trade, firm, or product names is for descriptive purposes only and does not imply endorsement by the US Government.