

Abstract
We investigate the causes of deforestation in Indonesia, a country with one of the highest rates of primary natural forest loss in the tropics, annually between 2001 and 2016. We use high spatial resolution imagery made available on Google Earth to characterize the land cover types following a random selection of deforestation events, drawn from the Global Forest Change dataset. Notorious in the region, large-scale oil palm and timber plantations together contributed more than two-fifths of nationwide deforestation over our study period, with a peak in late aughts followed by a notable decline up to 2016. Conversion of forests to grasslands, which comprised an average of one-fifth of national deforestation, rose sharply in dominance in years following periods of considerable fire activity, particularly in 2016. Small-scale agriculture and small-scale plantations also contributed one-fifth of nationwide forest loss and were the dominant drivers of loss outside the major islands of Indonesia. Although relatively small contributors to total deforestation, logging roads were responsible for a declining share of deforestation, and mining activities were responsible for an increasing share, over the study period. Direct drivers of deforestation in Indonesia are thus spatially and temporally dynamic, suggesting the need for forest conservation policy responses tailored at the subnational level, and new methods for monitoring the causes of deforestation over time.
Export citation and abstract BibTeX RIS

Original content from this work may be used under the terms of the Creative Commons Attribution 3.0 licence. Any further distribution of this work must maintain attribution to the author(s) and the title of the work, journal citation and DOI.
1. Introduction
The negative environmental consequences of tropical deforestation are far-reaching and long-lasting. These consequences include degradation of habitat and loss of biodiversity, impairment of water quality and quantity regulation services, air pollution, and emissions of climate change inducing greenhouse gases (GHGs) (Foley et al 2011). In recognition of the magnitude and costs of these impacts, there has been growing effort over the past several decades to slow, halt, and reverse deforestation in the tropics. This includes a wide range of interventions designed to address deforestation across scales, including regulatory standards, corporate voluntary sustainability commitments, protected area networks, economic incentives, and demand-side interventions.
However, there remains a critical lack of information about the complex processes leading to deforestation, including the roles of direct and indirect drivers of forest loss, at national and regional scales (Geist and Lambin 2002). This knowledge gap limits the ability of decision makers to design forest conservation and management approaches that effectively address predominant causes of deforestation and influence the relevant actors responsible for forest loss (Weatherley-Singh and Gupta 2015, Henders et al 2018). In addition, this data gap constrains our ability to evaluate the impacts of targeted forest conservation policies designed to counteract specific drivers of deforestation.
Across the tropics agriculture is recognized as the predominant direct driver of deforestation, responsible for more than 70% of forest loss (Gibbs et al 2010, Hosonuma et al 2012). Commercial export-oriented agriculture, as opposed to small-scale subsistence farming, has grown in importance since the 1990s, particularly in Southeast Asia and South America (Rudel et al 2009, DeFries et al 2013, Austin et al 2017a, Curtis et al 2018). However, few countries routinely and systematically monitor the spatial and temporal trends in different types of agricultural, and non-agricultural, drivers of deforestation (Hosonuma et al 2012, De Sy et al 2015).
We focus on deforestation in Indonesia, which has one of the highest rates of primary forest loss in the tropics (Margono et al 2014). This rapid deforestation endangers the country's globally significant biodiversity and contributes to the nation's ranking as one of largest GHG emitters globally (Austin et al 2018). In addition, the related conversion and burning of organic peat soils has resulted in severe air pollution and attendant regional public health crises (Marlier et al 2015). Several previous studies have reported drivers of deforestation in Indonesia, but focus on a sub-region (e.g. Borneo) (Gaveau et al 2016), forest type (e.g. peat forests) (Wijedasa et al 2018), single driver (e.g. oil palm plantations) (Austin et al 2015), or rely on an indirect proxy for direct drivers (e.g. permit boundaries) (Abood et al 2014). Table S1 is available online at stacks.iop.org/ERL/14/024007/mmedia and summarizes the results from these and other related studies.
In this study we quantify the relative importance of a range of direct drivers of deforestation across Indonesia 2001–2016. We conducted our analysis using annual data on forest cover loss (Hansen et al 2013) and high-resolution imagery made available on Google Earth. This investigation supports effective forest management policy formulation by systematically characterizing drivers of deforestation over time and by sub-regions of interest. In particular, the annual nature of our approach enables the observation of trends that may be obscured by less frequent assessments. The results of our analysis also enable more robust evaluation of the impact of forest conservation interventions aimed at a specific driver of change, which includes for example Indonesia's national moratorium on new permits for the conversion of primary natural forests and peat lands, and recent corporate voluntary zero-deforestation commitments in the palm oil industry.
2. Methods
Indonesia is comprised of more than 10 000 islands totaling 188 million hectares (Mha) in land area. In 2000 more than half of the country was covered by primary natural forest (Margono et al 2014). The nation experienced high and increasing rates of deforestation over 2001–2016, resulting in large GHG emissions and putting valuable ecosystem services at risk. This deforestation predominantly occurred on the large islands of Sumatra (47% of national deforestation) and Kalimantan (40% of national deforestation) (Margono et al 2014).
We assess the direct drivers of deforestation in Indonesia, or the specific human activities that directly affect forest cover, such as agricultural expansion, wood extraction, and infrastructure extension (Geist and Lambin 2002). Remotely sensed imagery can provide the basis for identifying the land cover subsequent to a deforestation event, which we use as a proxy for this direct driver. Field observations would permit more nuanced understanding of land use following a deforestation event, and the actors responsible for forest loss, but these are outside the scope of this study. In addition, we do not assess indirect or underlying drivers of deforestation, which are the complex suite of factors that collectively predispose an area to deforestation, influence decisions to clear land, and which are largely unobservable via remotely sensed imagery (Geist and Lambin 2002, Busch and Ferretti-Gallon 2017).
2.1. Data
We used 30 m resolution Global Forest Change (GFC) maps representing tree cover loss annually between 2001 and 2016 (Hansen et al 2013). We used tree cover loss data 2001–2015 from GFC Version 1.3 and, as updated data became available, we included loss events from 2016 from GFC Version 1.5. All GFC data versions 1.1 onwards include reprocessed data beginning in 2011 that could have introduced time series inconsistencies in our analysis. Once available, a planned reprocessing of all years 2001 onwards will allow us to assess the impact of these inconsistencies.
Hansen et al defined tree cover loss as the transformation of forests to a non-forest state at the mapping scale; we refer to this interchangeably as deforestation and forest loss. We defined a deforestation event as at least two contiguous loss pixels, according to an eight-neighbor rule, where tree cover loss was reported in a given calendar year. This resulted in a minimum change area of 1800 square meters, or 0.18 hectares (ha). We excluded single pixel events from our analysis, which are more likely associated with errors. As the focus of our analysis is forest loss in natural forests, rather than in plantations undergoing harvesting, we omitted GFC tree cover loss events where the majority of the event was outside intact or degraded primary natural forests prior to the start of our analysis (Margono et al 2014).
We randomly selected deforestation events from the full GFC dataset, stratified by deforestation event size. We used three size class strata representing small (<10 ha), medium (10–100 ha) and large (>100 ha) deforestation events (Austin et al 2017a). Size class stratification is required when using events as the unit of analysis, rather than pixels, as there were relatively few medium- and large-scale events, but these comprised a large area of deforestation. Our sample size was n = 4590 events, representing 455 765 ha of deforestation, or 5% of the total area deforested in primary natural forests over the study period.
2.2. Driver identification
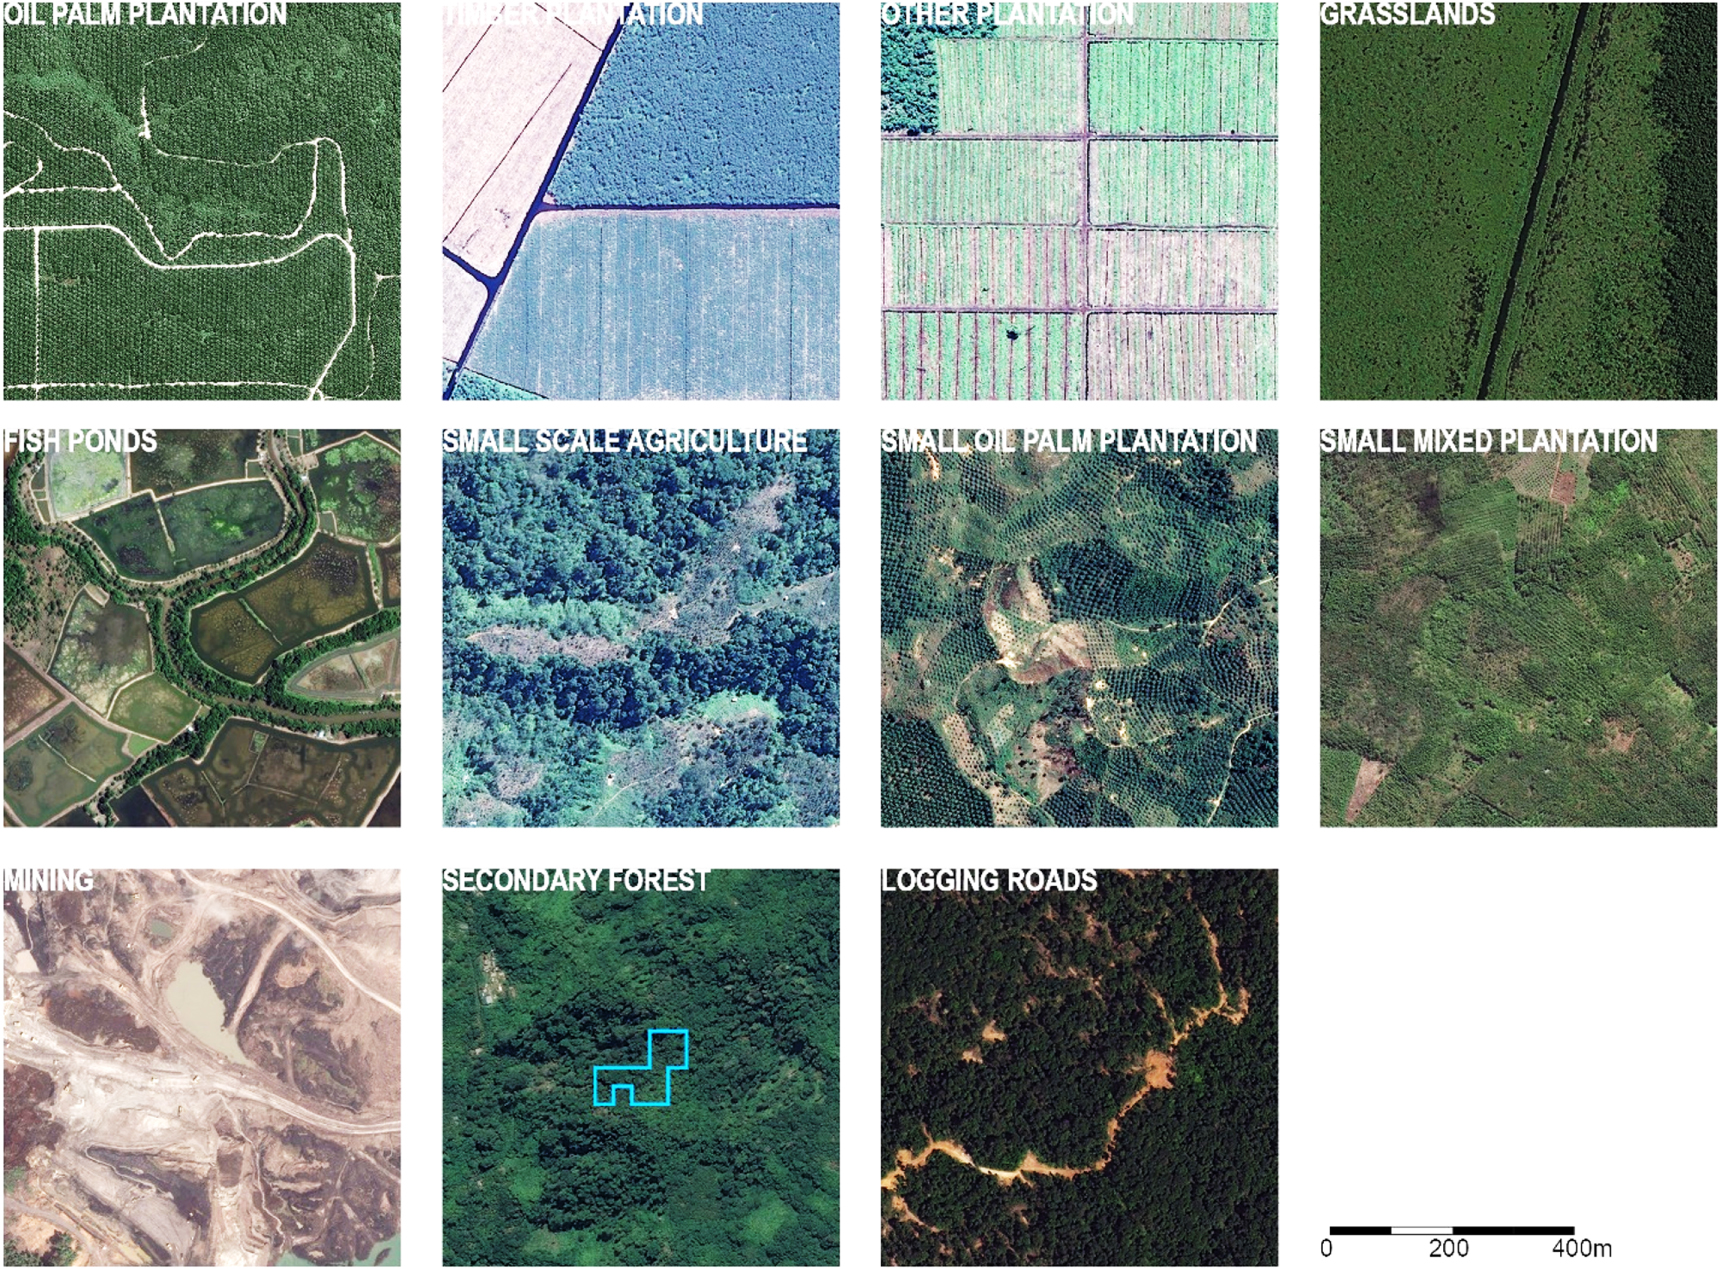
We imported the selected deforestation events into Google Earth Pro for visual interpretation. Two interpreters classified the sampled deforestation events into 12 driver categories based on the land cover observed following a tree cover loss event (table 1, figure 1). The interpreters used features in the landscape within and adjacent to the event to determine the subsequent land cover. To identify drivers of deforestation the interpreters viewed all available high spatial resolution imagery and annual cloud-minimized Landsat composites in the four years following the event (for example, over 2006–2009 for an event that occurred in the year 2005). In most cases we were able to identify a driver within a two-year window after the event, but we used the four-year time frame to allow for sufficient tree growth for confident plantation species categorization. In a small number of cases we observed more than one land cover within the four-year window; in these cases we assigned a driver category based on the latest available high-resolution image. In just under one-quarter of all samples there was no good quality high-resolution imagery during the window, and in these cases we either based our assessment on Landsat imagery if possible or, in just over 15% of cases, assigned a 'no data' classification. The four-year time frame is not available for more recent years, and as a result we assigned 'no data' to just over 20% of the events in 2015–2016.
Table 1. The drivers of direct deforestation categories used for the present analysis.
| Category | Land cover description |
|---|---|
| Oil palm plantation | Large network of rectangular plantation blocks, connected by a well-defined road grid. In hilly areas the layout of the plantation may follow topographic features. The presence of oil palm is confirmed by noting individual palm crowns. |
| Timber plantation | Large network of plantation blocks connected by a well-defined road grid. The shape of the blocks is varied, and may be rectangular or conform to watershed boundaries. The presence of timber species is confirmed by noting canopy structure. |
| Other large-scale plantations | Like oil palm or timber plantations, but the plantation species cannot be discerned via high-resolution imagery, or trees are too young to reliably determine plantation species. This category is used as long as the distinctive road network is clearly visible, even if trees have not yet been planted and the land cover within plantation blocks is bare ground, grassland or shrublands. |
| Grassland/shrubland | Large homogeneous areas with few or sparse shrubs or trees, and which are generally persistent. Distinguished by the absence of signs of agriculture such as clearly defined field boundaries. |
| Small-scale agriculture | Matrix of clearly defined fields, which may be covered by bare ground or crops, or temporary fallow lands with varying degrees of vegetative growth. |
| Small-scale mixed plantation | Similar to small-scale agriculture land but at least 75% of the deforestation event is covered by planted rows of trees. |
| Small-scale oil palm plantation | Similar to small-scale mixed plantations, but the tree cropping systems should be dominated by palm, determined by noting individual palm crowns. |
| Mining | Modified bare ground including evidence of mining activity, such as pits, terraces and ponds. |
| Fish pond | Semi-rectangular ponds with well-defined borders and observable reflective water surface |
| Logging road | Branching roads surrounded entirely by forest, far from villages, clearings, or signs of agriculture. These roads are commonly ephemeral due to forest regrowth. |
| Secondary forest | Forested areas with closed or nearly closed canopies. These are generally very small forest loss events followed by rapid recovery of canopy structure, and may be due to selective logging. While such tree cover loss events would likely be considered a form of forest degradation, rather than deforestation, we included in our assessment of deforestation drivers in the interest of comprehensiveness. |
| Other | Includes urban expansion, such as roads, housing developments and golf courses, and non-anthropogenic disturbances, such as shoreline erosion, volcanic activity and landslides. |

Figure 1. Examples of the driver categories identified in this study. All images are in the same scale. The 'secondary forest' example includes the outline of the deforestation event.
Download figure:
Standard image High-resolution imageWe checked the stability of our driver classification by additionally examining longer term land cover transitions. For deforestation events that occurred 2001–2005, we recorded both the initial driver of change occurring within four years of tree cover loss, and a secondary driver occurring at least ten years after the event. This allowed us to examine longer term trajectories of land cover change, and to gauge the extent of more complex land cover transitions.
To assess the reliability of our visual interpretation method, the two expert interpreters classified 100 of the same samples within each size class category. We compared the assignment of drivers for this subsample, and report user's and producer's agreement for each driver category (table S2). Overall agreement was 91%, 90%, and 95% for small, medium and large patches, respectively. Agreement was >90% for all individual driver categories except for large-scale plantations of unknown species and timber plantations in the small size class, and small-scale oil palm plantations and small-scale mixed plantations across all size classes (table S2). Due to the difficulty of distinguishing small-scale plantations from small-scale oil palm plantations, we combine these two categories in the presentation of our results.
We calculated the variability of our estimates by creating a bootstrap distribution via resampling from each of our stratified samples. We used the boot package in R version 3.5.0 to randomly sample 1000 times with replacement, calculated the area and relative proportions of each driver for each iteration, and calculated confidence intervals based on the resulting distributions (Canty and Ripley 2017, R Core Team 2018).
2.3. Scaling up
To calculate the proportion of each driver in each year, we weighted our sample results in each size class by the proportion of total deforestation in each size class occurring nationwide in each year (figure S1) (Austin et al 2017a). To explore the heterogeneous nature of drivers of deforestation across different landscapes of potential interest, we repeat this process using the proportion of deforestation in each size class across major islands, permit types (Global Forest Watch 2015), protected areas (IUCN and UNEP-WCMC 2015), intact forest landscapes (IFLs), and peat lands (MoA 2011). IFLs are contiguous forests with no signs of anthropogenic disturbance detectable via remotely sensed imagery and large enough to maintain populations of wide-ranging species (Potapov et al 2008).
3. Results
Oil palm plantations were the largest single driver of deforestation over the study period, resulting in 23% (90% CI 18%–25%) of deforestation nationwide (table 2, figure 2). This corresponds closely to previous estimates of oil palm driven deforestation nationwide in Indonesia (Agus et al 2013, Austin et al 2017b). Notably, we observed a peak in oil palm driven deforestation in 2008–2009, when it reached almost 40% of national deforestation, followed by a gradual decline up to 2014–2016, when it dropped to less than 15% of deforestation. The expansion of timber and other large-scale plantations together resulted in 21% of national deforestation (14% and 7%, respectively). Deforestation driven by timber plantations peaked in 2010–2012, while deforestation driven by other large-scale plantations increased somewhat towards the end of our study period, due in part to the challenge of identifying plantation species when planted trees are still very young.
Table 2. The area (ha) and proportion (%) of deforestation nationwide 2001–2016 caused by each driver category.
| Driver | Area (ha) | Proportion (%) | 90% CI |
|---|---|---|---|
| Oil palm plantation | 2 080 978 | 23% | (18%–25%) |
| Timber plantation | 1 261 028 | 14% | (10%–17%) |
| Large-scale plantation | 616 208 | 7% | (5%–10%) |
| Grassland/shrubland | 1 840 884 | 20% | (16%–24%) |
| Small-scale agriculture | 1 361 784 | 15% | (12%–16%) |
| Small-scale mixed plantation | 662 418 | 7% | (6%–9%) |
| Logging road | 357 391 | 4% | (4%–5%) |
| Secondary forest | 554 617 | 6% | (5%–7%) |
| Mining | 219 987 | 2% | (1%–3%) |
| Fish pond | 71 717 | 1% | (0%–1%) |
| Other | 157 619 | 2% | (1%–2%) |

Figure 2. The area ('000 ha) of deforestation in Indonesia, annually 2001–2016, by driver category. To improve legibility we combine mining, fishpond and other driver categories, secondary forest and logging road categories, and small-scale agriculture and small-scale plantation categories.
Download figure:
Standard image High-resolution imageConversion of forests to grassland/shrubland was the second largest single driver, contributing 20% (90% CI 16%–24%) of nationwide deforestation. We observed substantial peaks in this type of deforestation in the years 2003, 2007, 2014 and 2016, corresponding to the years following dry season with observed spikes in fire activity (Van der Werf 2015). The visual interpreters anecdotally reported evidence of burn scars in many cases of forest conversion to grasslands, further suggesting that fire may play an important role in this type of deforestation. Notably, the dramatic increase in rates of forest to grassland conversion in the years 2014–2016 contributed substantially to the increase in total forest loss through 2016, despite the steady reduction in other major drivers of deforestation over the same period.
The expansion of small-scale agriculture and small-scale mixed plantations together resulted in 22% (90% CI 18%–25%) of national deforestation. Our estimate corresponds closely to previous estimates of smallholder agriculture in Borneo (Gaveau et al 2016) and nationally in Indonesia (Agus et al 2013). We observe a slight increase in the proportion of deforestation driven by small-scale agriculture over the study period, but do not observe a similar increase in expansion of small-scale plantations into forests (table S3).
Logging roads and small-scale clearings followed by secondary forest regrowth combined comprised 10% of national deforestation. Importantly, the role of logging roads dropped from an average of 9% of deforestation in 2001–2005, to an average of 3% in 2011–2016, likely due to a shift away from selective logging and towards timber plantations for supplying pulp and wood products (Hughes 2018). While logging roads are the most evident marker of the impacts of logging, research indicates they comprise just 20% of the total area impacted by logging activities in Indonesia (Pearson et al 2018). Other impacts, including skid trails and tree fall gaps, are less apparent in optical remotely sensed imagery but comprise 80% of the area impacted by logging operations. We estimate that the area impacted by logging roads was just over 350 000 ha during 2001–2016, suggesting that the total area degraded by logging activities could have been as high as 1 750 000 hectares, on par with the forest area lost to other major drivers of deforestation.
The remaining drivers of deforestation, including mining activities, fish ponds and other activities contributed a total of 5% of deforestation (90% CI 3%–7%) (table S3). We did not observe any clear trend in this 'other' category, which includes urban expansion, despite large reported increases in urban extent over the study period (World Bank Group 2016). This is likely due to our focus on primary natural forests in the year 2000, which omits major urban centers from our assessment.
3.1. Results by region
We observed substantial variation in drivers of deforestation across the archipelago (figure 3, figure S2). Although relatively smaller contributors to overall deforestation, Sulawesi, Java and Nusa Tenggara are characterized by a significantly larger proportion of deforestation driven by small-scale agriculture than elsewhere in the country. In Papua, logging roads and small-scale clearings followed by secondary forest regrowth were responsible for more than one-third of deforestation, a much larger proportion than observed nationwide. Importantly, deforestation driven by oil palm and other large-scale plantations grew in importance over the study period and together became the dominant driver of deforestation in Papua after 2013.

Figure 3. Proportion of deforestation 2001–2016 caused by each driver category, by major region of Indonesia.
Download figure:
Standard image High-resolution image
In Kalimantan, oil palm plantations were the dominant driver of deforestation from 2005 to 2013, with a peak in 2009 followed by a steady decline (figure S2). Forest conversion to grassland/shrubland was also an important driver of forest loss in Kalimantan, and the notable peaks in deforestation driven by grassland expansion observed at the national level are attributable in large part to the grassland expansion dynamics in this region. For example, more than two-thirds of the area of national forest to grassland conversion in 2016 occurred in Kalimantan. On the other hand, Sumatra has a more varied driver profile, with roughly equal areas of deforestation driven by oil palm plantations, grassland/shrublands, and small-scale agriculture. The island experienced a peak in oil palm plantation expansion into forests somewhat earlier than in Kalimantan, from 2005 to 2009, followed by a peak in timber plantations expansion from 2010 to 2012. Notably, the Sumatra has a substantially higher rate of deforestation driven by small-scale agriculture and small-scale plantations than Kalimantan.
Government permitting agencies grant concessions for specific types of land use, including for oil palm plantations, pulpwood plantations, and selective logging activities. As expected, oil palm expansion dominated deforestation within permits granted for oil palm cultivation, and timber plantations dominated deforestation within permits granted for pulpwood cultivation, each causing more than half of deforestation in these permit types (table 3). While not the dominant driver of deforestation in permits for selective logging, logging roads were more prominent in this category of permits than elsewhere, contributing more than one-quarter of deforestation in this category. Thus, while we observed a general trend toward deforestation drivers corresponding to their expected permit type, a large fraction deforestation in each permit type was followed by a different land cover than expected. This is not surprising, given that previous research in Indonesia has illustrated a significant mismatch between land cover and permit allocations in Indonesia, with at least 33% of oil palm and pulpwood permits in one region occupied by independent farmers (Gaveau et al 2017).
Not unsurprisingly, logging roads and small-scale clearings followed by secondary forest regrowth were responsible for almost 40% of deforestation in IFLs (table 3). Oil palm, timber and other large-scale plantations were responsible for the remainder. In peat forests, oil palm, timber, and other large-scale plantations drove more than half of deforestation, with most of the remainder attributable to grassland/shrubland expansion. And in protected areas, conversion to grasslands/shrublands was the dominant driver of deforestation, causing almost two-thirds of deforestation, with most of the remainder attributable to small holder agriculture.
Table 3. The proportion of deforestation 2001–2016 caused by each driver category, in intact forest landscapes, peat lands, protected areas and three types of permits.
| Landscapes of conservation concern | Permit types | |||||
|---|---|---|---|---|---|---|
| Intact forest landscapes | Peat lands | Protected areas | Oil palm | Selective logging | Timber | |
| Oil palm plantation | 12% | 26% | 6% | 53% | 10% | 7% |
| Timber plantation | 3% | 21% | 2% | 7% | 6% | 58% |
| Large-scale plantation | 13% | 6% | 0% | 10% | 5% | 5% |
| Grassland/shrubland | 12% | 35% | 63% | 13% | 12% | 13% |
| Small-scale agriculture | 11% | 5% | 20% | 6% | 20% | 7% |
| Small-scale plantation | 0% | 4% | 2% | 5% | 3% | 5% |
| Logging road | 24% | 0% | 0% | 1% | 27% | 1% |
| Secondary forest | 14% | 1% | 2% | 2% | 11% | 4% |
| Mining | 1% | 0% | 3% | 1% | 2% | 1% |
| Fish pond | 0% | 0% | 1% | 0% | 1% | 0% |
| Other | 6% | 0% | 1% | 1% | 4% | 1% |
3.2. Driver stability assessment
Conversion of forest to one land cover category during 2001–2005 is rarely followed by another land cover transition during the time frame of our study. Just 8% of all deforestation events 2001–2005 were assigned one driver based on the initial land cover following forest loss, and then converted to a different land cover ten years later (figure S3). Forest loss events caused by mining and oil palm, timber, and small-scale plantations almost always continued in these same land cover categories after 10 years. On the other hand, one-fifth of deforestation that occurred for small-scale agriculture and one-third of deforestation for grassland/shrubland expansion were later converted to another land cover category. The dominant follow-up transition in these cases was conversion to small-scale mixed plantations and oil palm plantations. Although relatively minor in terms of overall deforestation, roughly half of the area deforested to make way for logging roads was subsequently converted to another land cover category, usually small-scale agriculture, small-scale plantations and oil palm plantations. This suggests that over longer time frames these driver categories may be intermediate steps towards more intensive land cover conversion and resource extraction. The timing and nature of these transitions merit further investigation, particularly given our observation of increasing conversion of forest to grasslands in recent years.
4. Discussion
This study quantifies the relative role of direct drivers of deforestation in Indonesia annually 2001–2016. We take advantage of the rapidly growing availability of free and easy-to-access high resolution imagery on Google Earth, which allows us to attribute drivers of forest loss to specific follow-up land cover types with a substantial degree of confidence. We thus add additional value to the previously binary map of annual forest cover loss, with the aim of informing forest conservation efforts that reflect priority drivers of deforestation and engage the actors responsible for forest loss.
4.1. Implications for forest conservation policy priorities
Our findings confirm that large-scale plantation agriculture is an important driver of deforestation in Indonesia. However, an important new finding is that the role of these large-scale plantations has diminished since the end of the 2000s, when they were responsible for more than half of deforestation, to 2014–2016, when they were responsible for an average of one-quarter of deforestation. This observed decline could be due, at least in part, to the impacts of forest conservation interventions aimed specifically at preventing large-scale plantations from causing forest loss. These include for example Indonesia's national moratorium on new permits for the conversion of primary natural forests and peat lands, established in May of 2011 (Austin et al 2014, Busch et al 2015), and corporate voluntary zero-deforestation commitments in the palm oil industry since 2010 (Climate Focus 2016). While outside the scope of the present study, our map of annual deforestation drivers will enable more refined evaluations of policy impacts, including for example causal analysis of the influence of these policy interventions specifically on deforestation driven by large-scale plantations.
Conversion to grasslands was another important driver of deforestation nationally, is the most important driver of deforestation in protected areas and peat forests, and appears to correspond to dry seasons with observed spikes in fire activity. In particular, grassland expansion into forests increased dramatically during the 2014–2016 period, particularly in Kalimantan, and was a key contributor to the increasing rate of forest loss nationally up to 2016. The severe dry seasons in 2015 may have set the stage for the high rate of observed grassland expansion in 2016 and resulted in acute levels of transboundary air pollution and associated public health crises. In response to this burning event the national government put in place several measures to prevent fires on peatlands, including regulations for restoring degraded peat lands and swapping timber plantation permits on peat lands for alternative areas on mineral soils (Jong 2017). Further assessment of the role of fire in deforestation trajectories, including through incorporation of improved estimates of burned area (Giglio et al 2016), will strengthen our understanding of these linkages.
Given that large-scale plantation expansion was a substantial driver of forest loss in Indonesia, there has been a justifiable focus among forest conservationists on counteracting these agents of change. However, we note that small holder agriculture and plantations continued to contribute to forest loss over the study period, suggesting the importance of designing forest management interventions that take the values and requirements of these agents of change into account. This is challenging, however, due to the large number of small-scale farmers across Indonesia with diverse motivations and governing principles. Evidence from Brazil suggests that, while policy interventions aimed at addressing large-scale drivers of forest loss have been at least partially successful at slowing deforestation (Nepstad et al 2014), interventions addressing small-scale drivers of change have had relatively little impact (Godar et al 2014).
The context of smallholder plantation agriculture in Indonesia is also unique, in that there is a direct link between some forms of small holder plantation management and their large-scale industrial counterparts. For example, small-scale oil palm cultivation comprises 40% of national production, and is closely tied to large-scale oil palm enterprises via outgrower schemes (DJP 2016). Mosnier et al report that, as large-scale oil palm plantations developers increasingly comply with sustainability standards, the area cultivated by small-scale producers will likely increase (Mosnier et al 2017). Given that compliance with emerging sustainability standards may be less enforceable and more challenging for these small-scale plantation managers, this increase could lead to a larger proportion of deforestation driven by small-scale plantations. On the other hand, there may also be a window of opportunity to facilitate small holder compliance with sustainability standards and reduce deforestation, by leveraging extension services and informal information networks.
4.2. New methods for systematic monitoring of deforestation drivers
There is potential to augment our method for characterizing drivers of deforestation by using crowdsourcing approaches, which leverage citizen scientists to scale up data collection efforts. Such efforts have successfully collected data on, for example, global agricultural lands and field sizes (Fritz et al 2015), and tree cover in dry lands (Bastin et al 2017). There is also potential to use sample data such as those collected in this study to parameterize a statistical model that predicts the drivers of deforestation, by considering the characteristics of the events (e.g. size, shape, location relative to infrastructure). Such models could facilitate more rapid and systematic assessment of deforestation drivers over time (Finer et al 2018). For example, Richards and Friess trained a model to predict drivers of mangrove forest loss in Southeast Asia (Richards and Friess 2016), and recently Curtis et al trained a model to predict drivers of deforestation globally (Curtis et al 2018).
We note that there are important considerations of spatial scale when conducting evaluations of drivers of deforestation using any of these methods. For example, Curtis et al use 10 km2 grids for their global assessment of deforestation drivers, which is several orders of magnitude larger than the unit of analysis in the present study. This is one factor contributing to their estimate of commodity driven deforestation in Indonesia of 88%, a value nearly twice as large as our corresponding estimate of 46% over the same period (table S1). This highlights the influential role of spatial resolution in assessments of direct deforestation drivers.
4.3. Direct versus underlying drivers of deforestation
We acknowledge that a better understanding of the direct drivers of forest loss is just one step towards developing robust policy interventions to manage forests, mitigate GHG emissions, conserve biodiversity, and protect ecosystem services. To design, implement, and enforce effective policies, the forest conservation community needs to improve understanding of the complex suite of underlying factors that lead to the rise or fall of specific direct drivers of deforestation. These include population, income, market demand, infrastructure, tenure security, and law enforcement (Geist and Lambin 2002, Busch and Ferretti-Gallon 2017). A comprehensive dataset of direct drivers of deforestation, such as the data developed in this analysis, provides a key element needed to investigate the pathways and linkages between these underlying factors and the agents directly responsible for deforestation.