

Abstract
After decades of decline, croplands are once again expanding across the United States. A recent spatially explicit analysis mapped nearly three million hectares of US cropland expansion that occurred between 2008 and 2012. Land use change (LUC) of this sort can be a major source of anthropogenic carbon (C) emissions, though the effects of this change have yet to be analyzed. We developed a data-driven model that combines these high-resolution maps of cropland expansion with published maps of biomass and soil organic carbon stocks (SOC) to map and quantify the resulting C emissions. Our model increases emphasis on non-forest—i.e. grassland, shrubland and wetland—above and belowground biomass C stocks and the response of SOC to LUC—emission sources that are frequently neglected in traditional C accounting. These sources represent major emission conduits in the US, where new croplands primarily replace grasslands. We find that expansion between 2008–12 caused, on average, a release of 55.0 MgC ha−1 (SDspatial = 39.9 MgC ha−1), which resulted in total emissions of 38.8 TgC yr−1 (95% CI = 21.6–55.8 TgC yr−1). We also find wide geographic variation in both the size and sensitivity of affected C stocks. Grassland conversion was the primary source of emissions, with more than 90% of these emissions originating from SOC stocks. Due to the long accumulation time of SOC, its dominance as a source suggests that emissions may be difficult to mitigate over human-relevant time scales. While methodological limitations regarding the effects of land use legacies and future management remain, our findings emphasize the importance of avoiding LUC emissions and suggest potential means by which natural C stocks can be conserved.
Export citation and abstract BibTeX RIS

Original content from this work may be used under the terms of the Creative Commons Attribution 3.0 licence. Any further distribution of this work must maintain attribution to the author(s) and the title of the work, journal citation and DOI.
1. Introduction
After decades of declining area, croplands have shown renewed rates of expansion throughout the United States [1–3]. Lark et al (2015), for one, mapped nearly three million hectares of cropland expansion occurring between 2008–12, an increase that was only partially offset by concurrent cropland abandonment [1]. These high rates of expansion followed the establishment of new agricultural markets [4] and changing federal policies, including reductions to the size of the Conservation Reserve Program (CRP) [5, 6]—an initiative used to retire environmentally sensitive croplands from production. Natural lands, including those retired by the CRP, store significant quantities of carbon (C) that they have removed from the atmosphere over time via photosynthesis [7, 8]. When lands are cleared or disturbed to accommodate new crops, this C can re-enter the atmosphere via combustion or decay [9]. Natural C stocks are thus highly sensitive to the changing policy and economic conditions that drive land use and land management decisions [10].
Worldwide, land use change (LUC) is a leading cause of anthropogenic C emissions and their associated impacts on climate change [9, 11, 12]. Since 1850, LUC has been the agent of nearly one-third of cumulative net emissions globally [7] and currently accounts for roughly 10% of all annual emissions [12]. Many of these emissions result from tropical deforestation, which displaces large quantities of C stored primarily in plant biomass [7, 12, 13]. In the United States, where biomass densities are comparatively small, LUC is thought to be a relatively minor component of emissions nationwide [14]. The annual US National Greenhouse Gas Inventory (NGGI), for one, estimates that LUC emissions contribute less than 2% of total gross emissions, and that the land sector in whole may offset as much as 10% of gross emissions, primarily due to forest regrowth [14, 15].
Emissions from LUC, though, are notoriously difficult to estimate and represent one of the most uncertain components of the global C budget [16, 17]. National emissions have most often been inferred from aggregated, nonspatial LUC statistics and C stock inventories, an approach that has been endorsed by the IPCC for national Tier-1 and Tier-2 greenhouse gas emission reporting [18]. More recently, spatially explicit satellite observations of LUC and C stocks have been used to generate more accurate estimates [19, 20]—primarily in tropical forests where LUC is readily observed from space. These methods more closely reflect the ground truth spatial variation in C stocks that otherwise precluded aggregated analyses. As the spatial resolution of satellite-based analyses has increased over time, corresponding estimates of gross C fluxes have also increased in magnitude (e.g. [19] versus [21]), which implies that coarse-resolution estimates may downplay the true magnitude LUC emissions.
As satellite-based biomass mapping continues to improve, emissions from soil organic carbon stocks (SOC) are emerging as the leading source of emission uncertainty [22]. This uncertainty may be particularly problematic in areas like the US where LUC disproportionately affects ecosystems like grasslands and shrublands [1] that have relatively small biomass C stocks but extensive amounts of SOC. Worldwide, SOC represents the largest biospheric C pool [22, 23] and can be highly sensitive to LUC [24, 25]. SOC emissions are often inferred by assuming that a prescribed fraction of the initial SOC stock is emitted following LUC [18], though recent analyses have questioned the integrity of these simplified assumptions and argued that SOC sensitivity to LUC varies geographically [24, 26]. Process-based, biophysical models have also been used to more explicitly account for legacies of past land use and the effects of subsequent management. These models rely on complex simulations to predict the size of SOC stocks and their sensitivity to LUC. These predictions, though, can differ markedly from empirical observations, which can thereby influence subsequent emission estimation [16, 27–29]. Empirical models have been proposed as transparent alternatives that are observationally constrained and require less intensive computation than process-based models [18, 30]. However, their use in inventories has been limited to date by the lack of essential spatial data. Given the recent availability of relatively high resolution, satellite-based C stock and LUC maps, a new methodological framework that combines pool-specific empirical methods may better capture the full effects of LUC on C emissions and can serve as a check on methods currently used to model emissions.
We developed a semi-empirical modeling framework to spatially estimate emissions from LUC in the conterminous US. Our data-driven approach combines published maps of US LUC, biomass C stocks, SOC stocks and relevant covariate layers with transparent assumptions and carbon response functions (CRFs)—simple statistical models that transparently predict SOC emissions by accounting for the empirical effects of environmental covariates—to generate pixel-level emission estimates from US cropland expansion. We implemented our framework in Google Earth Engine [31] and used Monte Carlo simulations to generate a constrained uncertainty estimate at the pixel level.
2. Methods
2.1. Recent cropland expansion (2008–12)
While our model can be applied to various maps of US LUC, we apply it here to data from Lark et al (2015), a 56 m resolution, spatially explicate map of gross cropland expansion observed throughout the conterminous US between 2008–12 [1]. This map was derived from the annually produced USDA Cropland Data Layer (CDL) and has a user's accuracy of 70% [32]. When estimating C stocks and emissions, we assumed that the pre-conversion landcover of a converted pixel was that reported by the CDL in the year prior to conversion and we omitted pixels where the pre-conversion landcover was identified as surface water, ice/snow, development or barren due to the ambiguity of their pre-conversion C stock (table S1 is available online at stacks.iop.org/ERL/14/045009/mmedia). To attribute emissions to crop-specific expansion, we defined the 'breakout' crop as the first crop present in newly converted pixels [1], but we omitted pixels in which woody perennials were identified as the breakout crop (table S2) due to ambiguous effects of their expansion on C emissions [33]. In total, omitted pixels represented 1608 km2 or 5% of all conversion observed during our 4 year study period. Remaining pixels were then aggregated into four broad land-cover classes: forests, grasslands, shrublands and wetlands for modeling and analysis (table S3).
2.2. Carbon stock mapping
Published, spatially explicit maps of US biomass and SOC stocks were used to determine the initial C stocks of converted pixels. Satellite-based maps were available for aboveground biomass (AGB) in US forests at a 30 m spatial resolution [34] (figure S1) and for global grasslands AGB C stocks at an 8 km spatial resolution [35] (figure S2). We created a novel map of US shrubland AGB using an allometric model and 30 m resolution maps of shrub height and percent cover (supplementary material; figure S3). For wetlands, we used the forest AGB map to estimate woody wetland AGB, and the grassland AGB map for herbaceous and unspecified wetlands. Biomass stocks were converted to C stocks by assuming a biomass C fraction of 0.47 [18]. Forest, grassland and shrubland maps provided stock estimates for the years 2000, 2006 and 2001, respectively, all of which corresponded to pre-conversion conditions.
To determine the pre-conversion biomass C stocks of converted land, we assigned each converted pixel the corresponding AGB C stock value from the biomass map that matched the pre-conversion landcover. In cases where AGB data were not available for that type of landcover due to masking, we used 'Random Forest' regression [36]—a machine learning algorithm widely used in remote sensing [21, 37]—to extrapolate biomass estimates from the appropriate biomass map using pre-conversion Landsat imagery (2002–07) and covariate climate and terrain layers (see supplementary material). Belowground biomass stocks (BGB) were then modeled and mapped for all converted pixels using AGB estimates and published, landcover-specific, empirical relationships [18, 38, 39] (supplementary material).
Pre-conversion SOC stocks were derived from SoilGridsUSA maps of organic C concentration, bulk density of fine soil [40] and Soil Grids250v2 maps of coarse fragment volume [41] following recommended methods to avoid overestimation [42] (supplementary material). We derived SOC stocks for individual pedons to a depth of 1 m (0–5 cm, 5–15 cm, 15–30 cm, 30–60 cm and 60–100 cm) to facilitate depth dependent SOC emission calculations [24].
2.3. Emission calculations
We estimated committed C emissions for each converted pixel using the 'stock difference' method. This method calculates emissions as the difference between the pre- and post-conversion C stock by assuming all displaced C is emitted to the atmosphere over an unspecified duration from eventual combustion or decay [18, 20, 43]. For biomass we assumed that the post-conversion biomass C stock was zero since our analysis exclusively considered expansion of annually harvested herbaceous crops that do not represent a permanent C stock. Pixel-level emissions from biomass cleared by cropland expansion were thus calculated as the sum of a pixel's AGB and BGB C stock estimate.
Committed emissions from SOC stocks to a depth of 1 m were modeled by spatially applying published CRFs describing the expected proportional change in size of the initial SOC stock [24] to depth-specific maps of pre-conversion SOC stocks (Supplementary Material). Since CRFs were only available for forest and grassland conversion, shrublands were treated as grasslands for SOC emission calculations. CRFs were spatially applied using maps of 30 year mean annual temperature (MAT) [44] and depth-specific clay content [40]. CRFs also included a term t that describes the temporal response of SOC stocks to LUC. We set t to 100 years to capture total committed emissions, though on average, converted grassland and forest SOC stocks reached a new 'equilibrium' 17 and 23 years after conversion, respectively [24]. Estimated SOC emissions were spatially validated against a database of independent field measurements taken throughout the conterminous US [45] (supplementary material).
SOC emissions from converted wetlands were calculated separately using the IPCC guidelines for drained organic soils [46] if they occupied soils in which the most probable soil order was identified as Histosol by the SoilGridsUSA database [40] (figure S4; supplementary material). We thus assumed that organic wetlands were drained during conversion and accounted for subsequent CO2, CH4, and N2O emissions [46]. All gasses were converted to CO2–Ceq assuming a 100 year global warming potential of 28 and 265 for CH4 and N2O, respectively [47]. The IPCC methodology assumes a linear rate of sustained emissions independent of the initial SOC stock; we assumed emissions were sustained over a 100 year period following conversion [48] but we constrained estimates to a loss no greater than 72% of the initial SoilGridsUSA-derived SOC stock to avoid overestimation. This cap represents the maximum difference between the 95% confidence interval of mean observed SOC stocks in the least and most disturbed US wetlands by the 2011 National Wetland Condition Assessment [49]. If converted wetlands did not occupy Histosols, emissions were determined using CRFs as previously described, with woody wetlands treated as forests and all other wetlands treated as grasslands.
2.4. Emissions uncertainty
Monte Carlo simulations (n = 1000) were used to propagate the uncertainty associated with the layers and model coefficients considered in this analysis and generate a constrained estimate of emissions uncertainty. Lacking producer-provided uncertainty layers for all input layers, we assumed that each layer's reported root mean square error (RMSE) uniformly represented the standard deviation of each pixel's error distribution [50]. The RMSE was thus used to generate a probability distribution for each layer by assuming that error was normally distributed unless otherwise noted. In addition, uncertainty associated with LUC extent was derived from the user's accuracy and included in this analysis [51]. Emissions from each C pool were calculated by resampling without replacement each of the input distributions. This resulted in a probability distribution of emissions for each pixel from which we calculated the mean, standard deviation (SDpixel), coefficient of variation (CVpixel), and 95% confidence interval (95% CI). When reporting C fluxes per unit area (e.g. MgC ha−1), SDspatial represents the spatial variation of mean pixel-level estimates. When reporting total C emissions (e.g. TgC yr−1), the 95% CI represents the sum of the respective percentile estimates for all pixels.
3. Results
3.1. Total emissions
We estimate that US cropland expansion between 2008–12 resulted in mean C fluxes of 55.0 MgC ha−1 (SDspatial = 39.9 MgC ha−1). While the magnitude of this flux varied significantly according to the type of land converted, broad geographic patterns were also evident (figure 1). The greatest fluxes were observed along the southeastern seaboard and throughout the Great Lakes states where LUC affected larger pre-conversion C stocks in both biomass (figure S5) and SOC (figure S6). An east to west gradient was also evident in the magnitude of C fluxes, with the highest fluxes generally in the east and smaller fluxes observed in the west. Again, this gradient matches a similar gradient in the size of pre-conversion SOC stocks (figure S6) as well as a general gradient of declining biomass productivity (figures S1–S3).
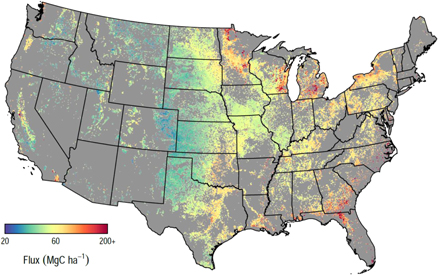
Figure 1. Mean carbon flux resulting from cropland expansion (2008–12). Pixels have been aggregated from the native 56 m resolution to a spatial resolution of 5 km for visualization.
Download figure:
Standard image High-resolution imageFactoring in rates of expansion, we estimate total annual emissions of 38.8 TgC yr−1 (95% CI = 21.6–55.8 TgC yr−1). Emission hotspots were evident throughout the US and generally correspond with high rates of expansion (figure 2). The highest total emissions were observed throughout the upper Great Plains and along the margins of the corn belt, where high rates of conversion resulted in moderate to large C fluxes. Smaller isolated hotspots were also observed in other regions, including western New York, Kentucky, northern Florida, central Michigan, central Texas, and the Ogallala region of the southern Great Plains.

Figure 2. Total gross emissions from cropland expansion (2008–12) within 5 km by 5 km resolution pixels. Total gross emissions are a function of the per area carbon flux from all carbon pools and the rate of land clearing of all landcover types within each pixel.
Download figure:
Standard image High-resolution image3.2. Emissions by land source
Grasslands conversion was the primary source (87%) of LUC emissions (figure 3). The mean C flux from grassland conversion was 51.9 MgC ha−1 with over 90% of this flux originating from SOC. BGB accounted for more than 80% of the remaining biomass component flux. Grassland fluxes varied moderately in space (SDspatial = 22.7 MgC ha−1) due largely to variation in the size of affected SOC stocks (table S4). We estimate that conversion reduced SOC stocks by 30.4% on average (SDspatial = 5.2%) with greater losses predicted in the warmer climates of the southeastern US and smaller losses predicted from the clay-rich soils of the north central US (figures S7, S8). In total, grassland conversion resulted in annual emissions of 32.4 TgC yr−1 (95% CI = 18.5–46.1 TgC yr−1).
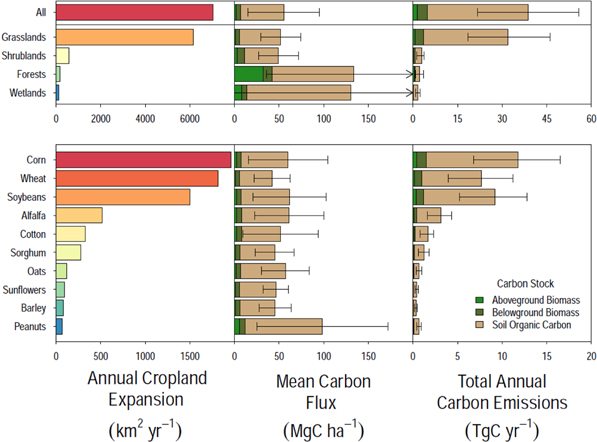
Figure 3. Annual rates of US cropland expansion, mean carbon fluxes, and total emissions by land source (top panel) and breakout crop (bottom panel). Carbon flux and emission estimates report the relative contribution of aboveground and belowground biomass and soil organic carbon stocks. Error bars in flux plots represent the standard deviation of mean pixel estimates (SDspatial) while error bars in emission plots represent the 95% CI of total emissions.
Download figure:
Standard image High-resolution imageShrubland conversion accounted for an additional 7.5% of annual emissions (figure 3). Fluxes from shrubland conversion were comparable in magnitude (49.3 MgC ha−1) to grasslands though a greater proportion of emissions (22%) originated from biomass C stocks. Shrublands stored nearly twice as much C in biomass (mean = 11.0; SDspatial = 5.0 MgC ha−1) compared to grasslands—primarily BGB, which accounted for nearly 75% of total shrub biomass. Converted shrublands had relatively low SOC stocks (mean = 122.4; SDspatial = 69.6 MgC ha−1), though they were slightly more sensitive to LUC, which reduced SOC stocks by 31.9% (SDspatial = 5.9%; figure S8). In total, annual emissions of 2.5 TgC yr−1 were estimated for shrubland conversion (95% CI = 1.3–3.7 TgC yr−1).
Only 2% of new croplands were sourced from forests, though they accounted for more than 4% of total emissions (figure 3). Fluxes from forest conversion (mean = 133.1 MgC ha−1) were more than twice those from grasslands or shrublands and far more variable (SDspatial = 97.6 MgC ha−1). Biomass contributed to more than 30% of the total flux from forest conversion, with the majority (76%) allocated to AGB stocks. Emissions from SOC were the primary driver of flux variability due to extreme heterogeneity in both the size and sensitivity of initial SOC stocks. Affected initial stocks ranged from 11.9–3494.9 MgC ha−1 and LUC effects ranged from nearly 100% loss to 20% gains (sequestration) with the greatest SOC losses predicted in the southeast and modest sequestration predicted in isolated patches of forest conversion on relatively cold, clay-rich soils in the north central US (figure S9). In total, forest conversion accounted for annual emissions of 2.2 TgC yr−1 (95% CI = 0.9–3.5 TgC yr−1).
Wetland conversion resulted in fluxes similar in magnitude to those estimated for forest conversion but was even less prevalent in extent (figure 3). Only 5% of converted wetlands occupied Histosols, though SOC remained the dominant source of emitted C from all wetlands. Estimated fluxes from wetland conversion on mineral soils averaged 96.5 MgC ha−1 (SDspatial = 82.7 MgC ha−1) while fluxes from organic wetland conversion averaged 834.1 MgCO2–Ceq ha−1 (SDspatial = 225.6 MgCO2–Ceq ha−1). Emission estimates from Histosols were also highly sensitive to the duration over which emissions were assumed to persist. While our default assumption was 100 years, 49% of organic wetlands had reached our imposed emissions cap of 72% loss before 100 years. Biomass contributions varied significantly by wetland type, with proportionately more emissions originating from biomass in woody wetlands (table S4). In total, we estimate that wetland conversion resulted in 1.7 TgC yr−1 (95% CI = 0.9–2.5 TgC yr−1).
3.3. Emissions from the expansion of specific crops
Corn, soybeans and wheat were the most common breakout crops observed on new croplands and together they accounted for more than 73% of emissions between 2008–12 (figure 3). Corn and soy expansion resulted in nearly identical C fluxes (60.1 and 61.3 MgC ha−1, respectively), despite divergent geographic expansion patterns: soy expansion was largely limited to the eastern half of the US, while corn expansion was more ubiquitous [1]. Wheat expansion—the most common crop throughout the Great Plains—resulted in notably smaller C fluxes (42.1 MgC ha−1) due primarily to smaller initial SOC stocks. Together these three crops accounted for annual emissions of 28.3 TgC yr−1 (95% CI = 21.1–35.4 TgC yr−1).
Of the remaining significant breakout crops, expansion of sorghum, sunflower, and barley were notably less C-intensive (45.0, 46.4, and 45.6 MgC ha−1 respectively; figure 3) than either corn or soy expansion. This is because expansion of these two crops primarily occurred on lands in the upper Great Plains with smaller initial SOC stocks. Peanuts—which disproportionately displaced forests in the southeastern US—stand out as a particularly C-intensive crop (98.5 MgC ha−1) due to greater emissions both from biomass and from especially C-rich soils. Despite representing less than 1% of cropland expansion, expansion of peanut farming accounts for nearly 2% of total LUC emissions.
3.4. Prediction uncertainty and validation
Pixel-level uncertainty (CVpixel) averaged 23% and varied widely by C stock and land source. Among the C stocks considered, relative uncertainty was highest for biomass stocks (47%), with the greatest uncertainty (59%) associated with forest biomass, and the least with grassland biomass (36%). Due to the relatively small contribution of these stocks to total emissions, this uncertainty minimally effected overall uncertainty. Instead, emissions from SOC contributed the most to total uncertainty (25%), with the greatest uncertainty associated with forest soils (36%) and the least associated with grassland soils (24%). The relative uncertainty of SOC emissions from both forest and grassland soils increased with depth (figure S10). Due to the relatively small contribution of deep soils to total emissions, though, this uncertainty minimally effected overall emissions uncertainty.
Estimated SOC emissions from wetland conversion were also highly sensitive to our definition of wetlands. Our definition that considered only those CDL-identified wetlands that occupied Histosols likely produced a conservative emission estimate. An additional 46.5 km2 of forest, grassland, and shrubland conversion also occurred on Histosols—an area that accounted for less than 0.2% of all conversion. If organic wetlands were instead defined as any conversion on Histosols, our estimate of wetland emissions would increase by 147% to 4.2 TgC yr−1, which would increase total emissions by 6.5% to 41.2 TgC yr−1 (95% CI = 24.1–61.4 TgC yr−1).
Modeled SOC emissions from forest and grassland conversion were positively correlated with independent field observations reported in the literature [45] (figure 4). The level of agreement varied significantly according to both the type of LUC and the subsequent tillage practices used to manage new croplands. Modeled SOC emissions from grassland conversion most closely matched independent observations from former grasslands managed with conventional tillage (RMSE = 15.9 MgC ha−1, slope = 0.47). Model fit was significantly inferior for former grasslands managed with no-tillage (pancova < 0.01, RMSE = 35.2 MgC ha−1, slope = –0.09). Validation error for SOC emissions from forest conversion was relatively high (RMSE = 37.2, slope = 0.30) and there was no significant difference between observations from conventional and no-till management systems (pancova =0.94). Despite notable disagreement, the range of modeled forest SOC emissions was comparable to the range of field observations (–45.9 [sequestration] to +156.8 MgC ha−1; median = +51.9 MgC ha−1).

Figure 4. Validation of SOC emission estimates from forest (green) and grassland (blue) conversion estimates. Color shade denotes the type of tillage regime of field observations (T = conventional tillage, N = no-till, U = unspecified tillage). Point shape denotes the maximum soil depth at which observations and model predictions were made.
Download figure:
Standard image High-resolution image
4. Discussion
Our data-driven modeling framework improves spatial assessment of C emissions from US cropland expansion. Unlike analyses based on aggregated LUC and C stock statistics, our approach reveals the spatial heterogeneity of natural C stocks and their sensitivity to LUC. It thereby enables better inference of the geographic trends associated with US LUC emissions. Our spatially explicit consideration of biomass C stocks in often overlooked, non-forest landcovers and of both the size and sensitivity of SOC stocks makes our approach particularly well suited for analysis of US LUC and transferable to other regions where LUC primarily affects non-forest landcovers. Our results reveal that US LUC emissions are of global importance and point to policy means and conservation practices by which they could be reduced.
4.1. Sources and significance of US LUC emissions
Our results clarify the significant contribution of grassland conversion to US LUC emissions and generally agree with other published estimates. Grasslands have relatively low biomass stocks, but contain significant quantities of SOC due to their high rates of belowground productivity [8]. While often receiving less attention than deforestation, grassland conversion can result in sizable C emissions. Previous first-order and field-based analyses have estimated emissions of 36.5 MgC ha−1 [52] and 44.2 MgC ha−1 [53] from conversion of US grasslands when managed with conventional tillage. Our estimate (51.9 MgC ha−1), which accounts for spatial variation in both the size and sensitivity of pool-specific C stocks, as well as the geography of conversion, is greater, though similar to those estimates and may reflect a tendency toward conversion of relatively C-rich or sensitive grasslands. While less C-intensive than forest or wetland conversion, the widespread extent of grassland conversion in the US—the rate of which rivals that of some tropical deforestation [13]—makes it a larger emission source than conversion of the Brazillian Cerrado [20] and a source of global importance. Moreover, the disproportionate contribution of SOC to these emissions may challenge future mitigation efforts. Unlike biomass, which accumulates over years to decades, SOC accumulates slowly over decades to centuries [54, 55] and rates may attenuate due to climate change [56]. Consequently, SOC sourced emissions may represent a climate forcing that is effectively irreversible over human relevant timescales.
Estimated emissions also varied according to the type of crops undergoing expansion, which reflects both the geography of crop-specific expansion and the characteristics of converted land. For example, lower emissions from expansion of some small grains and sorghum reflect their prevalence on relatively C-poor soils of the western Great Plains (figure S7). Since these fungible crops can often be used interchangeably with more C-intensive crops like corn and soybeans as feed or fuel feedstocks, future work could examine the C-to-yield tradeoffs of future crop-specific expansion [57, 58]. Conversely, high C fluxes associated with peanut expansion reflect the tendency to replace biomass-and SOC-rich forests in Georgia and Florida. Due to growing demand for peanuts [59], peanut expansion may represent an emerging emission source. Together, these results emphasize that the divergent biophysical geographies of crops require careful C accounting when assessing the C footprint of agricultural products.
Despite general agreement with other studies, though, our estimates are notably higher than comparable estimates made by the US NGGI [14]. While it can be difficult to directly compare committed fluxes like ours to annual balance calculations like those of the NGGI [17], a comparison of fluxes derived from NGGI reported annual emissions and LUC extent (supplementary materials) reveals that our estimates are 4–14 times higher than corresponding NGGI figures (table 1). While some of this divergence can be explained by NGGI omission of biomass C stocks from all but forest conversion estimates, the greatest disagreement stems from SOC emission estimates. The NGGI uses the process-based DayCent model [60] to simulate the size of SOC stocks and their response to LUC. Like the CRFs used in our model, DayCent considers clay and climate as the primary factors effecting SOC stability. However, DayCent simulates an initial SOC stock using a spin-up procedure meant to account for the legacy effects of past land use. Recent studies suggest that this procedure may be underestimating actual SOC stocks and may thereby contribute to underestimated emissions [27, 28]. Our estimates and their relative agreement with field measurements suggest that these discrepancies warrant further review. If we substitute our LUC flux estimates for those of the NGGI (supplementary materials), the expected size of the US terrestrial C sink shrinks by 5.6%.
Table 1. Comparison of flux estimates from the US National Greenhouse Gas Inventory [14] and our study.
| Land source | NGGIa (MgC ha−1) | This study (MgC ha−1) |
|---|---|---|
| Grasslands | 7.9 | 51.9 |
| Forests | 9.1 | 133.1 |
| Settlements | 12.9 | — |
| Shrublands | — | 49.3 |
| Wetlands | 29.4 | 130.6 |
| Other | 5.2 | — |
4.2. Model limitations
While our model seeks to improve spatial consideration of US LUC emissions, it is notably limited in scope. We exclusively consider C emissions for gross cropland expansion and thereby overlook potential sequestration that may result from concurrent cropland abandonment [24, 61]. During our study period an additional 1.8 million hectares of active croplands were abandoned or retired [1]. Much of this land likely re-entered the CRP where it would be managed as grassland [1]. A recent analysis of US grassland restoration via the CRP estimates a sequestration potential of 1.19 MgC ha−1 yr−1 over a 20 year period [61]. Deliberate restoration of all abandoned croplands as permanent, naturally functioning grasslands could therefore offset emissions from expansion by 4.3 TgC yr−1 or roughly 10 percent. This offset could potentially be larger if a portion of abandoned croplands was instead reforested or afforested [62].
Pixel-level uncertainty of our emissions estimates also remains high. We therefore caution against drawing conclusions from fine-scale variation. Instead, the model should be used to assess broad spatial patterns of C stocks and their response to LUC. Future improvements could reduce local uncertainty and facilitate more fine-scaled interpretation. For example, higher resolution maps of C stocks could reduce positional uncertainty [37], while more frequent maps could improve accounting of inter-annual variation [21]. In addition, improved CRFs could significantly reduce uncertainty related to SOC emissions. Current CRFs, consider clay and MAT to estimate SOC stability. Recent work suggests, though, that other, more nuanced soil properties—many of which have been mapped—may better predict SOC stability at the landscape level [63]. Improved CRFs could therefore be derived that explicitly consider these properties. In addition, the scope of CRFs could be expanded to account for differing management regimes and for conversion of wetland soils to further constrain uncertainty using covariate information. Finally, uncertainty was highest for estimated emissions from deep soils (figure S10). While SOC is most frequently measured in surface soils [24], studies suggest the effects of LUC extend to depths of 1 m or greater [24, 25]. The relative lack of observations from deeper soils likely contributes to elevated uncertainty and should be addressed to improve LUC emissions estimation.
Legacies of past land use also affect the size of ecosystem C stocks—particularly SOC—and their response to LUC [16, 64]. While these legacy effects may be indirectly reflected, to some degree, in the observation-based C stock maps considered in our model, they are not considered when determining the sensitivity of SOC stocks. When training the CRFs used in this analysis, Poeplau et al (2011) were careful to only consider data from sites where the natural landcover had not been previously disturbed by human activity [24]. By applying these CRFs to soils that may have been previously cultivated, our approach may over-estimate the sensitivity of some soils to conversion. While future CRFs could be derived that account for various LUC trajectories, the observational nature of our approach may still limit their application in the near term. Given that many spatially explicit LUC maps exclusively depend on the satellite record which extends only back to the 1970s, adequate data may not yet be available to determine LUC trajectories over meaningful time-scales [16]. These shortcomings highlight a benefit of process-based models which at least attempt to reconstruct probable LUC histories when estimating emissions.
Likewise, our modeled estimates may be confounded by the effects of subsequent agricultural management following conversion. Cover cropping on new croplands, for example, may reduce emissions by increasing net primary productivity and reducing C losses from soil erosion. A global meta-analysis found that cover crop adoption could sequester C at an average rate of 0.23 MgC ha−1 yr−1 over 54 years [65], an effect that could offset about one-third of estimated LUC emissions. Some have also argued that no-till management can reduce C emissions from croplands [66]. These reductions though, may be realized only under permanent no-till management since even intermittent tillage can offset the C gained during intervening periods of no tillage [67, 68]. Since factors like crop rotations, soil compaction, and weed management often preclude long-term adherence [69], permanent no-till management is relatively rare [68, 70]. Finally, emissions from subsequent nitrogen (N) fertilizer applications on new croplands could add to estimated emissions. A recent analysis found that N2O emissions from N applications in the US averaged 0.10 MgCO2–Ceq ha−1 yr−1 [71], which suggests that new cropland could source an additional 70 GgCO2–Ceq yr−1 in gross emissions, or, after accounting for ceased N2O emissions from annual cropland abandonment, an additional 30 GgCO2–Ceq yr−1 in net emissions, indefinitely.
4.3. Policy implications
Anthropogenic C emissions, including those from LUC, have far-reaching consequences. It has been estimated that the committed social and economic damages of anthropogenic C emissions (i.e. the 'social cost of carbon'), total $114 MgC–1 [72]. This implies that, at current rates, emissions from US cropland expansion could cost society more than $4.4 billion yr–1. Paradoxically, the agricultural sector may directly feel over $1.2 billion yr–1 of these damages in the form of declining productivity and increased crop failures [73]. Alternatively, minimizing rates of LUC may be a cost-effective way to reduce national emissions. Analyses suggest that avoiding LUC often costs less and achieves far greater emission offsets than restoration of previously converted land [61, 74]. The high societal costs of LUC and the non-commensurate nature of ecosystem restoration thus emphasize the need for policies that promote protection of natural C stocks.
Federal conservation programs could be reoriented and expanded to prioritize C protection and sequestration. The CRP, for example, could be used to explicitly preserve natural C stocks. Since the CRP's enrollment peak in 2007 at 14.9 Mha, enrolled acreage had declined 2.9 Mha by 2012 and by almost 5.4 Mha by 2017 [75]. It is estimated that 30%–41% of cropland expansion considered in our analysis may represent land leaving the CRP [1, 6]. Simply raising the CRP enrollment cap could therefore help reduce conversion and associated emissions. Furthermore, the Environmental Benefits Index used to evaluate candidate lands for CRP enrollment could be expanded to consider both the size and sensitivity of the land's C stock [76]. Similar modifications could also be made to other conservation programs like the Agricultural Conservation Easement Program to further protect natural C stocks.
Given the large emissions associated with US cropland expansion, our study also demonstrates a need to prioritize enhanced management of existing croplands and more appropriately weigh the costs of cropland expansion in meeting agricultural demand. The USDA, for example, could remove structural barriers to cover crop adoption to increase productivity while reducing emissions from croplands [77]. More broadly, studies suggest that both current and projected world demand could be met through production on existing cropland by closing global 'yield gaps,' reducing waste, modifying diets, and revising biofuel policy [78–80]. These strategies would reduce the need for expansion and could thereby significantly reduce LUC emissions.
Sound environmental policy and regulation is predicated on proper C accounting. Our results suggest that previous accounting may have downplayed the environmental effects of cropland expansion by, for one, the underestimating resulting C emissions. These findings are particularly pertinent to biofuel policies whose efficacy is highly sensitive to the magnitude of resulting LUC emissions [52, 53]. Our empirical estimates therefore represent an important check on earlier analyses and demonstrate a relatively accessible method of spatial C accounting that relies on readily available, observational data and that can be used and improved to inform future policy and regulatory decisions.
5. Conclusion
We employed a data-driven modeling framework to assess the magnitude of C emissions from recently observed US cropland expansion. The framework relies exclusively on published spatial data and places special emphasis on non-forest biomass C stocks and SOC stocks that are often overlooked in traditional C accounting but account for the majority of C effected by US LUC. Our general framework can also be applied in similar regions where LUC primarily affects non-forest landcover and compatible spatial data are available. We find—perhaps surprisingly—that despite the dominance of grassland conversion in the US, emissions from domestic LUC are greater than previously thought. Furthermore, since these emissions are primarily sourced from SOC stocks, they may be largely irreversible in the near term. While methodological limitations concerning the effects land use legacies and future management remain, our findings underscore the importance of conserving natural C stocks and add to the growing consensus that avoiding LUC is essential if national C emissions are to be reduced.
Acknowledgments
We thank Chris Kucharik, Erika Marin-Spiotta, Greg Fiske, Annemarie Schneider and George Allez for their helpful comments and suggestions, as well as two anonymous reviewers whose feedback greatly improved this manuscript. Funding was provided by the David and Lucile Packard Foundation and the National Wildlife Federation.